series_fit_poly_fl()
함수 series_fit_poly_fl() 는 계열에 다항식 회귀를 적용하는 UDF(사용자 정의 함수) 입니다. 이 함수는 여러 계열(동적 숫자 배열)이 포함된 테이블을 사용하고 다항식 회귀를 사용하여 각 계열에 가장 적합한 고차 다항식 을 생성합니다. 이 함수는 계열 범위에서 다항 계수와 보간된 다항식 모두를 반환합니다.
참고
- 이 문서에 설명된 함수 대신 네이티브 함수 series_fit_poly() 를 사용합니다. 네이티브 함수는 동일한 기능을 제공하며 성능 및 확장성에 더 적합합니다. 이 문서는 참조 목적으로만 제공됩니다.
- 메이크 시리즈 연산자가 만든 균등 간격 계열의 선형 회귀의 경우 네이티브 함수 series_fit_line()를 사용합니다.
사전 요구 사항
- 클러스터에서 Python 플러그 인 을 사용하도록 설정해야 합니다. 함수에 사용되는 인라인 Python에 필요합니다.
- 데이터베이스에서 Python 플러그 인 을 사용하도록 설정해야 합니다. 함수에 사용되는 인라인 Python에 필요합니다.
Syntax
T | invoke series_fit_poly_fl(, y_series, y_fit_series, fit_coeff학위, [ x_series ], [ x_istime ])
구문 규칙에 대해 자세히 알아봅니다.
매개 변수
| 이름 | 형식 | 필수 | Description |
|---|---|---|---|
| y_series | string |
✔️ | 종속 변수를 포함하는 입력 테이블 열의 이름입니다. 즉, 맞을 시리즈입니다. |
| y_fit_series | string |
✔️ | 가장 적합한 계열을 저장할 열의 이름입니다. |
| fit_coeff | string |
✔️ | 가장 적합한 다항 계수를 저장할 열의 이름입니다. |
| 학위 | int |
✔️ | 맞춤할 다항식의 필수 순서입니다. 예를 들어 선형 회귀의 경우 1, 이차 회귀의 경우 2 등입니다. |
| x_series | string |
독립 변수, 즉 x 또는 시간 축을 포함하는 열의 이름입니다. 이 매개 변수는 선택 사항이며 간격이 고르지 않은 계열에만 필요합니다. x는 균등 간격 계열의 회귀에 중복되므로 기본값은 빈 문자열입니다. | |
| x_istime | bool |
이 매개 변수는 x_series 지정되고 datetime의 벡터인 경우에만 필요합니다. |
함수 정의
코드를 쿼리 정의 함수로 포함하거나 다음과 같이 데이터베이스에 저장된 함수로 만들어 함수를 정의할 수 있습니다.
다음 let 문을 사용하여 함수를 정의합니다. 사용 권한이 필요 없습니다.
let series_fit_poly_fl=(tbl:(*), y_series:string, y_fit_series:string, fit_coeff:string, degree:int, x_series:string='', x_istime:bool=False)
{
    let kwargs = bag_pack('y_series', y_series, 'y_fit_series', y_fit_series, 'fit_coeff', fit_coeff, 'degree', degree, 'x_series', x_series, 'x_istime', x_istime);
    let code = ```if 1:
        y_series = kargs["y_series"]
        y_fit_series = kargs["y_fit_series"]
        fit_coeff = kargs["fit_coeff"]
        degree = kargs["degree"]
        x_series = kargs["x_series"]
        x_istime = kargs["x_istime"]

        def fit(ts_row, x_col, y_col, deg):
            y = ts_row[y_col]
            if x_col == "": # If there is no x column creates sequential range [1, len(y)]
               x = np.arange(len(y)) + 1
            else: # if x column exists check whether its a time column. If so, normalize it to the [1, len(y)] range, else take it as is.
               if x_istime:
                   x = pd.to_numeric(pd.to_datetime(ts_row[x_col]))
                   x = x - x.min()
                   x = x / x.max()
                   x = x * (len(x) - 1) + 1
               else:
                   x = ts_row[x_col]
            coeff = np.polyfit(x, y, deg)
            p = np.poly1d(coeff)
            z = p(x)
            return z, coeff

        result = df
        if len(df):
           result[[y_fit_series, fit_coeff]] = df.apply(fit, axis=1, args=(x_series, y_series, degree,), result_type="expand")
    ```;
    tbl
     | evaluate python(typeof(*), code, kwargs)
};
// Write your query to use the function here.
예제
다음 예제에서는 invoke 연산자를 사용하여 함수를 실행합니다.
정규 시계열에 다섯 번째 순서 다항식 맞춤
쿼리 정의 함수를 사용하려면 포함된 함수 정의 다음에 호출합니다.
let series_fit_poly_fl=(tbl:(*), y_series:string, y_fit_series:string, fit_coeff:string, degree:int, x_series:string='', x_istime:bool=False)
{
let kwargs = bag_pack('y_series', y_series, 'y_fit_series', y_fit_series, 'fit_coeff', fit_coeff, 'degree', degree, 'x_series', x_series, 'x_istime', x_istime);
let code = ```if 1:
y_series = kargs["y_series"]
y_fit_series = kargs["y_fit_series"]
fit_coeff = kargs["fit_coeff"]
degree = kargs["degree"]
x_series = kargs["x_series"]
x_istime = kargs["x_istime"]
def fit(ts_row, x_col, y_col, deg):
y = ts_row[y_col]
if x_col == "": # If there is no x column creates sequential range [1, len(y)]
x = np.arange(len(y)) + 1
else: # if x column exists check whether its a time column. If so, normalize it to the [1, len(y)] range, else take it as is.
if x_istime:
x = pd.to_numeric(pd.to_datetime(ts_row[x_col]))
x = x - x.min()
x = x / x.max()
x = x * (len(x) - 1) + 1
else:
x = ts_row[x_col]
coeff = np.polyfit(x, y, deg)
p = np.poly1d(coeff)
z = p(x)
return z, coeff
result = df
if len(df):
result[[y_fit_series, fit_coeff]] = df.apply(fit, axis=1, args=(x_series, y_series, degree,), result_type="expand")
```;
tbl
| evaluate python(typeof(*), code, kwargs)
};
//
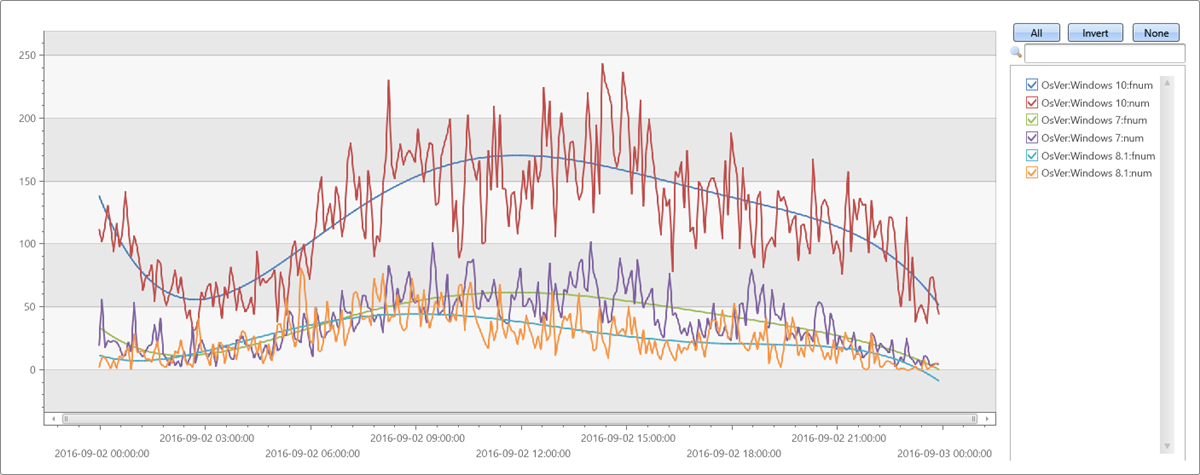
// Fit fifth order polynomial to a regular (evenly spaced) time series, created with make-series
//
let max_t = datetime(2016-09-03);
demo_make_series1
| make-series num=count() on TimeStamp from max_t-1d to max_t step 5m by OsVer
| extend fnum = dynamic(null), coeff=dynamic(null), fnum1 = dynamic(null), coeff1=dynamic(null)
| invoke series_fit_poly_fl('num', 'fnum', 'coeff', 5)
| render timechart with(ycolumns=num, fnum)
출력
불규칙한 시계열 테스트
쿼리 정의 함수를 사용하려면 포함된 함수 정의 다음에 호출합니다.
let series_fit_poly_fl=(tbl:(*), y_series:string, y_fit_series:string, fit_coeff:string, degree:int, x_series:string='', x_istime:bool=False)
{
let kwargs = bag_pack('y_series', y_series, 'y_fit_series', y_fit_series, 'fit_coeff', fit_coeff, 'degree', degree, 'x_series', x_series, 'x_istime', x_istime);
let code = ```if 1:
y_series = kargs["y_series"]
y_fit_series = kargs["y_fit_series"]
fit_coeff = kargs["fit_coeff"]
degree = kargs["degree"]
x_series = kargs["x_series"]
x_istime = kargs["x_istime"]
def fit(ts_row, x_col, y_col, deg):
y = ts_row[y_col]
if x_col == "": # If there is no x column creates sequential range [1, len(y)]
x = np.arange(len(y)) + 1
else: # if x column exists check whether its a time column. If so, normalize it to the [1, len(y)] range, else take it as is.
if x_istime:
x = pd.to_numeric(pd.to_datetime(ts_row[x_col]))
x = x - x.min()
x = x / x.max()
x = x * (len(x) - 1) + 1
else:
x = ts_row[x_col]
coeff = np.polyfit(x, y, deg)
p = np.poly1d(coeff)
z = p(x)
return z, coeff
result = df
if len(df):
result[[y_fit_series, fit_coeff]] = df.apply(fit, axis=1, args=(x_series, y_series, degree,), result_type="expand")
```;
tbl
| evaluate python(typeof(*), code, kwargs)
};
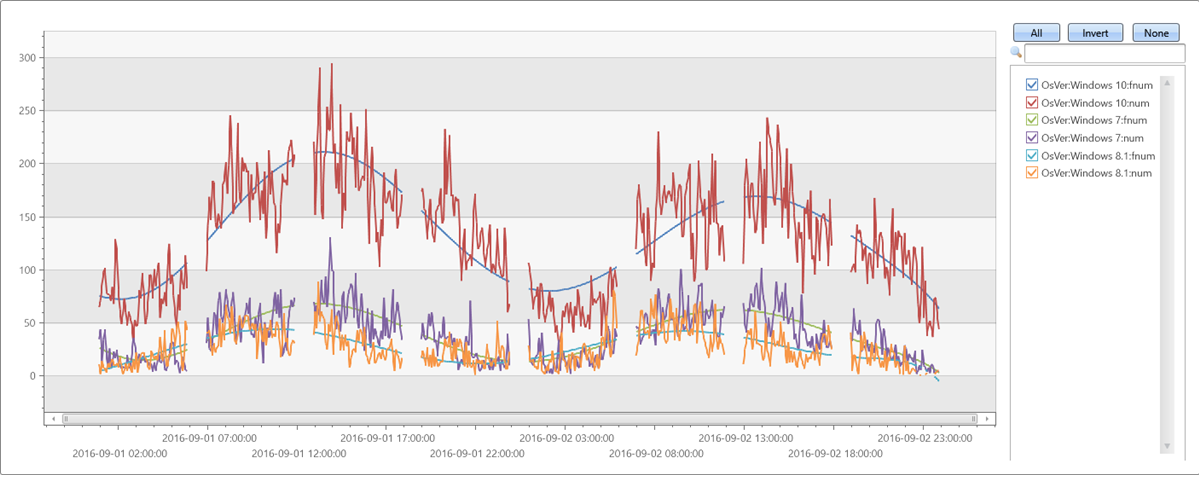
let max_t = datetime(2016-09-03);
demo_make_series1
| where TimeStamp between ((max_t-2d)..max_t)
| summarize num=count() by bin(TimeStamp, 5m), OsVer
| order by TimeStamp asc
| where hourofday(TimeStamp) % 6 != 0 // delete every 6th hour to create unevenly spaced time series
| summarize TimeStamp=make_list(TimeStamp), num=make_list(num) by OsVer
| extend fnum = dynamic(null), coeff=dynamic(null)
| invoke series_fit_poly_fl('num', 'fnum', 'coeff', 8, 'TimeStamp', True)
| render timechart with(ycolumns=num, fnum)
출력
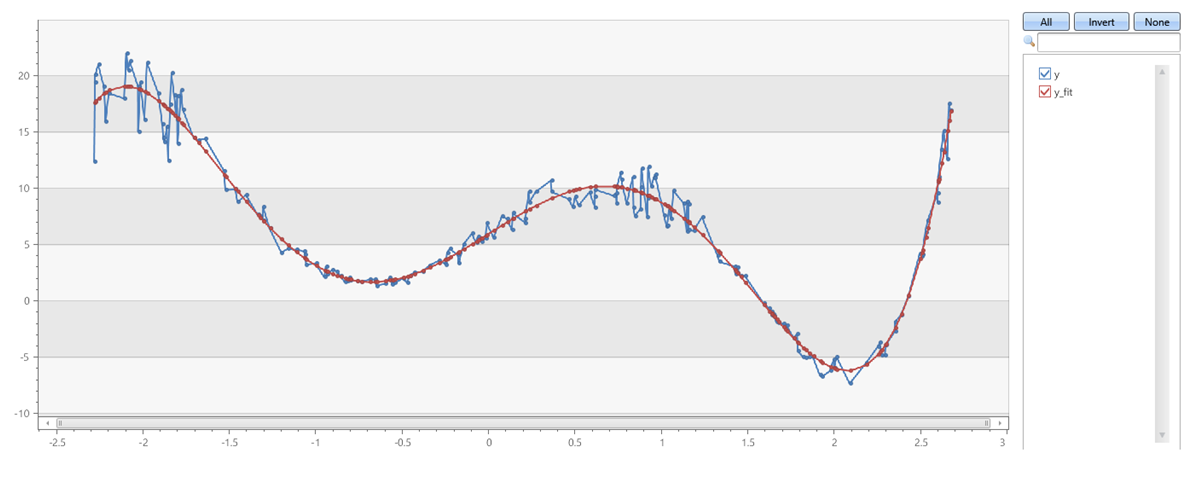
x & y 축에 노이즈가 있는 다섯 번째 순서 다항식
쿼리 정의 함수를 사용하려면 포함된 함수 정의 다음에 호출합니다.
let series_fit_poly_fl=(tbl:(*), y_series:string, y_fit_series:string, fit_coeff:string, degree:int, x_series:string='', x_istime:bool=False)
{
let kwargs = bag_pack('y_series', y_series, 'y_fit_series', y_fit_series, 'fit_coeff', fit_coeff, 'degree', degree, 'x_series', x_series, 'x_istime', x_istime);
let code = ```if 1:
y_series = kargs["y_series"]
y_fit_series = kargs["y_fit_series"]
fit_coeff = kargs["fit_coeff"]
degree = kargs["degree"]
x_series = kargs["x_series"]
x_istime = kargs["x_istime"]
def fit(ts_row, x_col, y_col, deg):
y = ts_row[y_col]
if x_col == "": # If there is no x column creates sequential range [1, len(y)]
x = np.arange(len(y)) + 1
else: # if x column exists check whether its a time column. If so, normalize it to the [1, len(y)] range, else take it as is.
if x_istime:
x = pd.to_numeric(pd.to_datetime(ts_row[x_col]))
x = x - x.min()
x = x / x.max()
x = x * (len(x) - 1) + 1
else:
x = ts_row[x_col]
coeff = np.polyfit(x, y, deg)
p = np.poly1d(coeff)
z = p(x)
return z, coeff
result = df
if len(df):
result[[y_fit_series, fit_coeff]] = df.apply(fit, axis=1, args=(x_series, y_series, degree,), result_type="expand")
```;
tbl
| evaluate python(typeof(*), code, kwargs)
};
range x from 1 to 200 step 1
| project x = rand()*5 - 2.3
| extend y = pow(x, 5)-8*pow(x, 3)+10*x+6
| extend y = y + (rand() - 0.5)*0.5*y
| summarize x=make_list(x), y=make_list(y)
| extend y_fit = dynamic(null), coeff=dynamic(null)
| invoke series_fit_poly_fl('y', 'y_fit', 'coeff', 5, 'x')
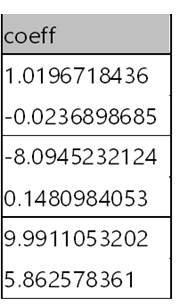
|fork (project-away coeff) (project coeff | mv-expand coeff)
| render linechart
출력
이 기능은 지원되지 않습니다.
피드백
출시 예정: 2024년 내내 콘텐츠에 대한 피드백 메커니즘으로 GitHub 문제를 단계적으로 폐지하고 이를 새로운 피드백 시스템으로 바꿀 예정입니다. 자세한 내용은 다음을 참조하세요. https://aka.ms/ContentUserFeedback
다음에 대한 사용자 의견 제출 및 보기