series_uv_change_points_fl()
이 함수 series_uv_change_points_fl() 는 Azure Cognitive Services의 일부인 일변량 변칙 검색 API를 호출하여 시계열에서 변경점을 찾는 UDF(사용자 정의 함수)입니다. 이 함수는 숫자 동적 배열, 변화 지점 검색 임계값 및 안정적인 추세 창의 최소 크기로 제한된 시계열 집합을 허용합니다. 각 시계열은 필수 JSON 형식으로 변환되어 Anomaly Detector 서비스 엔드포인트에 게시됩니다. 서비스 응답에는 변경 지점의 동적 배열, 해당 신뢰도 및 검색된 계절성이 포함됩니다.
참고 항목
확장성이 높고 더 빠르게 실행되는 네이티브 함수 series_decompose_anomalies() 를 사용하는 것이 좋습니다.
필수 구성 요소
- Azure 구독 평가판 Azure 계정을 만듭니다.
- 클러스터 및 데이터베이스 클러스터 및 데이터베이스를 만듭니다.
- 클러스터에서 Python 플러그 인을 사용하도록 설정해야 합니다. 이 작업은 함수에 사용되는 인라인 Python에 필요합니다.
- Anomaly Detector 리소스를 만들고 해당 키를 가져와서 서비스에 액세스합니다.
- 클러스터에서 http_request 플러그 인/http_request_post 플러그 인 을 사용하도록 설정하여 변칙 검색 서비스 엔드포인트에 액세스합니다.
- 변칙 검색 서비스 엔드포인트에 액세스하도록 형식
webapi에 대한 설명선 정책을 수정합니다.
구문
T | invoke series_uv_change_points_fl( y_series [, score_threshold [, trend_window [, tsid]]])
구문 규칙에 대해 자세히 알아봅니다.
매개 변수
| 이름 | Type | 필수 | 설명 |
|---|---|---|---|
| y_series | string |
✔️ | 변칙이 검색될 계열 값을 포함하는 입력 테이블 열의 이름입니다. |
| score_threshold | real |
변경 지점을 선언할 최소 신뢰도를 지정하는 값입니다. 신뢰도가 임계값을 초과하는 각 지점은 변경 지점으로 정의됩니다. 기본값: 0.9 | |
| trend_window | 정수 | 추세 변경 내용을 강력하게 계산하기 위한 최소 창 크기를 지정하는 값입니다. 기본값: 5 | |
| tsid | string |
시계열 ID를 포함하는 입력 테이블 열의 이름입니다. 단일 시계열을 분석할 때 생략할 수 있습니다. |
함수 정의
다음과 같이 해당 코드를 쿼리 정의 함수로 포함하거나 데이터베이스에 저장된 함수로 만들어 함수를 정의할 수 있습니다.
다음 let 문을 사용하여 함수를 정의합니다. 사용 권한이 필요 없습니다. 다음 함수 정의에서 URI 및 YOUR-KEY Ocp-Apim-Subscription-Key 헤더에서 Anomaly Detector 리소스 이름 및 키로 바꿉 YOUR-AD-RESOURCE-NAME 다.
Important
let 문은 자체적으로 실행할 수 없습니다. 그 뒤에 테이블 형식 식 문이 있어야 합니다. 작업 예제 series_uv_change_points_fl()를 실행하려면 예제를 참조 하세요.
let series_uv_change_points_fl=(tbl:(*), y_series:string, score_threshold:real=0.9, trend_window:int=5, tsid:string='_tsid')
{
    let uri = 'https://YOUR-AD-RESOURCE-NAME.cognitiveservices.azure.com/anomalydetector/v1.0/timeseries/changepoint/detect';
    let headers=dynamic({'Ocp-Apim-Subscription-Key': h'YOUR-KEY'});
    let kwargs = bag_pack('y_series', y_series, 'score_threshold', score_threshold, 'trend_window', trend_window);
    let code = ```if 1:
        import json
        y_series = kargs["y_series"]
        score_threshold = kargs["score_threshold"]
        trend_window = kargs["trend_window"]
        json_str = []
        for i in range(len(df)):
            row = df.iloc[i, :]
            ts = [{'value':row[y_series][j]} for j in range(len(row[y_series]))]
            json_data = {'series': ts, "threshold":score_threshold, "stableTrendWindow": trend_window}     # auto-detect period, or we can force 'period': 84
            json_str = json_str + [json.dumps(json_data)]
        result = df
        result['json_str'] = json_str
    ```;
    tbl
    | evaluate python(typeof(*, json_str:string), code, kwargs)
    | extend _tsid = column_ifexists(tsid, 1)
    | partition by _tsid (
       project json_str
       | evaluate http_request_post(uri, headers, dynamic(null))
        | project period=ResponseBody.period, change_point=series_add(0, ResponseBody.isChangePoint), confidence=ResponseBody.confidenceScores
        | extend _tsid=toscalar(_tsid)
       )
};
// Write your query to use the function here.
예시
다음 예제에서는 호출 연산자를 사용하여 함수를 실행합니다.
쿼리 정의 함수를 사용하려면 포함된 함수 정의 후에 호출합니다.
let series_uv_change_points_fl=(tbl:(*), y_series:string, score_threshold:real=0.9, trend_window:int=5, tsid:string='_tsid')
{
    let uri = 'https://YOUR-AD-RESOURCE-NAME.cognitiveservices.azure.com/anomalydetector/v1.0/timeseries/changepoint/detect';
    let headers=dynamic({'Ocp-Apim-Subscription-Key': h'YOUR-KEY'});
    let kwargs = bag_pack('y_series', y_series, 'score_threshold', score_threshold, 'trend_window', trend_window);
    let code = ```if 1:
        import json
        y_series = kargs["y_series"]
        score_threshold = kargs["score_threshold"]
        trend_window = kargs["trend_window"]
        json_str = []
        for i in range(len(df)):
            row = df.iloc[i, :]
            ts = [{'value':row[y_series][j]} for j in range(len(row[y_series]))]
            json_data = {'series': ts, "threshold":score_threshold, "stableTrendWindow": trend_window}     # auto-detect period, or we can force 'period': 84
            json_str = json_str + [json.dumps(json_data)]
        result = df
        result['json_str'] = json_str
    ```;
    tbl
    | evaluate python(typeof(*, json_str:string), code, kwargs)
    | extend _tsid = column_ifexists(tsid, 1)
    | partition by _tsid (
       project json_str
       | evaluate http_request_post(uri, headers, dynamic(null))
        | project period=ResponseBody.period, change_point=series_add(0, ResponseBody.isChangePoint), confidence=ResponseBody.confidenceScores
        | extend _tsid=toscalar(_tsid)
       )
};
let ts = range x from 1 to 300 step 1
| extend y=iff(x between (100 .. 110) or x between (200 .. 220), 20, 5)
| extend ts=datetime(2021-01-01)+x*1d
| extend y=y+4*rand()
| summarize ts=make_list(ts), y=make_list(y)
| extend sid=1;
ts
| invoke series_uv_change_points_fl('y', 0.8, 10, 'sid')
| join ts on $left._tsid == $right.sid
| project-away _tsid
| project-reorder y, *      //  just to visualize the anomalies on top of y series
| render anomalychart with(xcolumn=ts, ycolumns=y, confidence, anomalycolumns=change_point)
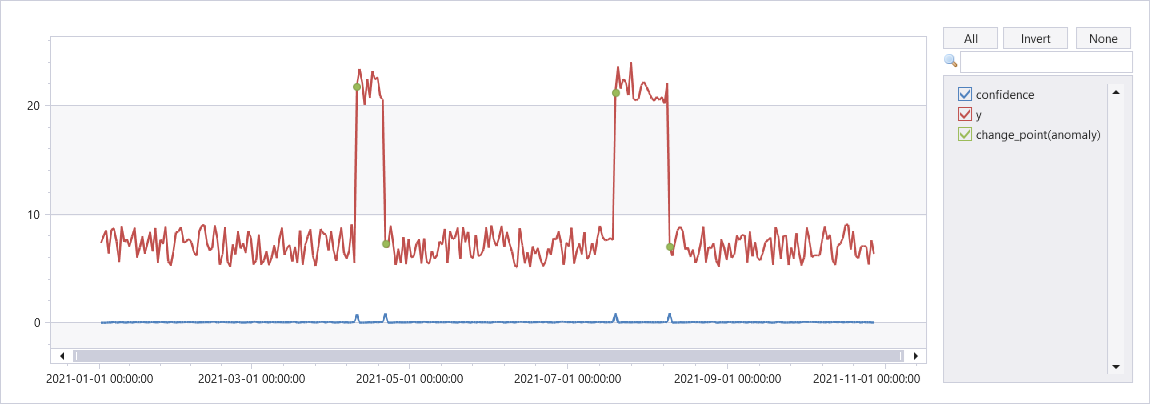
출력
다음 그래프는 시계열의 변경 지점을 보여줍니다.
이 기능은 지원되지 않습니다.
피드백
출시 예정: 2024년 내내 콘텐츠에 대한 피드백 메커니즘으로 GitHub 문제를 단계적으로 폐지하고 이를 새로운 피드백 시스템으로 바꿀 예정입니다. 자세한 내용은 다음을 참조하세요. https://aka.ms/ContentUserFeedback
다음에 대한 사용자 의견 제출 및 보기