ARMClient를 사용하여 연결 모니터 만들기
Important
2021년 7월 1일부터 기존 작업 영역에 새 테스트를 추가하거나 네트워크 성능 모니터에서 새 작업 영역을 사용하도록 설정할 수 없습니다. 또한 연결 모니터(클래식)에서 새 연결 모니터를 추가할 수 없습니다. 2021년 7월 1일 이전에 만든 테스트 및 연결 모니터는 계속 사용할 수 있습니다. 현재 워크로드에 대한 서비스 중단을 최소화하려면 2024년 2월 29일 이전에 네트워크 성능 모니터에서 테스트를 마이그레이션하거나 Azure Network Watcher의 새 연결 모니터로 연결 모니터(클래식)에서 마이그레이션 합니다.
ARMClient를 사용하여 리소스 간의 통신을 모니터링하는 연결 모니터를 만드는 방법에 대해 알아봅니다. 하이브리드 및 Azure 클라우드 배포를 지원합니다.
시작하기 전에
연결 모니터에서 만든 연결 모니터에서는 온-프레미스 컴퓨터와 Azure VM을 모두 원본으로 추가할 수 있습니다. 이러한 연결 모니터는 엔드포인트에 대한 연결을 모니터링할 수도 있습니다. 엔드포인트는 Azure 또는 다른 URL 또는 IP에 있을 수 있습니다.
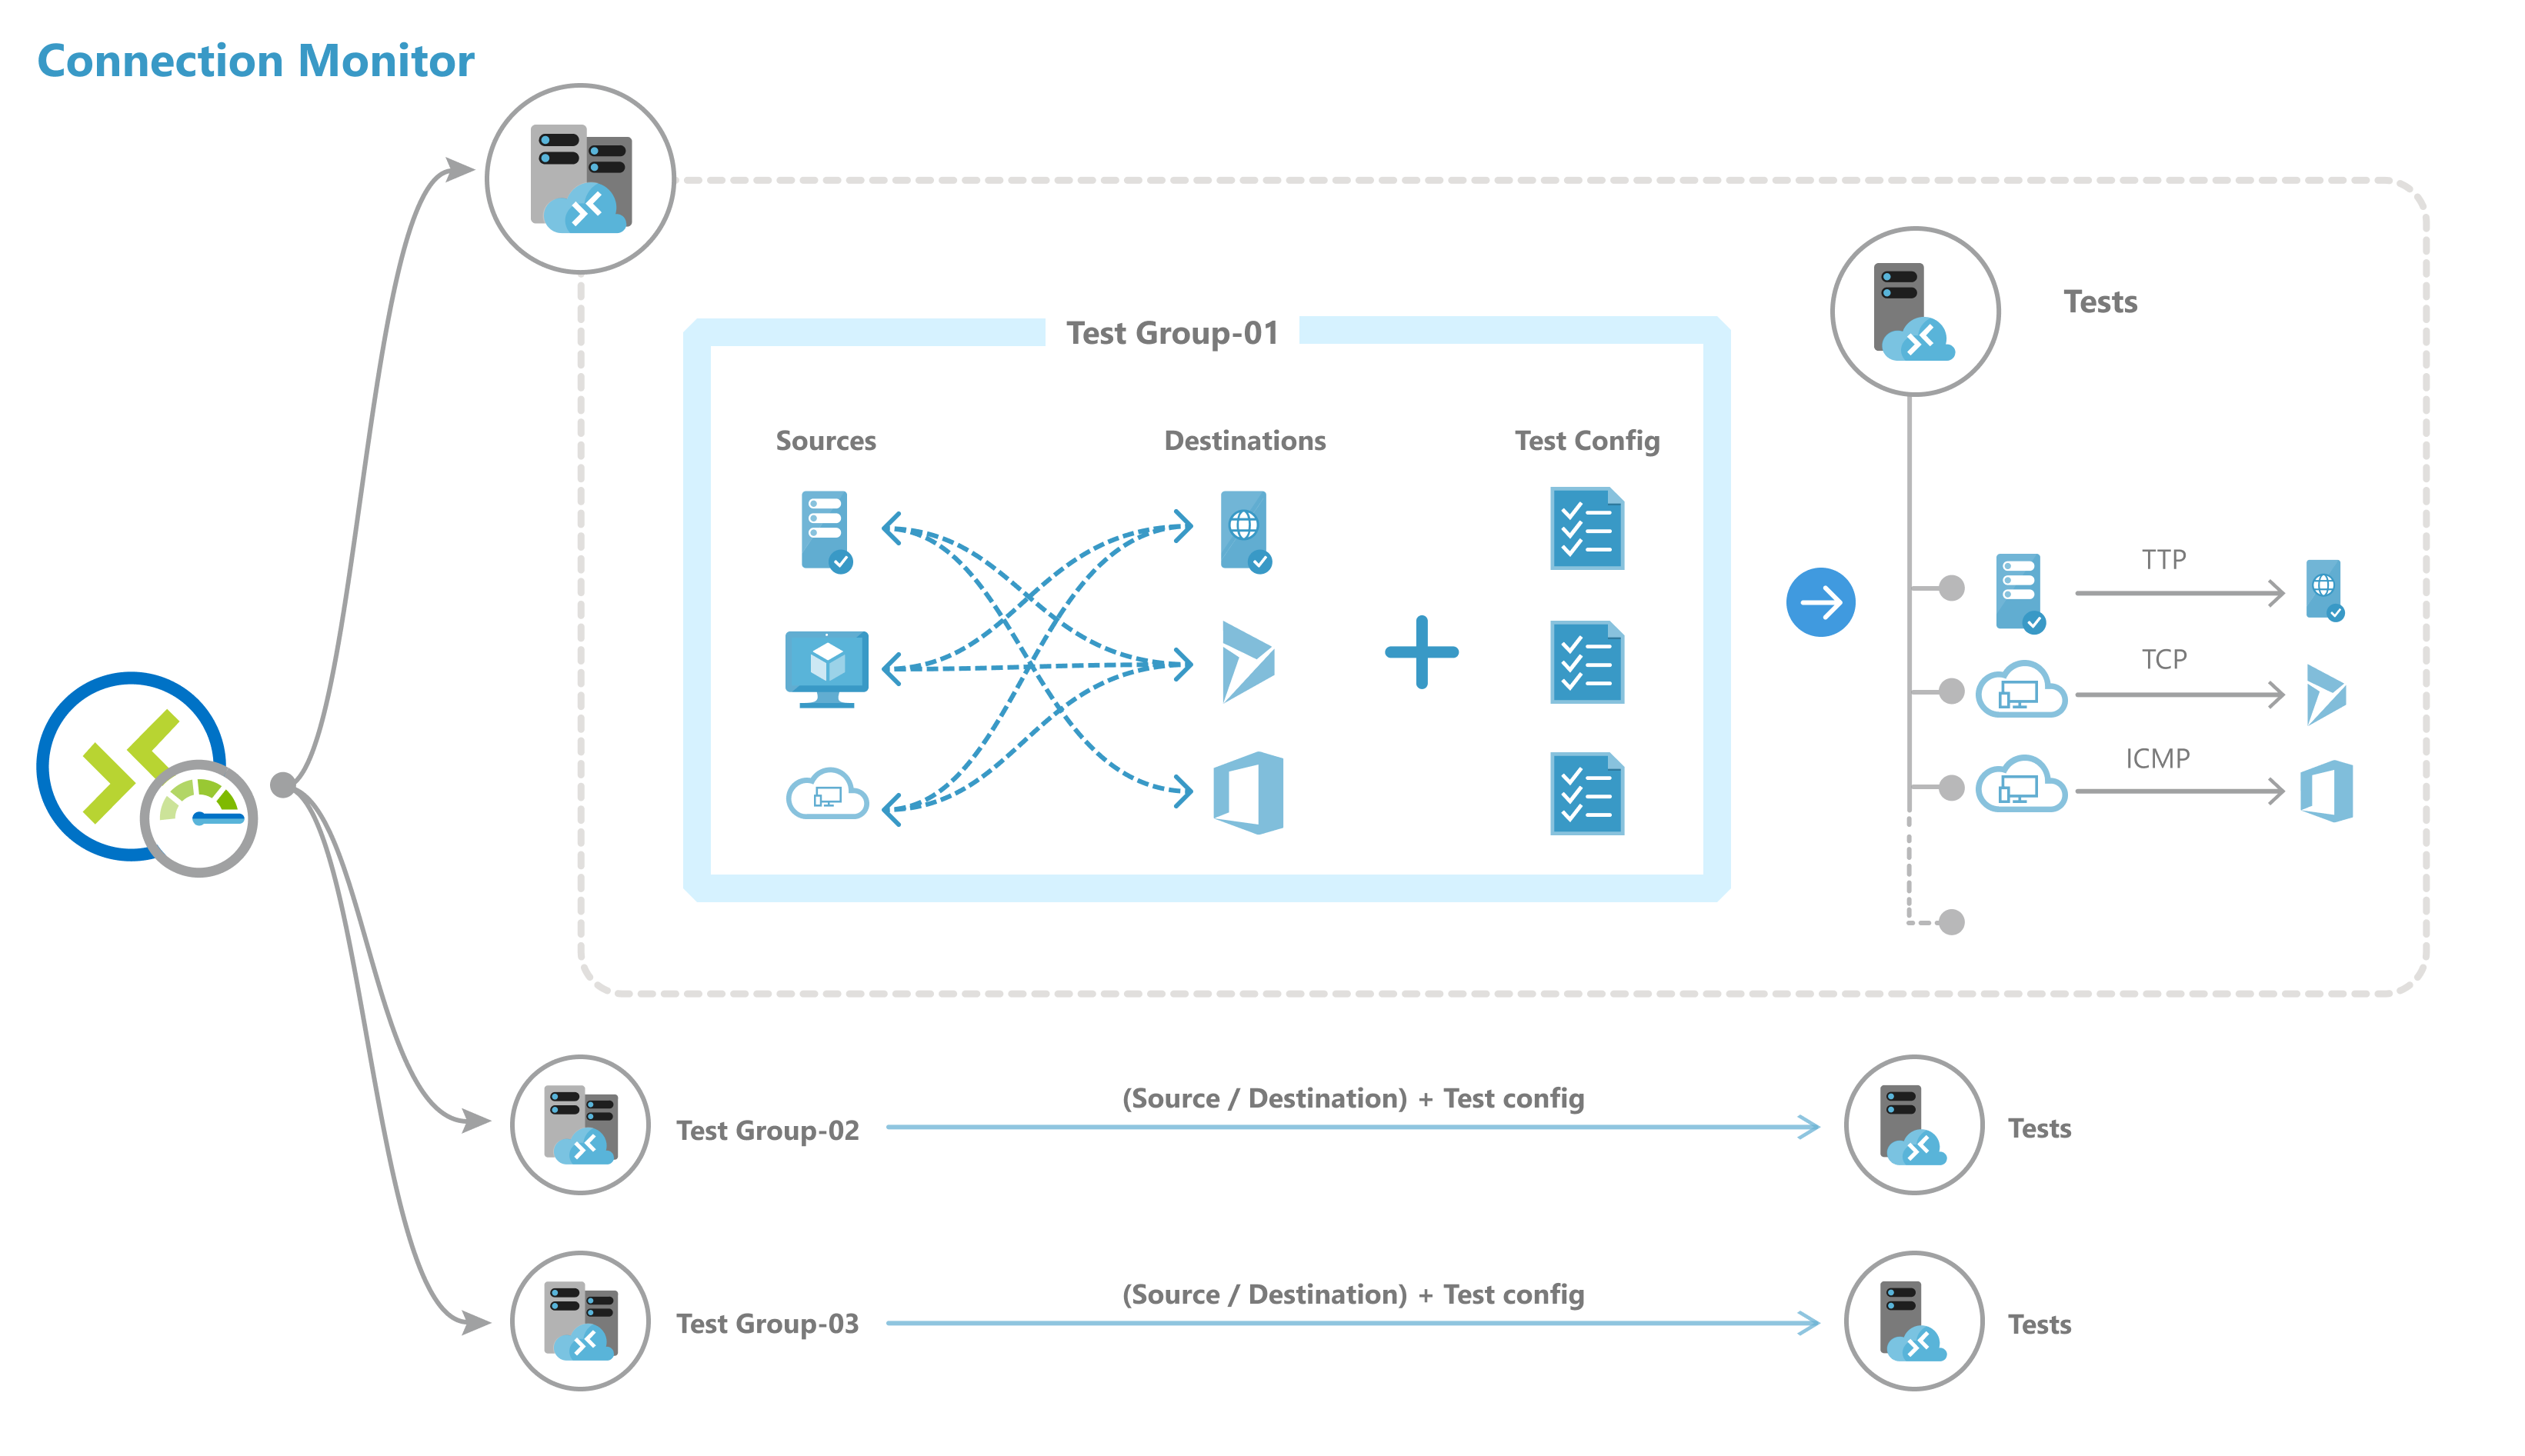
연결 모니터에는 다음 엔터티가 포함됩니다.
연결 모니터 리소스 – 지역별 Azure 리소스입니다. 다음 엔터티는 모두 연결 모니터 리소스의 속성입니다.
엔드포인트 – 연결 확인에 참여하는 원본 또는 대상입니다. 엔드포인트의 예로는 Azure VM, 온-프레미스 에이전트, URL 및 IP가 있습니다.
테스트 구성 – 테스트를 위한 프로토콜별 구성입니다. 선택한 프로토콜에 따라 포트, 임계값, 테스트 빈도 및 기타 매개 변수를 정의할 수 있습니다.
테스트 그룹 – 원본 엔드포인트, 대상 엔드포인트 및 테스트 구성을 포함하는 그룹입니다. 연결 모니터는 둘 이상의 테스트 그룹을 포함할 수 있습니다.
테스트 – 원본 엔드포인트, 대상 엔드포인트 및 테스트 구성의 조합입니다. 테스트는 모니터링 데이터를 사용할 수 있는 가장 세분화된 수준입니다. 모니터링 데이터에는 실패한 검사 비율과 RTT(왕복 시간)가 포함됩니다.
ARMClient를 사용하여 연결 모니터를 만드는 단계
ARMClient를 사용하여 연결 모니터를 만들려면 다음 코드를 사용합니다.
$connectionMonitorName = "sampleConnectionMonitor"

$ARM = "https://management.azure.com"

$SUB = "subscriptions/<subscription id 1>;"

$NW = "resourceGroups/NetworkWatcherRG/providers/Microsoft.Network/networkWatchers/NetworkWatcher\_<region>"

$body =

"{

location: '<region>',

properties: {

endpoints: [{

name: 'endpoint_workspace_machine',

type: 'MMAWorkspaceMachine',

resourceId: '/subscriptions/<subscription id>/resourcegroups/<resource group>/providers/Microsoft.OperationalInsights/workspaces/sampleWorkspace',

//Example 1: Choose a machine

address : '<non-Azure machine FQDN>'
}

//Example 2: Select IP from chosen machines

address : '<non-Azure machine FQDN>

"scope": {
      "include": [
            {
                  "address": "<IP belonging to machine chosen above>"
	    }
       ]
      }
   }

name: 'endpoint_workspace_network',

type: 'MMAWorkspaceNetwork',

resourceId: '/subscriptions/<subscription id>/resourcegroups/<resource group>/providers/Microsoft.OperationalInsights/workspaces/sampleWorkspace',

 coverage level : 'high', //Optional

 //Include subnets. You can also exclude IPs from subnet to exclude from monitoring

 scope: {
      "include": [
            {
                  "address": "<subnet 1 mask>" // Eg: 10.10.1.0/28
            },
            {
                  "address": "<subnet 2 mask>"
            }
      ],
      "exclude": [
      		{
      		"address" : "<ip-from-included-subnets-that-should-be-excluded>"
		}
      ]
     }
},

//Use a Azure VM as an endpoint
{

name: 'endpoint_virtualmachine',

resourceId: '/subscriptions/<subscription id>/resourceGroups/<resource group>/providers/Microsoft.Compute/virtualMachines/<vm-name>'

},

//Use an Azure VNET or Subnet as an endpoint

 {

name: 'endpoint_vnet_subnet',

resourceId: '<resource id of VNET or subnet'
coverage level: 'high' //Optional

//Scope is optional.

  "scope": {
      "include": [
            {
                  "address": "<subnet 1 mask>" // Eg: 10.10.1.0/28 .This subnet should match with any existing subnet in vnet
            }
      ],
    "exclude": [
            {
                  "address": "<ip-from-included-subnets-that-should-be-excluded>" // If used with include, IP should be part of the subnet defined above. Without include, this could be any address within vnet range or any specific subnet range as a whole.
            }
      ]
  }
   },

//Endpoint as a URL
{

name: 'azure portal'

address: '<URL>'

   },

//Endpoint as an IP
 {

    name: 'ip',

     address: '<IP>'

 }

  ],

  testGroups: [{

    name: 'Connectivity to Azure Portal and Public IP',

    testConfigurations: ['http', 'https', 'tcpEnabled', 'icmpEnabled'],

    sources: ['vm1', 'workspace'],

    destinations: ['azure portal', 'ip']

   },

{

    name: 'Connectivty from Azure VM 1 to Azure VM 2',

   // Choose your protocol

    testConfigurations: ['http', 'https', 'tcpDisabled', 'icmpDisabled'],

    sources: ['vm1'],

    destinations: ['vm2'],

    disable: true

   }

  ],

  testConfigurations: [{

    name: 'http',

    testFrequencySec: <frequency>,

    protocol: 'HTTP',

    successThreshold: {

     checksFailedPercent: <threshold for checks failed %>,

     roundTripTimeMs: <threshold for RTT>

    }

   }, {

    name: 'https',

    testFrequencySec: <frequency>,

    protocol: 'HTTP',

    httpConfiguration: {

     port: '<port of choice>'

    preferHTTPS: true // If port chosen isn't 80 or 443

    method: 'GET', //Choose GET or POST

    path: '/', //Specify path for request

    requestHeaders: [
            {
              "name": "Content-Type",
              "value": "appication/json"
            }
          ],

    validStatusCodeRanges: [ "102", "200-202", "3xx" ], //Samples

    },

    successThreshold: {

     checksFailedPercent: <choose your checks failed threshold>,

     roundTripTimeMs: <choose your RTT threshold>

    }

   },
   {

    name: 'tcpEnabled',

    testFrequencySec: <frequency>,

    protocol: 'TCP',

    tcpConfiguration: {

     port: 80

    },

    successThreshold: {

     checksFailedPercent: <choose your checks failed threshold>,

     roundTripTimeMs: <choose your RTT threshold>

    }

   }, {

    name: 'icmpEnabled',

    testFrequencySec: <frequency>,

    protocol: 'ICMP',

    successThreshold: {

     checksFailedPercent: <choose your checks failed threshold>,

     roundTripTimeMs: <choose your RTT threshold>

    }

   }, {

    name: 'icmpDisabled',

    testFrequencySec: <frequency>,

    protocol: 'ICMP',

    icmpConfiguration: {

     disableTraceRoute: true

    },

    successThreshold: {

     checksFailedPercent: <choose your checks failed threshold>,

     roundTripTimeMs: <choose your RTT threshold>

    }

   }, {

    name: 'tcpDisabled',

    testFrequencySec: <frequency>,

    protocol: 'TCP',

    tcpConfiguration: {

     port: 80,

     disableTraceRoute: true

    },

    successThreshold: {

     checksFailedPercent: <choose your checks failed threshold>,

     roundTripTimeMs: <choose your RTT threshold>

    }

   }

  ]

 }

} "
배포 명령은 다음과 같습니다.
armclient PUT $ARM/$SUB/$NW/connectionMonitors/$connectionMonitorName/?api-version=2019-07-01 $body -verbose
속성 설명
connectionMonitorName - 연결 모니터 리소스의 이름입니다
SUB - 연결 모니터를 만들려는 구독의 구독 ID
NW - CM을 만들 Network Watcher 리소스 ID
location - 연결 모니터를 만들 지역
끝점
- name - 각 엔드포인트에 대한 고유한 이름
- resourceId - Azure 엔드포인트의 경우 리소스 ID는 VM에 대한 Azure Resource Manager 리소스 ID를 나타냅니다. 비 Azure 엔드포인트의 경우 리소스 ID는 비 Azure 에이전트에 연결된 Log Analytics 작업 영역에 대한 Azure Resource Manager 리소스 ID를 나타냅니다.
- address – 리소스 ID가 지정되지 않았거나 리소스 ID가 Log Analytics 작업 영역인 경우에만 적용됩니다. Log Analytics 리소스 ID와 함께 사용하는 경우 모니터링에 사용할 수 있는 에이전트의 FQDN을 나타냅니다. 리소스 ID 없이 사용하는 경우 공용 엔드포인트의 URL 또는 IP일 수 있습니다.
- filter – 비 Azure 엔드포인트의 경우 필터를 사용하여 연결 모니터 리소스에서 모니터링하는 데 사용할 Log Analytics 작업 영역에서 에이전트를 선택합니다. 필터를 설정하지 않으면 Log Analytics 작업 영역에 속하는 모든 에이전트를 모니터링에 사용할 수 있습니다
- type – 형식을 "에이전트 주소"로 설정
- address – 주소를 온-프레미스 에이전트의 FQDN으로 설정
테스트 그룹
- name - 테스트 그룹의 이름입니다.
- testConfigurations - 대상 엔드포인트에 연결하는 원본 엔드포인트를 기준으로 하는 테스트 구성
- sources - 위에서 만든 엔드포인트에서 선택합니다. Azure 기반 원본 엔드포인트는 Azure Network Watcher 확장을 설치해야 하며 비 Azure 기반 원본 엔드포인트는 Azure Log Analytics 에이전트가 설치되어야 합니다. 원본에 대한 에이전트를 설치하려면 모니터링 에이전트 설치를 참조하세요.
- destinations - 위에서 만든 엔드포인트에서 선택합니다. 대상으로 지정하여 Azure VM 또는 엔드포인트(공용 IP, URL 또는 FQDN)에 대한 연결을 모니터링할 수 있습니다. 단일 테스트 그룹에서 Azure VM, Office 365 URL, Dynamics 365 URL 및 사용자 지정 엔드포인트를 추가할 수 있습니다.
- disable - 이 필드를 사용하여 테스트 그룹에서 지정하는 모든 원본 및 대상에 대해 모니터링을 사용하지 않도록 설정합니다.
테스트 구성
name - 테스트 구성의 이름입니다.
testFrequencySec - 원본에서 지정된 프로토콜 및 포트의 대상을 ping하는 빈도를 지정합니다. 30초, 1분, 5분, 15분 또는 30분을 선택할 수 있습니다. 사용자가 선택한 값에 따라 원본에서 대상에 대한 연결을 테스트합니다. 예를 들어 30초를 선택하면 원본은 30초 동안 한 번 이상 대상에 대한 연결을 확인합니다.
protocol - TCP, ICMP, HTTP 또는 HTTPS를 선택할 수 있습니다. 프로토콜에 따라 몇 가지 프로토콜 관련 구성을 수행할 수 있습니다
- preferHTTPS - 사용되는 포트가 80도 443도 아닌 경우 HTTP를 통해 HTTPS를 사용할지 여부를 지정합니다
- port - 선택한 대상 포트를 지정합니다.
- disableTraceRoute - 프로토콜이 TCP 또는 ICMP인 테스트 구성에 적용됩니다. 원본에서 토폴로지나 홉 단위 RTT를 검색하지 못하도록 합니다.
- method - 프로토콜이 HTTP인 테스트 구성에 적용됩니다. HTTP 요청 메서드(GET 또는 POST)를 선택합니다
- path - URL에 추가하기 위한 경로 매개 변수 지정
- validStatusCodes - 적용 가능한 상태 코드를 선택합니다. 응답 코드가 이 목록과 일치하지 않으면 진단 메시지가 표시됩니다
- requestHeaders - 대상에 전달될 사용자 지정 요청 헤더 문자열을 지정합니다
successThreshold - 다음 네트워크 매개 변수에 임계값을 설정할 수 있습니다.
- checksFailedPercent - 지정된 조건을 사용하여 원본이 대상에 대한 연결을 검사할 때 실패할 수 있는 검사 비율을 설정합니다. TCP 또는 ICMP 프로토콜의 경우 실패한 검사의 백분율은 패킷 손실의 백분율과 동일할 수 있습니다. HTTP 프로토콜의 경우 이 필드는 응답을 받지 않은 HTTP 요청의 비율을 나타냅니다.
- roundTripTimeMs - 테스트 구성을 통해 원본이 대상에 연결하는 데 걸리는 시간에 대한 RTT를 밀리초 단위로 설정합니다.
확장 한도
연결 모니터의 규모 한도는 다음과 같습니다.
- 지역별 구독당 최대 연결 모니터 수: 100개
- 연결 모니터당 최대 테스트 그룹 수: 20개
- 연결 모니터당 최대 원본 및 대상 수: 100개
- 연결 모니터당 최대 테스트 구성: ARMClient를 통해 20
다음 단계
- 모니터링 데이터를 분석하고 경고를 설정하는 방법을 알아봅니다
- 네트워크에서 문제를 진단하는 방법을 알아봅니다