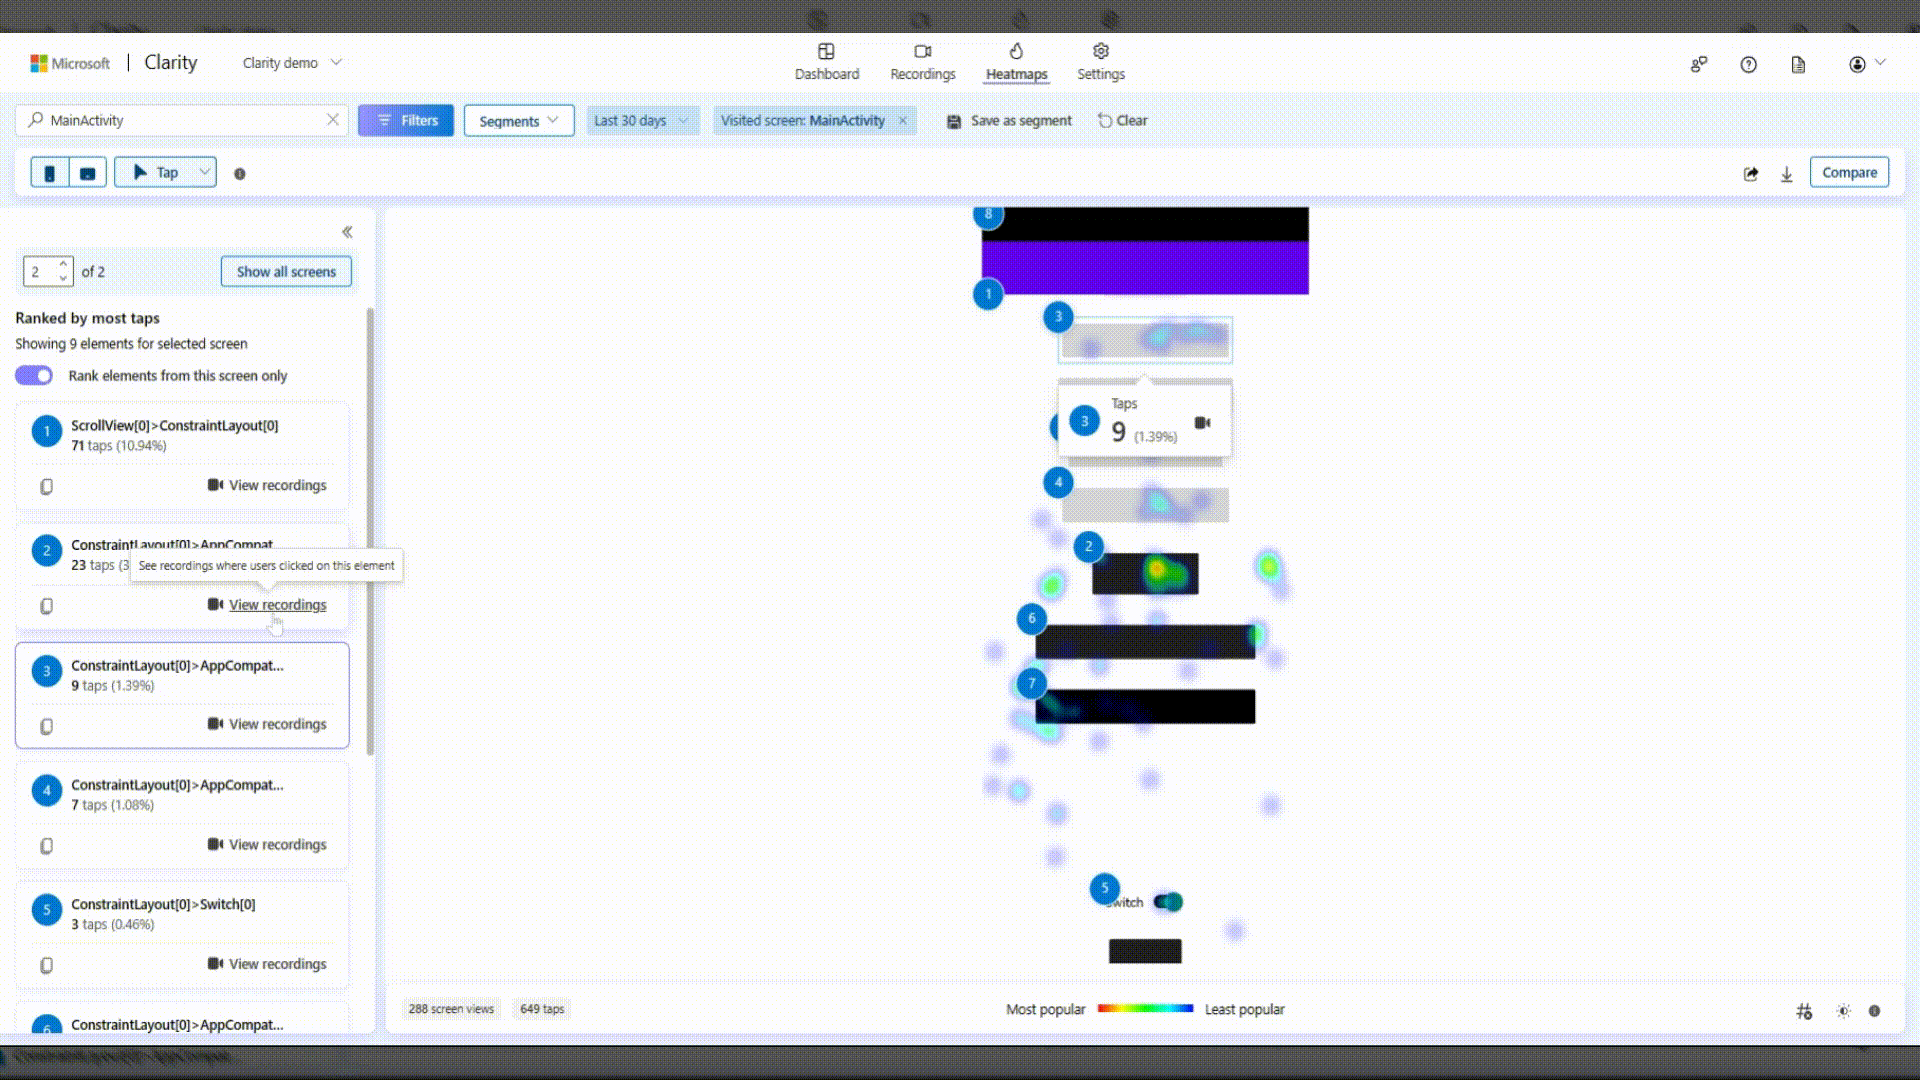
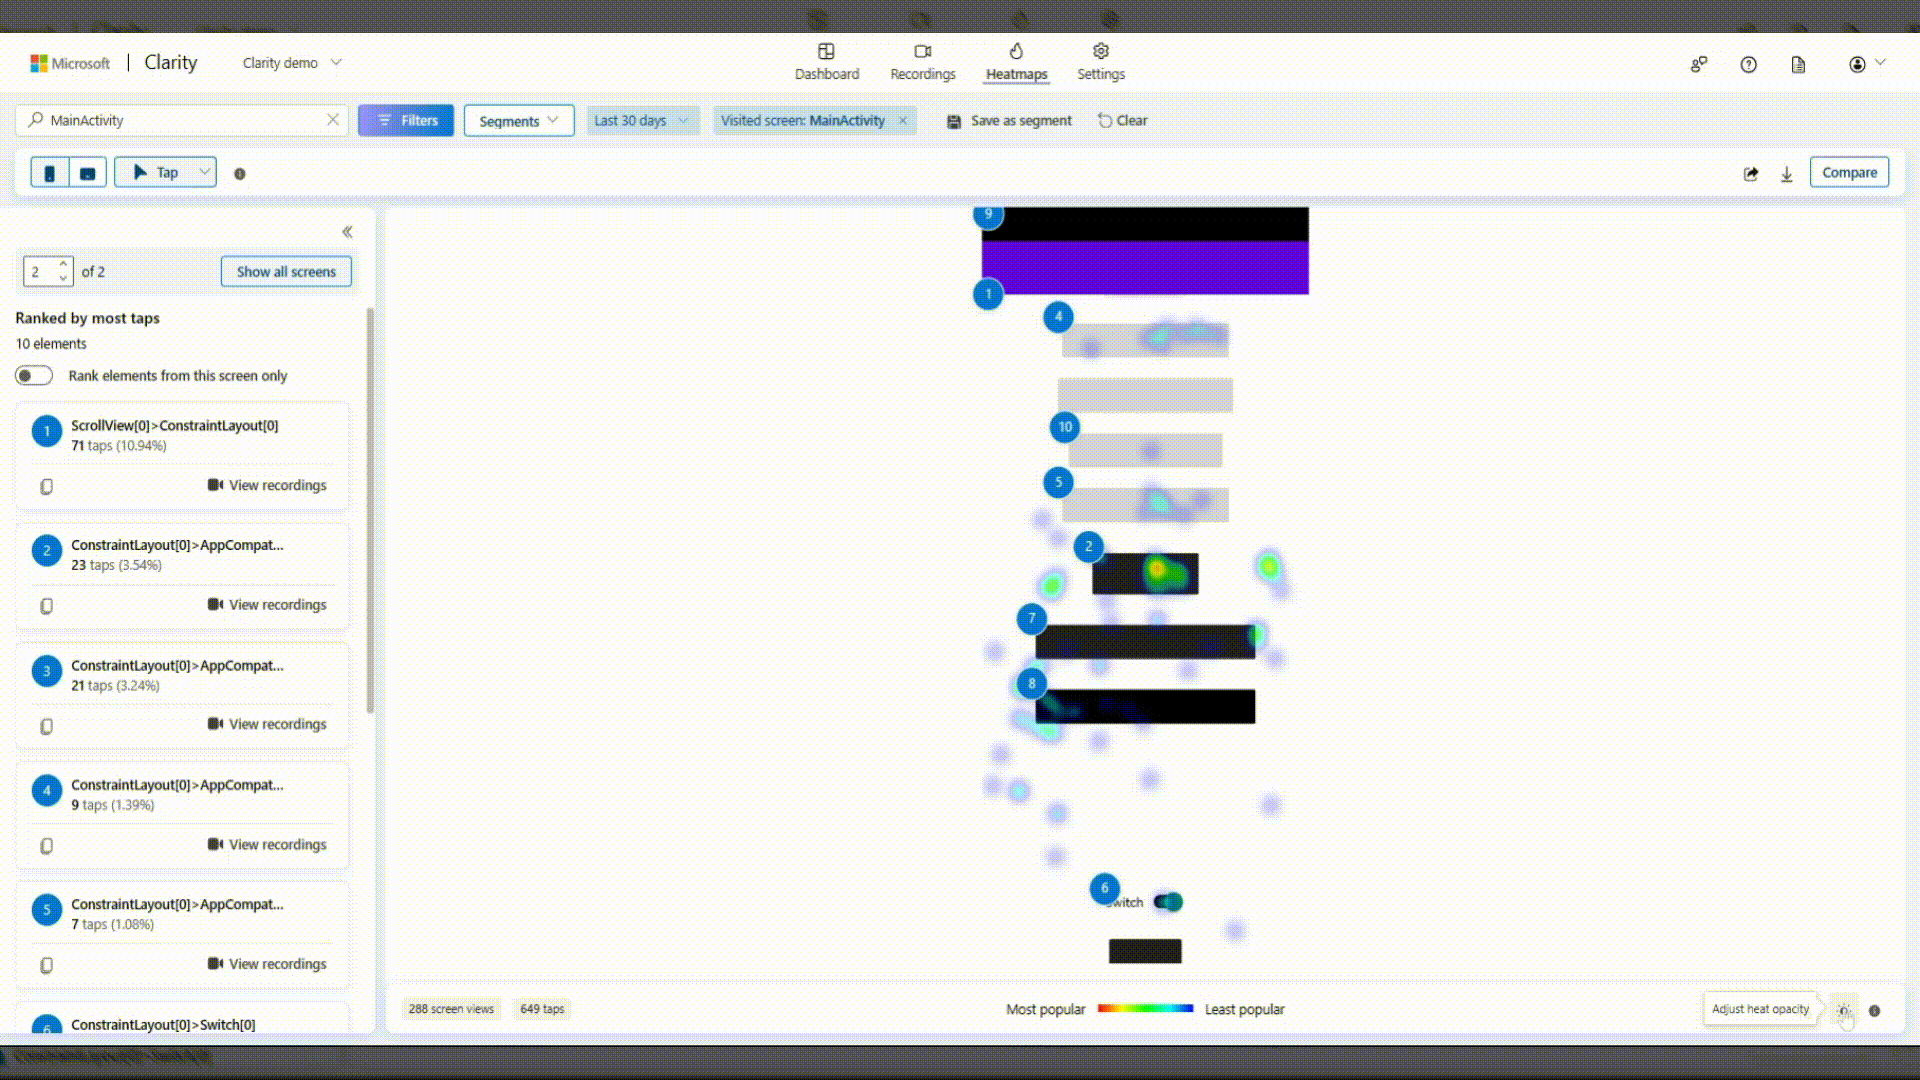
Taps map
Taps heatmaps shows where users are tapping on your app. It gives information about the most tapped elements and how many taps on these elements.
In the Taps Heatmaps, you can navigate between the different screens that the user saw during the sample session that is being displayed. The screens are displayed in order of appearance to the user. Use the Navigation box to move between the different screens and see the associated elements on each screen.
Different types of Taps map
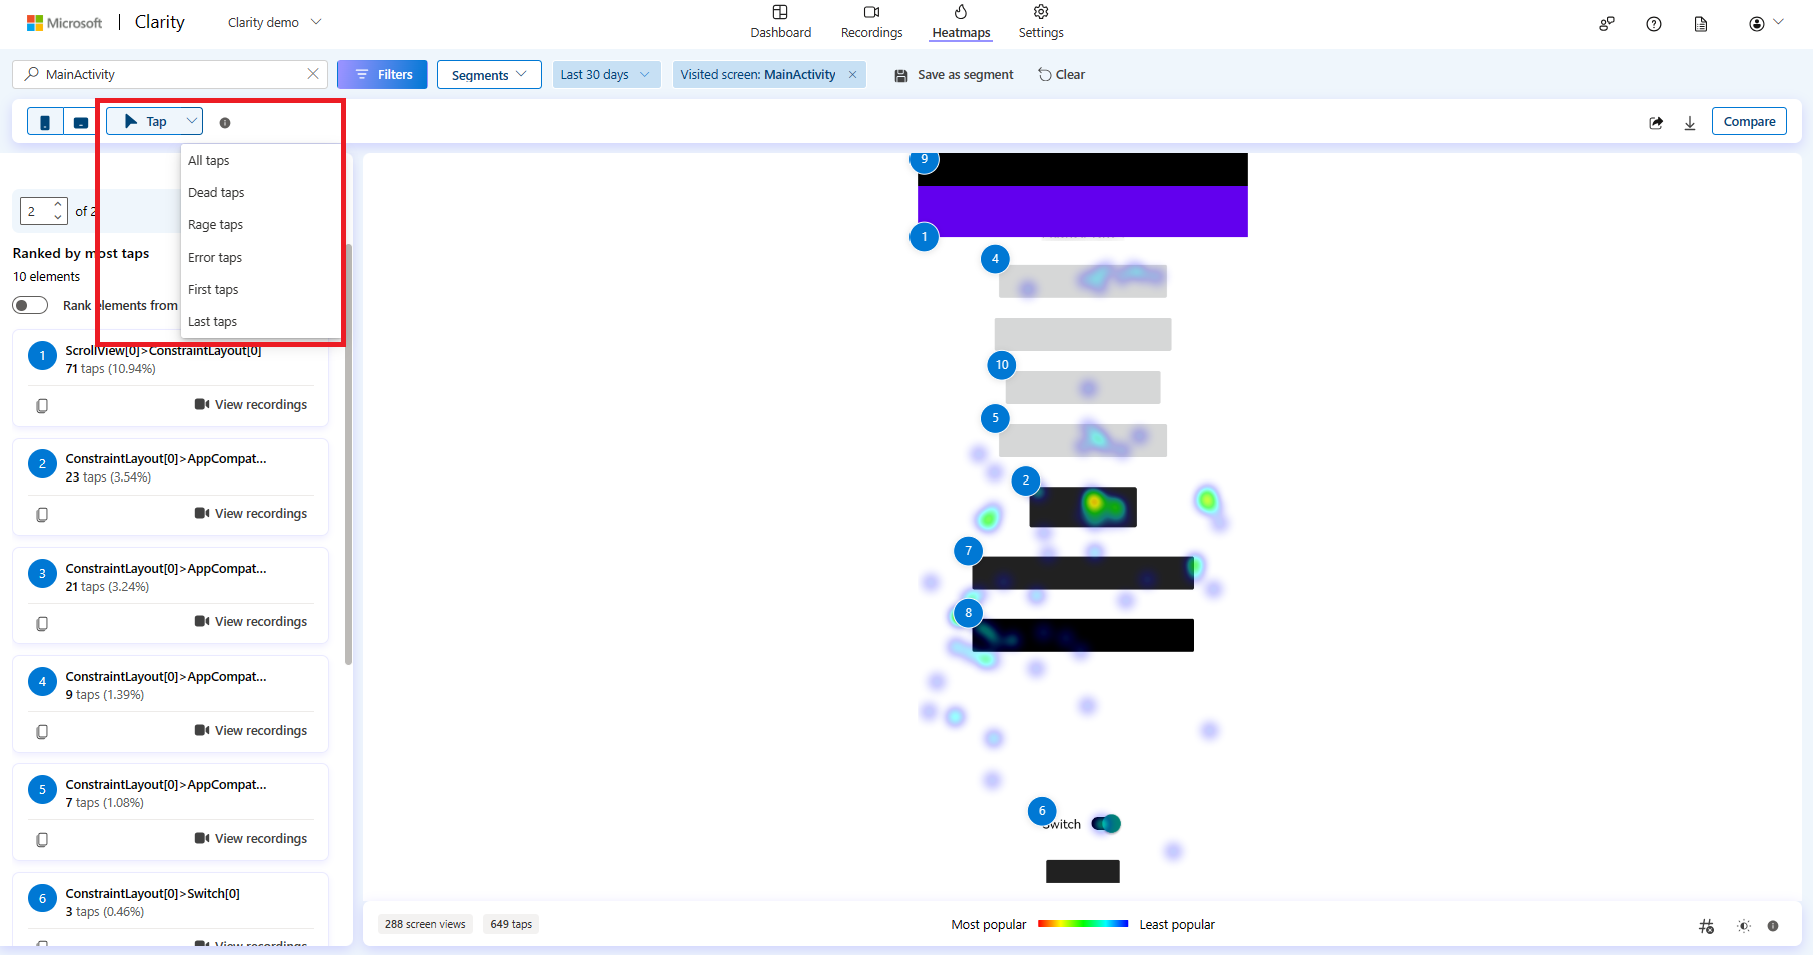
There are different types of Taps map:
All taps: shows all types of users taps on a screen, including dead taps, rage taps, error taps, first taps, and last taps.
Dead taps: show user taps on a screen with no effect/response. Learn more about Dead taps.
Rage taps: shows where users tapped rapidly in the same area within a brief period. Learn more about Rage taps.
Error taps: shows taps that occur on a screen that caused the JavaScript errors.
First taps: shows the aggregation of the first tap actions on the screen. These taps are useful to find out user onboarding patterns.
Last taps: shows the aggregation of the final tap actions on the screen. These taps are useful to find user flow patterns.
There are different components for the Taps heatmap for Clarity on Mobile apps:
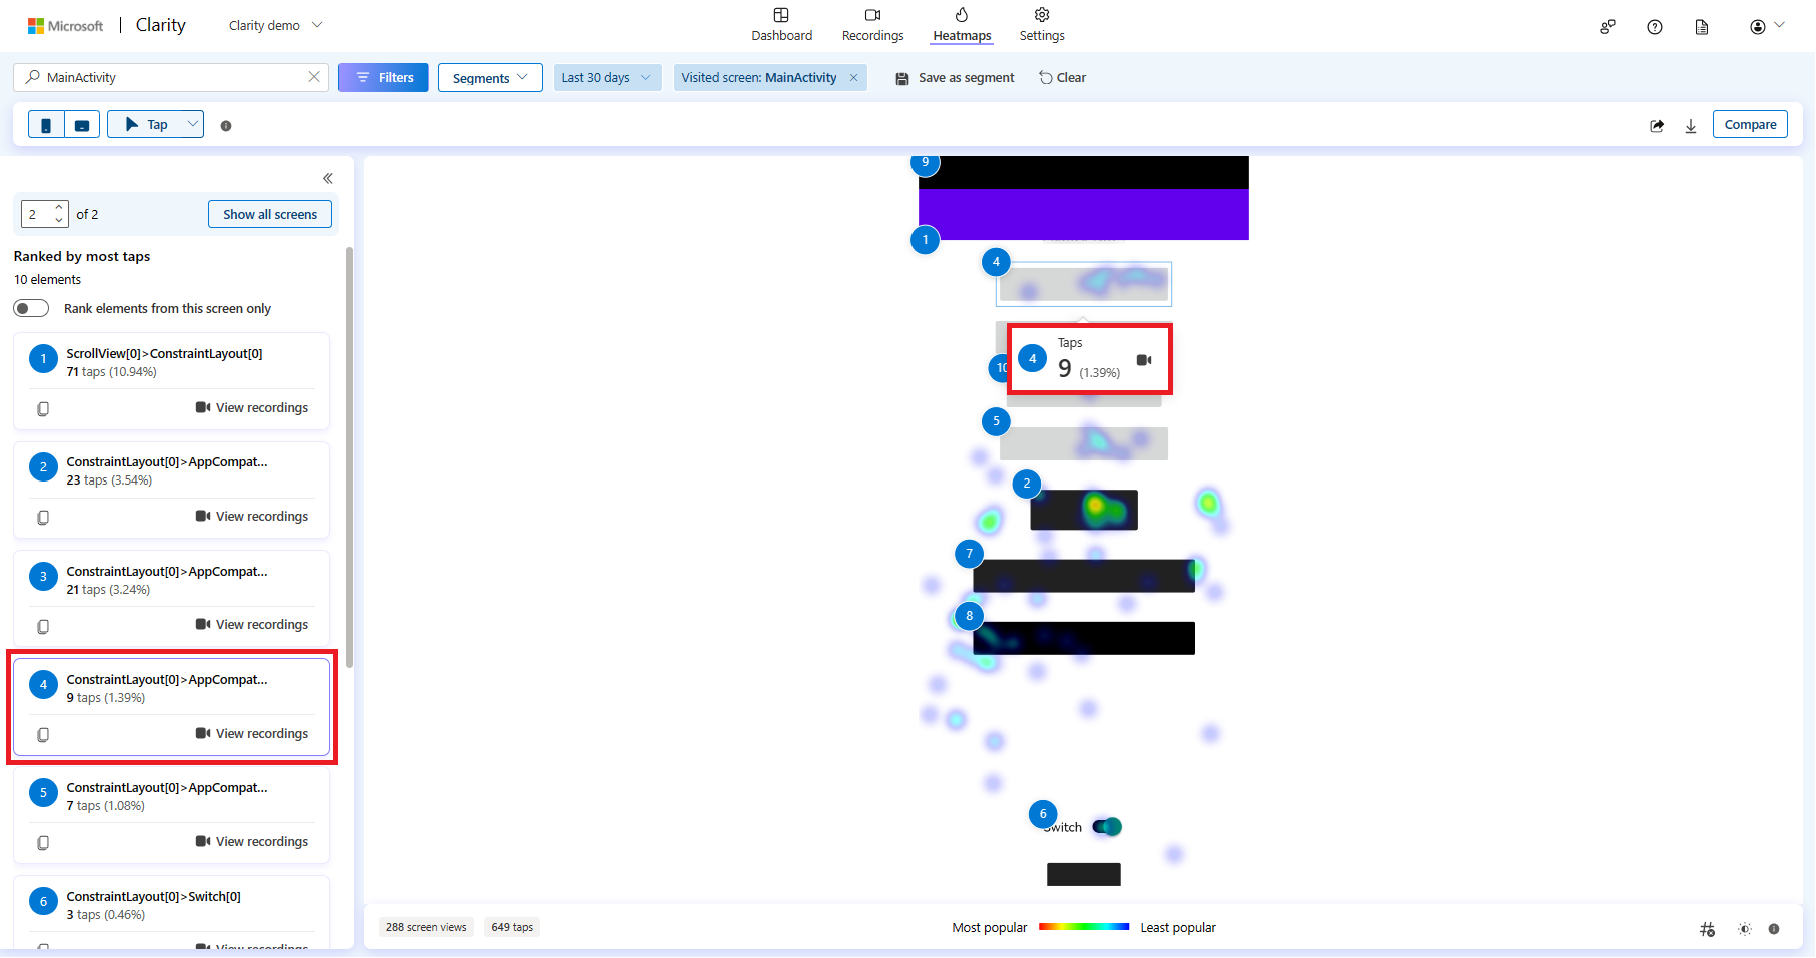
Left panel
The left panel contains all the elements/controls that have received any taps across all sessions with the applied filters. You can find that the elements name might differ slightly from what’s in the app’s code. Taps map displays these ranks elements with the most number of taps on the screen. As you change the taps maps types, the taps data is updated accordingly.
Taps data
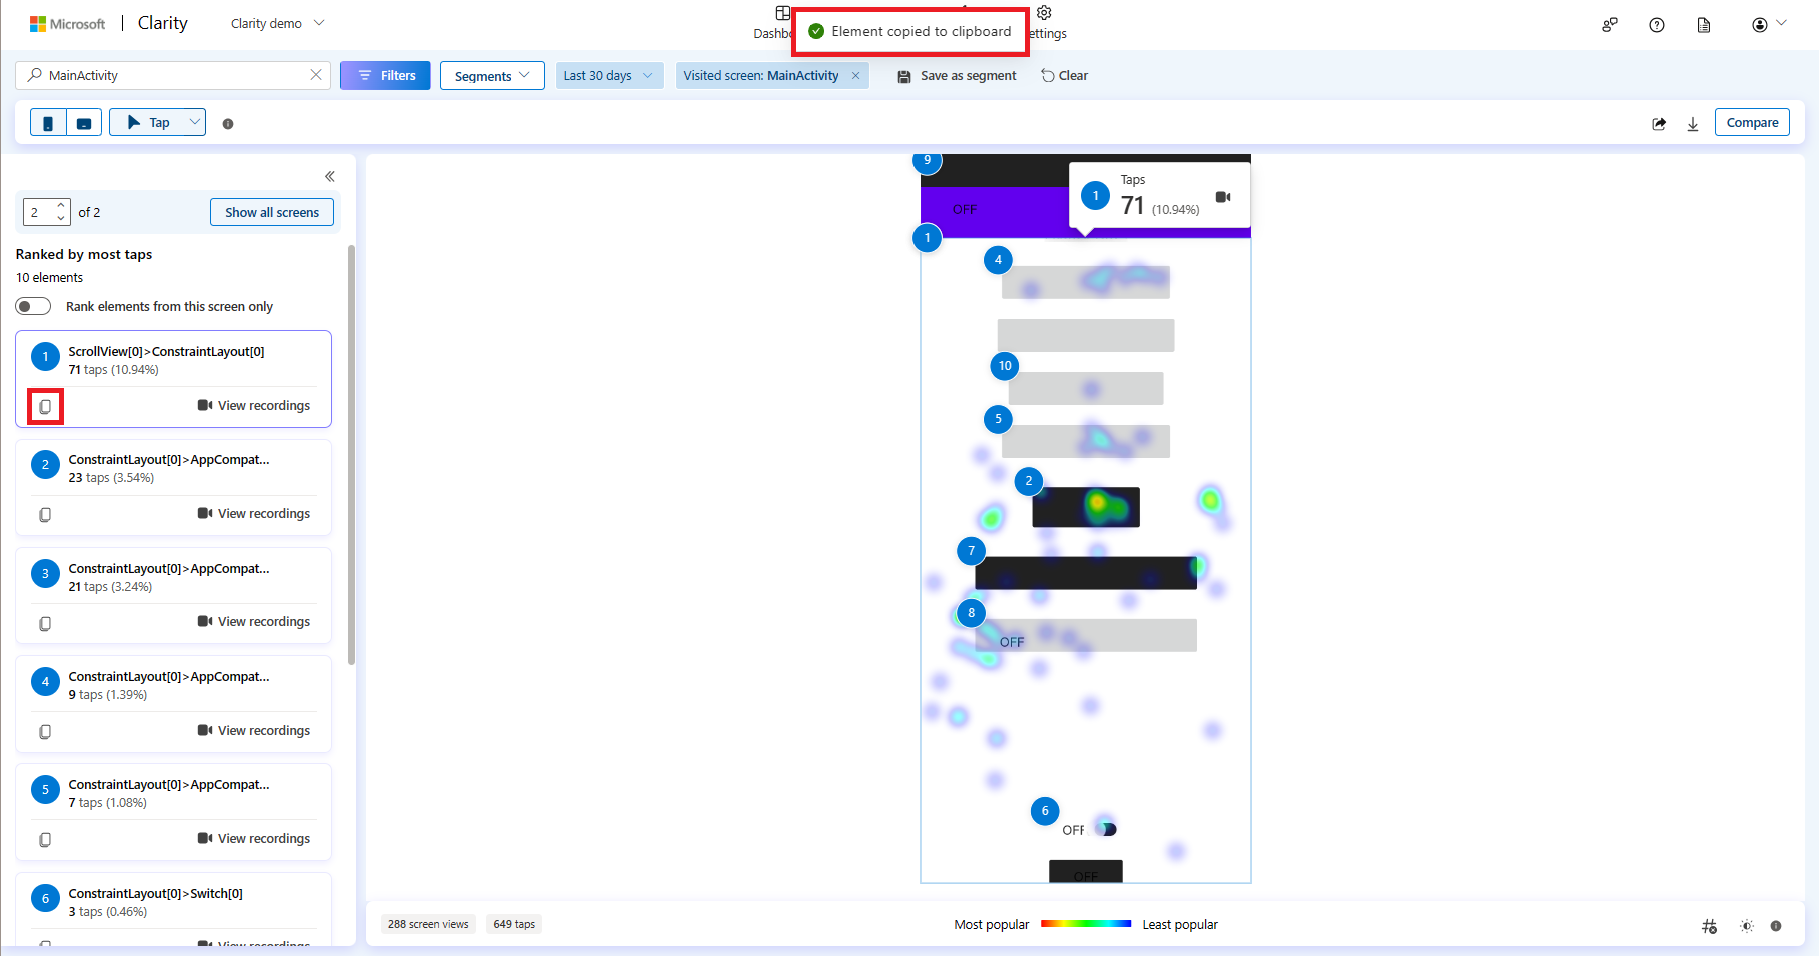
As you scroll to the bottom, you can view elements ranked further down the page. Select any element to view the number of taps (% of taps).
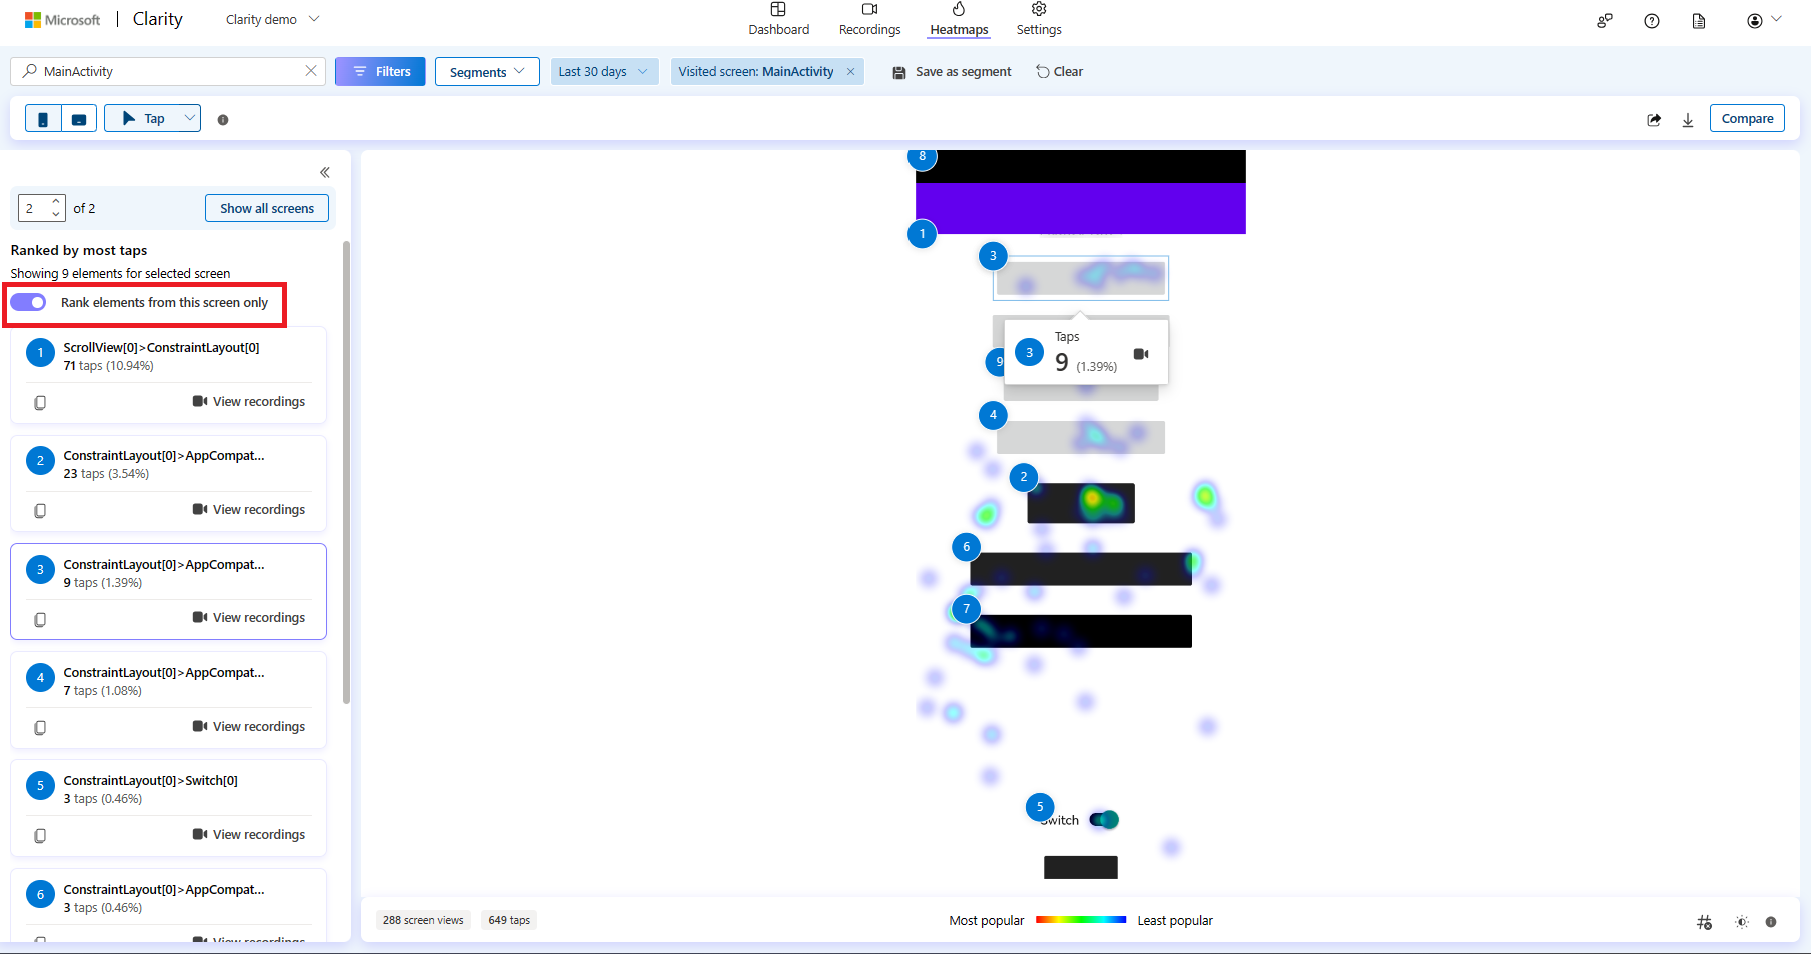
Elements toggle
Use the toggle to switch view between all elements across all sessions and just viewing the elements for the selected screen.
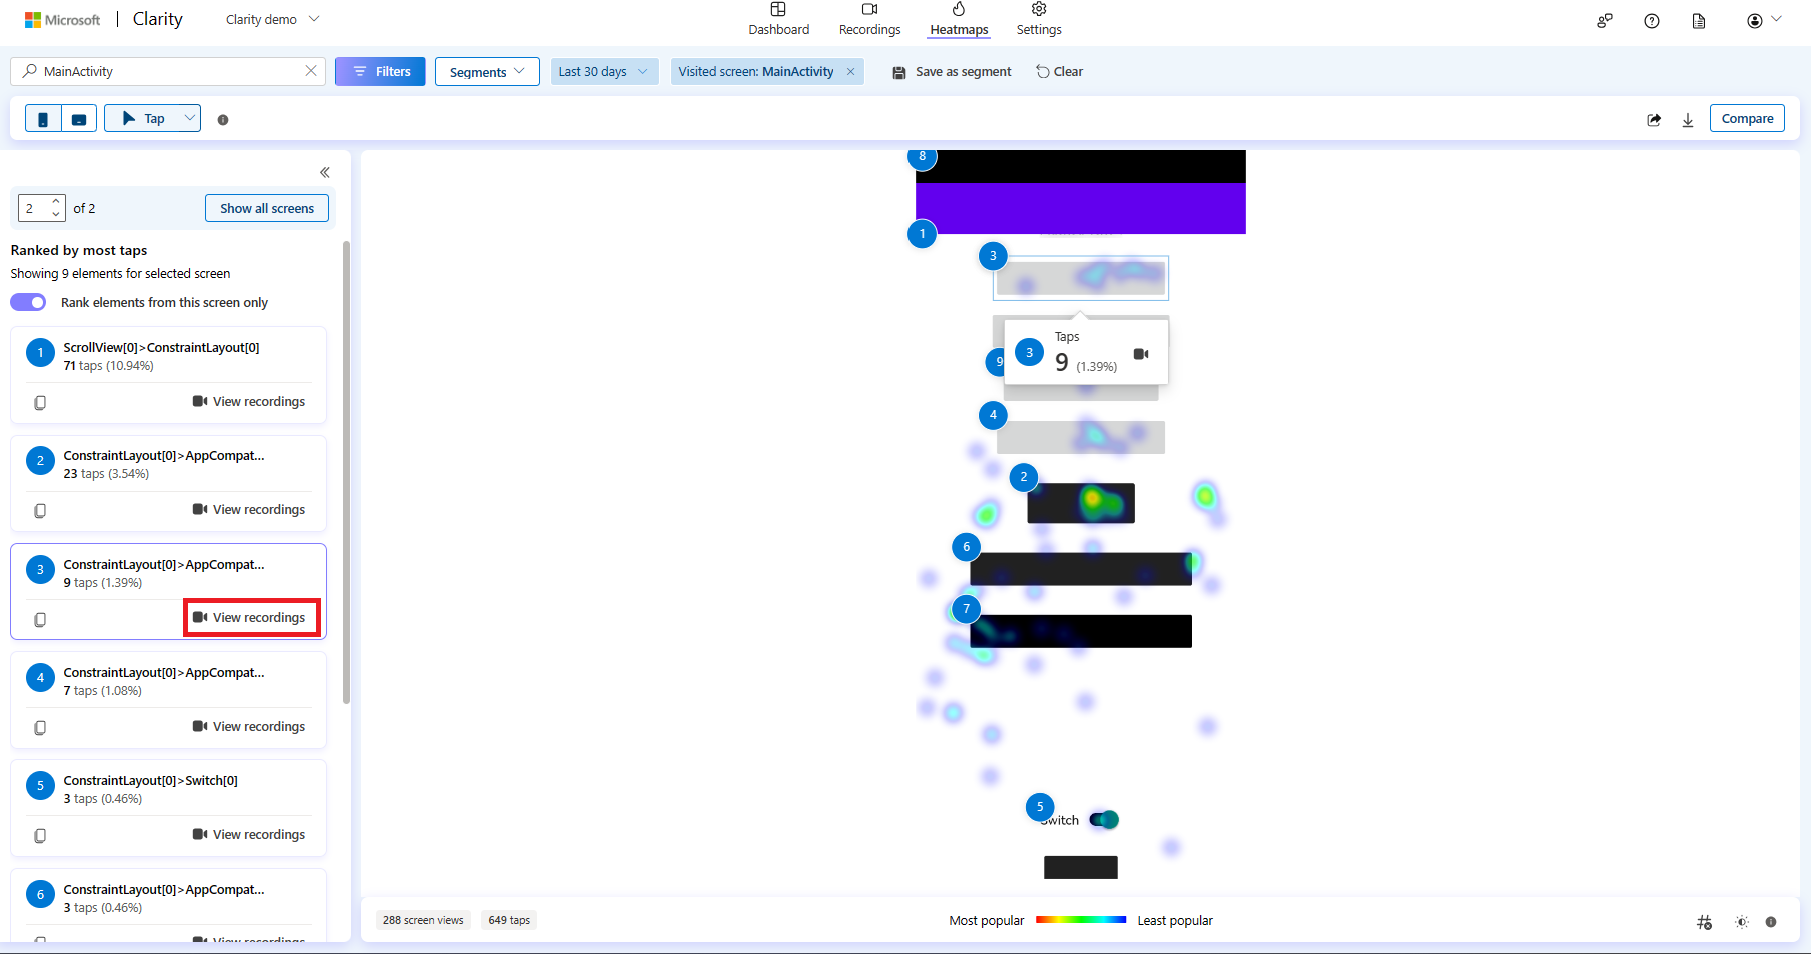
View recordings
You can also view the recordings either by selecting ![]() or by selecting View recordings. View recordings help you watch recordings where the element was tapped.
or by selecting View recordings. View recordings help you watch recordings where the element was tapped.
You can view a tapped element badge as an applied filter on selecting this button. Learn more about badge labels.
Note:
- Once applied, this filter appears on Recordings, Dashboard, and Heatmaps verticals.
- You can access it later by saving it as a segment or sharing it.
Badge label limitations:
- This filter can only be set through a heat map and can't be selected from filters.
- If you close the filter, you have to set it through Heatmaps again.
Copy Element
You can now copy the element to the clipboard by selecting the copy icon. This copies the CSS selector of an element that allows you to identify the exact element in the UI. You can use it to change the style of an element.
Top panel
The top panel helps you customize the Taps map visualization:
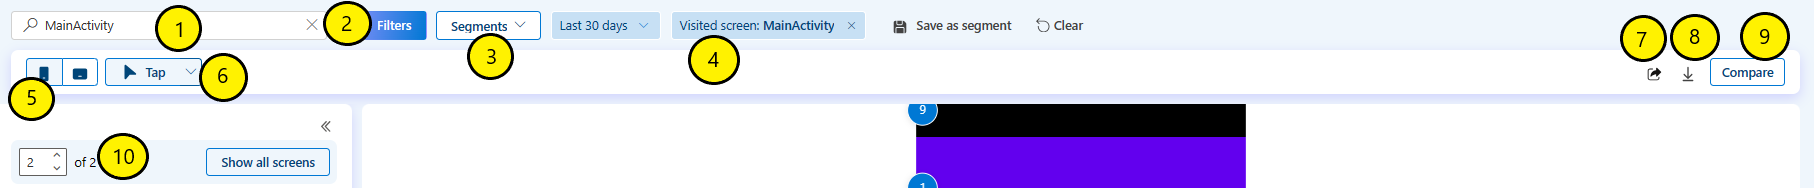
Screen: This autofill search bar contains all the screens that are part of Clarity's project.
Filters: Refer to the Filters to learn more.
Segments: Refer to Segments to learn more.
Visited screen: The screen for which you can view the Taps map. The applied filters appear here. You can also save the filters as a segment. Learn more here.
Supported devices: Choose Mobile/Tablet view to understand user behavior on these devices.
Taps map types: You can switch between different types of taps map.
Sharing: Share the taps map with others.
Download: Download the taps map as a CSV or PNG.
Compare: Compare two same or different taps maps.
Navigation Box: Use this box to switch between the different screens that have appeared in the user sessions. There can be any number of screens based on user activity.
Bottom panel

Screen views and taps: The total number of screen views and the total number of taps on a screen (or screens) for applied filters. The screen views are limited to up to 100,000 per tap map.
Color scale: Colors get warmer as the popularity of a section increases. The warmer the colors, the denser the taps.
Show heatmap ranks: Toggle to view heatmap ranks.
Opacity: This control helps change the transparency of heat when the heat covers up the text or images. You can use opacity to view the heat in red zones quickly.
FAQ
For more answers, refer to FAQ.