Microsoft Fabric Lakehouse is a data architecture platform for storing, managing, and analyzing structured and unstructured data in a single location.
In this tutorial you learn to:
- 레이크하우스에 CSV 파일 업로드
- Convert the file to a Delta table
- Generate a semantic model and create a Power BI report
레이크하우스 생성 및 CSV 파일 준비하기
Sign in to the Microsoft Fabric portal.
Make sure that you're in your desired workspace. Open your existing workspace or create a new one.
작업 영역에서 새 항목을 선택한 다음, Lakehouse을 선택합니다.
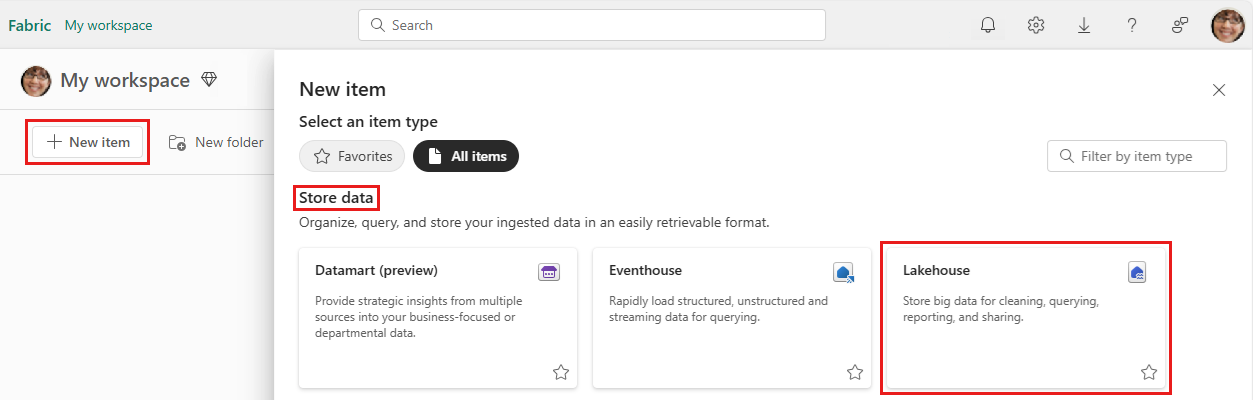
레이크하우스의 이름을 입력합니다.
Select Create.
Download the "Taxi Zone Lookup Table" CSV file from the TLC Trip Record Data website, and save to a location in your computer.

레이크하우스에 CSV 파일 업로드
Create the
TaxiDatafolder under theFilessection of your lakehouse.Upload the file to the folder, by using the Upload file item in the folder contextual menu.
Once uploaded, select the folder to see its content.
Rename the file to remove special characters, in this example, remove the '+' character. To see the full list of special characters, read the Load to Delta Lake tables article.

Load the file to a Delta table
Right-click or use the ellipsis on the CSV file to access the contextual menu. Select Load to Tables and choose the New table option.
The load to tables user interface shows up with the suggested table name. Real time validations on special characters apply during typing.
Select Load to execute the load.
The table now shows up in the lakehouse explorer, expand the table to see the columns and its types. Select the table to see a preview.

Note
If the table already exists, different load mode options are shown. Overwrite will drop and recreate the table. Append will insert all CSV content as new data. For an in-depth guide on the Load to Tables feature, read the Load to Tables article.
Generate a semantic model and create a Power BI report
Select New Power BI semantic model on the Lakehouse ribbon.
Select the table to be added to the semantic model, select the Confirm button.
With semantic model editing, you are able to define relationships between multiple tables, and also apply data types normalization and DAX transformations to the data if desired.
Select New report on the ribbon.
Use the report builder to design a Power BI report.