자습서: 권장 사항 시스템 만들기, 평가 및 점수 매기기
이 자습서에서는 Microsoft Fabric에서 Synapse 데이터 과학 워크플로의 엔드 투 엔드 예제를 제공합니다. 이 시나리오는 온라인 책 권장 사항에 대한 모델을 빌드합니다.
이 자습서에서는 다음 단계를 설명합니다.
- 레이크하우스에 데이터 업로드
- 데이터에 대한 예비 분석 수행
- MLflow를 사용하여 모델 학습 및 로그
- 모델 로드 및 예측
다양한 유형의 권장 사항 알고리즘을 사용할 수 있습니다. 이 자습서에서는 ALS(대체 최소 제곱) 행렬 팩터리화 알고리즘을 사용합니다. ALS는 모델 기반 공동 작업 필터링 알고리즘입니다.

ALS는 등급 매트릭스 R을 사용자와 V의 하위 등급 매트릭스 2개의 곱으로 추정하려고 합니다. 여기, R = U * Vt. 일반적으로 이러한 근사값을 인자 행렬이라고 합니다.
ALS 알고리즘은 반복적입니다. 각 반복은 요소 매트릭스 상수 중 하나를 보유하지만, 최소 제곱의 메서드를 사용하여 다른 연산을 해결합니다. 그런 다음 새로 해결된 인자 행렬 상수가 다른 인자 행렬을 해결하는 동안 유지됩니다.

필수 조건
Microsoft Fabric 구독을 구매합니다. 또는 무료 Microsoft Fabric 평가판에 등록합니다.
Microsoft Fabric에 로그인합니다.
홈페이지 왼쪽의 환경 전환기를 사용하여 Synapse 데이터 과학 환경으로 전환합니다.
- 필요한 경우 Microsoft Fabric에서 레이크하우스 만들기에 설명된 대로 Microsoft Fabric 레이크하우스를 만듭니다.
전자 필기장에서 팔로우
다음 옵션 중 하나를 선택하여 전자 필기장에서 따를 수 있습니다.
- Synapse 데이터 과학 환경에서 기본 제공 Notebook 열기 및 실행
- GitHub에서 Synapse 데이터 과학 환경으로 Notebook 업로드
기본 제공 Notebook 열기
샘플 Book 권장 사항 전자 필기장이 이 자습서와 함께 제공됩니다.
Synapse 데이터 과학 환경에서 자습서의 기본 제공 샘플 Notebook을 열려면 다음을 수행합니다.
Synapse 데이터 과학 홈페이지로 이동합니다.
샘플 사용을 선택합니다.
해당 샘플을 선택합니다.
- 기본 Python(엔드 투 엔드 워크플로) 탭에서 샘플이 Python 자습서용인 경우
- R(엔드 투 엔드 워크플로) 탭에서 샘플이 R 자습서용인 경우
- 빠른 자습서 탭에서 샘플이 빠른 자습서용인 경우
코드 실행을 시작하기 전에 Lakehouse를 Notebook 에 연결합니다.
GitHub에서 Notebook 가져오기
AIsample - Book Recommendation.ipynb Notebook은 이 자습서와 함께 제공됩니다.
이 자습서에 대해 함께 제공되는 Notebook을 열려면 데이터 과학 자습서를 위해 시스템 준비 자습서의 지침에 따라 Notebook을 작업 영역으로 가져옵니다.
이 페이지에서 코드를 복사하여 붙여 넣으면 새 Notebook을 만들 수 있습니다.
코드 실행을 시작하기 전에 Lakehouse를 Notebook에 연결해야 합니다.
1단계: 데이터 로드
이 시나리오의 책 권장 사항 데이터 세트는 세 개의 개별 데이터 세트로 구성됩니다.
Books.csv: ISBN(International Standard Book Number)은 잘못된 날짜가 이미 제거된 각 책을 식별합니다. 데이터 세트에는 제목, 작성자 및 게시자도 포함됩니다. 여러 저자 가 있는 책의 경우 Books.csv 파일에는 첫 번째 저자만 나열됩니다. URL은 표지 이미지에 대한 Amazon 웹 사이트 리소스를 세 가지 크기로 가리킵니다.
Isbn 책 제목 책 작성자 게시 연도 게시자 Image-URL-S Image-URL-M Image-URL-l 0195153448 고전 신화 마크 P. O. 모포드 2002 옥스포드 대학 출판부 http://images.amazon.com/images/P/0195153448.01.THUMBZZZ.jpg http://images.amazon.com/images/P/0195153448.01.MZZZZZZZ.jpg http://images.amazon.com/images/P/0195153448.01.LZZZZZZZ.jpg 0002005018 클라라 캘런 리처드 브루스 라이트 2001 HarperFlamingo Canada http://images.amazon.com/images/P/0002005018.01.THUMBZZZ.jpg http://images.amazon.com/images/P/0002005018.01.MZZZZZZZ.jpg http://images.amazon.com/images/P/0002005018.01.LZZZZZZZ.jpg Ratings.csv: 각 책의 등급은 명시적이거나(사용자가 1에서 10까지) 암시적(사용자 입력 없이 관찰되고 0으로 표시됨)입니다.
사용자 ID Isbn 도서 등급 276725 034545104X 0 276726 0155061224 5 Users.csv: 사용자 ID는 익명화되고 정수에 매핑됩니다. 사용 가능한 경우 위치 및 연령과 같은 인구 통계 데이터가 제공됩니다. 이 데이터를 사용할 수 없는 경우 이러한 값은 다음과 같습니다
null.사용자 ID 위치 나이 1 "뉴욕 뉴욕 미국" 2 "스톡턴 캘리포니아 미국" 18.0
다른 데이터 세트로 이 Notebook을 사용할 수 있도록 이러한 매개 변수를 정의합니다.
IS_CUSTOM_DATA = False  # If True, the dataset has to be uploaded manually

USER_ID_COL = "User-ID"  # Must not be '_user_id' for this notebook to run successfully
ITEM_ID_COL = "ISBN"  # Must not be '_item_id' for this notebook to run successfully
ITEM_INFO_COL = (
    "Book-Title"  # Must not be '_item_info' for this notebook to run successfully
)
RATING_COL = (
    "Book-Rating"  # Must not be '_rating' for this notebook to run successfully
)
IS_SAMPLE = True  # If True, use only <SAMPLE_ROWS> rows of data for training; otherwise, use all data
SAMPLE_ROWS = 5000  # If IS_SAMPLE is True, use only this number of rows for training

DATA_FOLDER = "Files/book-recommendation/"  # Folder that contains the datasets
ITEMS_FILE = "Books.csv"  # File that contains the item information
USERS_FILE = "Users.csv"  # File that contains the user information
RATINGS_FILE = "Ratings.csv"  # File that contains the rating information

EXPERIMENT_NAME = "aisample-recommendation"  # MLflow experiment name
레이크하우스에 데이터 다운로드 및 저장
이 코드는 데이터 세트를 다운로드한 다음 Lakehouse에 저장합니다.
Important
레이크하우스를 실행하기 전에 Notebook에 추가해야 합니다. 그렇지 않으면 오류가 발생합니다.
if not IS_CUSTOM_DATA:
    # Download data files into a lakehouse if they don't exist
    import os, requests

    remote_url = "https://synapseaisolutionsa.blob.core.windows.net/public/Book-Recommendation-Dataset"
    file_list = ["Books.csv", "Ratings.csv", "Users.csv"]
    download_path = f"/lakehouse/default/{DATA_FOLDER}/raw"

    if not os.path.exists("/lakehouse/default"):
        raise FileNotFoundError(
            "Default lakehouse not found, please add a lakehouse and restart the session."
        )
    os.makedirs(download_path, exist_ok=True)
    for fname in file_list:
        if not os.path.exists(f"{download_path}/{fname}"):
            r = requests.get(f"{remote_url}/{fname}", timeout=30)
            with open(f"{download_path}/{fname}", "wb") as f:
                f.write(r.content)
    print("Downloaded demo data files into lakehouse.")
MLflow 실험 추적 설정
이 코드를 사용하여 MLflow 실험 추적을 설정합니다. 다음은 자동 로깅을 사용하지 않도록 설정하는 예제입니다. 자세한 내용은 Microsoft Fabric의 자동 로깅 문서를 참조하세요.
# Set up MLflow for experiment tracking
import mlflow

mlflow.set_experiment(EXPERIMENT_NAME)
mlflow.autolog(disable=True)  # Disable MLflow autologging
레이크하우스에서 데이터 읽기
레이크하우스에 올바른 데이터를 배치한 후 Notebook에서 세 개의 데이터 세트를 별도의 Spark DataFrames로 읽습니다. 이 코드의 파일 경로는 이전에 정의된 매개 변수를 사용합니다.
df_items = (
    spark.read.option("header", True)
    .option("inferSchema", True)
    .csv(f"{DATA_FOLDER}/raw/{ITEMS_FILE}")
    .cache()
)

df_ratings = (
    spark.read.option("header", True)
    .option("inferSchema", True)
    .csv(f"{DATA_FOLDER}/raw/{RATINGS_FILE}")
    .cache()
)

df_users = (
    spark.read.option("header", True)
    .option("inferSchema", True)
    .csv(f"{DATA_FOLDER}/raw/{USERS_FILE}")
    .cache()
)
2단계: 예비 데이터 분석 수행
원시 데이터 표시
명령을 사용하여 DataFrames를 탐색합니다 display . 이 명령을 사용하면 개략적인 DataFrame 통계를 보고 서로 다른 데이터 세트 열이 서로 어떻게 관련되는지 이해할 수 있습니다. 데이터 세트를 탐색하기 전에 다음 코드를 사용하여 필요한 라이브러리를 가져옵니다.
import pyspark.sql.functions as F
from pyspark.ml.feature import StringIndexer
import matplotlib.pyplot as plt
import seaborn as sns
color = sns.color_palette()  # Adjusting plotting style
import pandas as pd  # DataFrames
이 코드를 사용하여 책 데이터가 포함된 DataFrame을 확인합니다.
display(df_items, summary=True)
_item_id 나중에 사용할 열을 추가합니다. 값은 _item_id 권장 사항 모델의 정수여야 합니다. 이 코드는 인덱스로 변환 ITEM_ID_COL 하는 데 사용합니다StringIndexer.
df_items = (
    StringIndexer(inputCol=ITEM_ID_COL, outputCol="_item_id")
    .setHandleInvalid("skip")
    .fit(df_items)
    .transform(df_items)
    .withColumn("_item_id", F.col("_item_id").cast("int"))
)
DataFrame을 표시하고 예상대로 값이 _item_id 단조롭고 연속적으로 증가하는지 여부를 검사.
display(df_items.sort(F.col("_item_id").desc()))
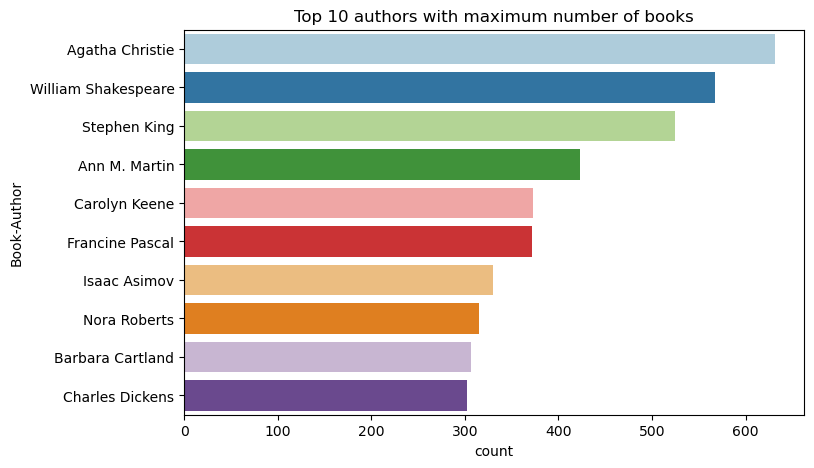
이 코드를 사용하여 상위 10명의 저자를 내림차순으로 기록된 책 수별로 그리는 데 사용합니다. 아가사 크리스티는 윌리엄 셰익스피어에 이어 600권 이상의 책을 집필한 최고의 작가입니다.
df_books = df_items.toPandas() # Create a pandas DataFrame from the Spark DataFrame for visualization
plt.figure(figsize=(8,5))
sns.countplot(y="Book-Author",palette = 'Paired', data=df_books,order=df_books['Book-Author'].value_counts().index[0:10])
plt.title("Top 10 authors with maximum number of books")
다음으로, 사용자 데이터가 포함된 DataFrame을 표시합니다.
display(df_users, summary=True)
행에 누락된 User-ID 값이 있으면 해당 행을 삭제합니다. 사용자 지정된 데이터 세트의 값이 누락되어도 문제가 발생하지 않습니다.
df_users = df_users.dropna(subset=(USER_ID_COL))
display(df_users, summary=True)
_user_id 나중에 사용할 열을 추가합니다. 권장 사항 모델의 경우 값은 _user_id 정수여야 합니다. 다음 코드 샘플에서는 인덱스로 변환 USER_ID_COL 하는 데 사용합니다StringIndexer.
책 데이터 세트에 정수 열이 User-ID 이미 있습니다. 그러나 다른 데이터 세트와의 호환성을 위해 열을 추가 _user_id 하면 이 예제가 더 강력해집니다. 이 코드를 사용하여 열을 추가합니다._user_id
df_users = (
    StringIndexer(inputCol=USER_ID_COL, outputCol="_user_id")
    .setHandleInvalid("skip")
    .fit(df_users)
    .transform(df_users)
    .withColumn("_user_id", F.col("_user_id").cast("int"))
)
display(df_users.sort(F.col("_user_id").desc()))
등급 데이터를 보려면 다음 코드를 사용합니다.
display(df_ratings, summary=True)
별개의 등급을 가져오고 나중에 사용할 수 있도록 다음 목록에 ratings저장합니다.
ratings = [i[0] for i in df_ratings.select(RATING_COL).distinct().collect()]
print(ratings)
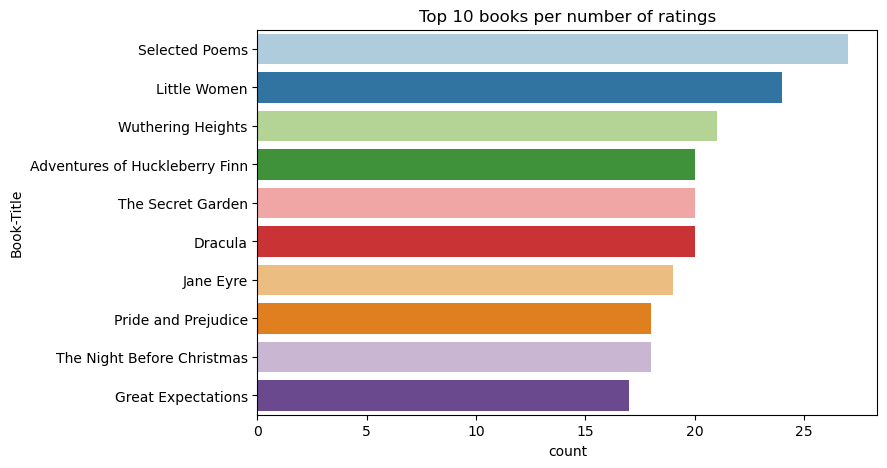
이 코드를 사용하여 가장 높은 평점을 가진 상위 10권의 책을 표시합니다.
plt.figure(figsize=(8,5))
sns.countplot(y="Book-Title",palette = 'Paired',data= df_books, order=df_books['Book-Title'].value_counts().index[0:10])
plt.title("Top 10 books per number of ratings")
등급에 따르면, 선택한 시는 가장 인기있는 책입니다. 허클베리 핀, 시크릿 가든, 드라큘라의 모험도 같은 평가를 받고 있습니다.
데이터 병합
보다 포괄적인 분석을 위해 세 개의 DataFrame을 하나의 DataFrame에 병합합니다.
df_all = df_ratings.join(df_users, USER_ID_COL, "inner").join(
    df_items, ITEM_ID_COL, "inner"
)
df_all_columns = [
    c for c in df_all.columns if c not in ["_user_id", "_item_id", RATING_COL]
]

# Reorder the columns to ensure that _user_id, _item_id, and Book-Rating are the first three columns
df_all = (
    df_all.select(["_user_id", "_item_id", RATING_COL] + df_all_columns)
    .withColumn("id", F.monotonically_increasing_id())
    .cache()
)

display(df_all)
이 코드를 사용하여 고유 사용자, 책 및 상호 작용의 수를 표시합니다.
print(f"Total Users: {df_users.select('_user_id').distinct().count()}")
print(f"Total Items: {df_items.select('_item_id').distinct().count()}")
print(f"Total User-Item Interactions: {df_all.count()}")
가장 인기 있는 항목 계산 및 그리기
다음 코드를 사용하여 가장 인기 있는 상위 10개 책을 계산하고 표시합니다.
# Compute top popular products
df_top_items = (
    df_all.groupby(["_item_id"])
    .count()
    .join(df_items, "_item_id", "inner")
    .sort(["count"], ascending=[0])
)

# Find top <topn> popular items
topn = 10
pd_top_items = df_top_items.limit(topn).toPandas()
pd_top_items.head(10)
팁
<topn> 인기 또는 상위 구매 권장 사항 섹션의 값을 사용합니다.
# Plot top <topn> items
f, ax = plt.subplots(figsize=(10, 5))
plt.xticks(rotation="vertical")
sns.barplot(y=ITEM_INFO_COL, x="count", data=pd_top_items)
ax.tick_params(axis='x', rotation=45)
plt.xlabel("Number of Ratings for the Item")
plt.show()

학습 및 테스트 데이터 세트 준비
ALS 매트릭스에는 학습 전에 몇 가지 데이터 준비가 필요합니다. 이 코드 샘플을 사용하여 데이터를 준비합니다. 코드는 다음 작업을 수행합니다.
- 등급 열을 올바른 형식으로 캐스팅
- 사용자 등급을 사용하여 학습 데이터 샘플
- 데이터를 학습 및 테스트 데이터 세트로 분할
if IS_SAMPLE:
    # Must sort by '_user_id' before performing limit to ensure that ALS works normally
    # If training and test datasets have no common _user_id, ALS will fail
    df_all = df_all.sort("_user_id").limit(SAMPLE_ROWS)

# Cast the column into the correct type
df_all = df_all.withColumn(RATING_COL, F.col(RATING_COL).cast("float"))

# Using a fraction between 0 and 1 returns the approximate size of the dataset; for example, 0.8 means 80% of the dataset
# Rating = 0 means the user didn't rate the item, so it can't be used for training
# We use the 80% of the dataset with rating > 0 as the training dataset
fractions_train = {0: 0}
fractions_test = {0: 0}
for i in ratings:
    if i == 0:
        continue
    fractions_train[i] = 0.8
    fractions_test[i] = 1
# Training dataset
train = df_all.sampleBy(RATING_COL, fractions=fractions_train)

# Join with leftanti will select all rows from df_all with rating > 0 and not in the training dataset; for example, the remaining 20% of the dataset
# test dataset
test = df_all.join(train, on="id", how="leftanti").sampleBy(
    RATING_COL, fractions=fractions_test
)
스파스는 사용자의 관심사에서 유사성을 식별할 수 없는 스파스 피드백 데이터를 나타냅니다. 데이터와 현재 문제를 더 잘 이해하려면 이 코드를 사용하여 데이터 세트 스파스를 계산합니다.
# Compute the sparsity of the dataset
def get_mat_sparsity(ratings):
    # Count the total number of ratings in the dataset - used as numerator
    count_nonzero = ratings.select(RATING_COL).count()
    print(f"Number of rows: {count_nonzero}")

    # Count the total number of distinct user_id and distinct product_id - used as denominator
    total_elements = (
        ratings.select("_user_id").distinct().count()
        * ratings.select("_item_id").distinct().count()
    )

    # Calculate the sparsity by dividing the numerator by the denominator
    sparsity = (1.0 - (count_nonzero * 1.0) / total_elements) * 100
    print("The ratings DataFrame is ", "%.4f" % sparsity + "% sparse.")

get_mat_sparsity(df_all)
# Check the ID range
# ALS supports only values in the integer range
print(f"max user_id: {df_all.agg({'_user_id': 'max'}).collect()[0][0]}")
print(f"max user_id: {df_all.agg({'_item_id': 'max'}).collect()[0][0]}")
3단계: 모델 개발 및 학습
ALS 모델을 학습하여 사용자에게 개인 설정된 권장 사항을 제공합니다.
모델 정의
Spark ML은 ALS 모델을 빌드하기 위한 편리한 API를 제공합니다. 그러나 모델은 데이터 스파스 및 콜드 스타트(사용자 또는 항목이 새로운 경우 권장 사항 만들기)와 같은 문제를 안정적으로 처리하지 않습니다. 모델 성능을 향상시키려면 교차 유효성 검사와 자동 하이퍼 매개 변수 튜닝을 결합합니다.
모델 학습 및 평가에 필요한 라이브러리를 가져오려면 다음 코드를 사용합니다.
# Import Spark required libraries
from pyspark.ml.evaluation import RegressionEvaluator
from pyspark.ml.recommendation import ALS
from pyspark.ml.tuning import ParamGridBuilder, CrossValidator, TrainValidationSplit

# Specify the training parameters
num_epochs = 1  # Number of epochs; here we use 1 to reduce the training time
rank_size_list = [64]  # The values of rank in ALS for tuning
reg_param_list = [0.01, 0.1]  # The values of regParam in ALS for tuning
model_tuning_method = "TrainValidationSplit"  # TrainValidationSplit or CrossValidator
# Build the recommendation model by using ALS on the training data
# We set the cold start strategy to 'drop' to ensure that we don't get NaN evaluation metrics
als = ALS(
    maxIter=num_epochs,
    userCol="_user_id",
    itemCol="_item_id",
    ratingCol=RATING_COL,
    coldStartStrategy="drop",
    implicitPrefs=False,
    nonnegative=True,
)
모델 하이퍼 매개 변수 튜닝
다음 코드 샘플은 하이퍼 매개 변수를 검색하는 데 도움이 되는 매개 변수 그리드를 생성합니다. 또한 이 코드는 RMSE(루트 평균 제곱 오차)를 평가 메트릭으로 사용하는 회귀 평가기를 만듭니다.
#  Construct a grid search to select the best values for the training parameters
param_grid = (
    ParamGridBuilder()
    .addGrid(als.rank, rank_size_list)
    .addGrid(als.regParam, reg_param_list)
    .build()
)

print("Number of models to be tested: ", len(param_grid))

# Define the evaluator and set the loss function to the RMSE
evaluator = RegressionEvaluator(
    metricName="rmse", labelCol=RATING_COL, predictionCol="prediction"
)
다음 코드 샘플은 미리 구성된 매개 변수를 기반으로 다양한 모델 튜닝 메서드를 시작합니다. 모델 튜닝 에 대한 자세한 내용은 Apache Spark 웹 사이트에서 ML 튜닝: 모델 선택 및 하이퍼 매개 변수 튜닝을 참조하세요.
# Build cross-validation by using CrossValidator and TrainValidationSplit
if model_tuning_method == "CrossValidator":
    tuner = CrossValidator(
        estimator=als,
        estimatorParamMaps=param_grid,
        evaluator=evaluator,
        numFolds=5,
        collectSubModels=True,
    )
elif model_tuning_method == "TrainValidationSplit":
    tuner = TrainValidationSplit(
        estimator=als,
        estimatorParamMaps=param_grid,
        evaluator=evaluator,
        # 80% of the training data will be used for training; 20% for validation
        trainRatio=0.8,
        collectSubModels=True,
    )
else:
    raise ValueError(f"Unknown model_tuning_method: {model_tuning_method}")
모델 평가
테스트 데이터에 대해 모듈을 평가해야 합니다. 잘 학습된 모델에는 데이터 세트에 대한 높은 메트릭이 있어야 합니다.
과잉 맞춤된 모델에는 학습 데이터의 크기가 증가하거나 일부 중복 기능이 감소해야 할 수 있습니다. 모델 아키텍처를 변경해야 하거나 매개 변수에 미세 조정이 필요할 수 있습니다.
참고 항목
음의 R 제곱 메트릭 값은 학습된 모델이 가로 직선보다 더 나쁜 성능을 나타낸다는 것을 나타냅니다. 이 결과는 학습된 모델이 데이터를 설명하지 않음을 시사합니다.
평가 함수를 정의하려면 다음 코드를 사용합니다.
def evaluate(model, data, verbose=0):
    """
    Evaluate the model by computing rmse, mae, r2, and variance over the data.
    """

    predictions = model.transform(data).withColumn(
        "prediction", F.col("prediction").cast("double")
    )

    if verbose > 1:
        # Show 10 predictions
        predictions.select("_user_id", "_item_id", RATING_COL, "prediction").limit(
            10
        ).show()

    # Initialize the regression evaluator
    evaluator = RegressionEvaluator(predictionCol="prediction", labelCol=RATING_COL)

    _evaluator = lambda metric: evaluator.setMetricName(metric).evaluate(predictions)
    rmse = _evaluator("rmse")
    mae = _evaluator("mae")
    r2 = _evaluator("r2")
    var = _evaluator("var")

    if verbose > 0:
        print(f"RMSE score = {rmse}")
        print(f"MAE score = {mae}")
        print(f"R2 score = {r2}")
        print(f"Explained variance = {var}")

    return predictions, (rmse, mae, r2, var)
MLflow를 사용하여 실험 추적
MLflow를 사용하여 모든 실험을 추적하고 매개 변수, 메트릭 및 모델을 기록합니다. 모델 학습 및 평가를 시작하려면 다음 코드를 사용합니다.
from mlflow.models.signature import infer_signature

with mlflow.start_run(run_name="als"):
    # Train models
    models = tuner.fit(train)
    best_metrics = {"RMSE": 10e6, "MAE": 10e6, "R2": 0, "Explained variance": 0}
    best_index = 0
    # Evaluate models
    # Log models, metrics, and parameters
    for idx, model in enumerate(models.subModels):
        with mlflow.start_run(nested=True, run_name=f"als_{idx}") as run:
            print("\nEvaluating on test data:")
            print(f"subModel No. {idx + 1}")
            predictions, (rmse, mae, r2, var) = evaluate(model, test, verbose=1)

            signature = infer_signature(
                train.select(["_user_id", "_item_id"]),
                predictions.select(["_user_id", "_item_id", "prediction"]),
            )
            print("log model:")
            mlflow.spark.log_model(
                model,
                f"{EXPERIMENT_NAME}-alsmodel",
                signature=signature,
                registered_model_name=f"{EXPERIMENT_NAME}-alsmodel",
                dfs_tmpdir="Files/spark",
            )
            print("log metrics:")
            current_metric = {
                "RMSE": rmse,
                "MAE": mae,
                "R2": r2,
                "Explained variance": var,
            }
            mlflow.log_metrics(current_metric)
            if rmse < best_metrics["RMSE"]:
                best_metrics = current_metric
                best_index = idx

            print("log parameters:")
            mlflow.log_params(
                {
                    "subModel_idx": idx,
                    "num_epochs": num_epochs,
                    "rank_size_list": rank_size_list,
                    "reg_param_list": reg_param_list,
                    "model_tuning_method": model_tuning_method,
                    "DATA_FOLDER": DATA_FOLDER,
                }
            )
    # Log the best model and related metrics and parameters to the parent run
    mlflow.spark.log_model(
        models.subModels[best_index],
        f"{EXPERIMENT_NAME}-alsmodel",
        signature=signature,
        registered_model_name=f"{EXPERIMENT_NAME}-alsmodel",
        dfs_tmpdir="Files/spark",
    )
    mlflow.log_metrics(best_metrics)
    mlflow.log_params(
        {
            "subModel_idx": idx,
            "num_epochs": num_epochs,
            "rank_size_list": rank_size_list,
            "reg_param_list": reg_param_list,
            "model_tuning_method": model_tuning_method,
            "DATA_FOLDER": DATA_FOLDER,
        }
    )
작업 영역에서 명명 aisample-recommendation 된 실험을 선택하여 학습 실행에 대한 기록된 정보를 봅니다. 실험 이름을 변경한 경우 새 이름이 있는 실험을 선택합니다. 기록된 정보는 다음 이미지와 유사합니다.

4단계: 채점할 최종 모델 로드 및 예측
모델 학습을 완료한 다음 최상의 모델을 선택한 후 채점할 모델을 로드합니다(추론이라고도 함). 이 코드는 모델을 로드하고 예측을 사용하여 각 사용자에 대해 상위 10개의 책을 추천합니다.
# Load the best model
# MLflow uses PipelineModel to wrap the original model, so we extract the original ALSModel from the stages
model_uri = f"models:/{EXPERIMENT_NAME}-alsmodel/1"
loaded_model = mlflow.spark.load_model(model_uri, dfs_tmpdir="Files/spark").stages[-1]

# Generate top 10 book recommendations for each user
userRecs = loaded_model.recommendForAllUsers(10)

# Represent the recommendations in an interpretable format
userRecs = (
    userRecs.withColumn("rec_exp", F.explode("recommendations"))
    .select("_user_id", F.col("rec_exp._item_id"), F.col("rec_exp.rating"))
    .join(df_items.select(["_item_id", "Book-Title"]), on="_item_id")
)
userRecs.limit(10).show()
출력은 다음 표와 유사합니다.
| _item_id | _User_id | 등급 | 책 제목 |
|---|---|---|---|
| 44865 | 7 | 7.9996786 | 래저 : 의 삶 ... |
| 786 | 7 | 6.2255826 | 피아노 맨의 D... |
| 45330 | 7 | 4.980466 | 마음의 상태 |
| 38960 | 7 | 4.980466 | 그가 원했던 모든 것 |
| 125415 | 7 | 4.505084 | 해리 포터와 ... |
| 44939 | 7 | 4.3579073 | 탈토스 : 의 삶 ... |
| 175247 | 7 | 4.3579073 | 본세터의 ... |
| 170183 | 7 | 4.228735 | 간단한 생활... |
| 88503 | 7 | 4.221206 | 블루 섬... |
| 32894 | 7 | 3.9031885 | 동지 |
레이크하우스에 예측 저장
이 코드를 사용하여 레이크하우스에 권장 사항을 다시 작성합니다.
# Code to save userRecs into the lakehouse
userRecs.write.format("delta").mode("overwrite").save(
    f"{DATA_FOLDER}/predictions/userRecs"
)
관련 콘텐츠
피드백
출시 예정: 2024년 내내 콘텐츠에 대한 피드백 메커니즘으로 GitHub 문제를 단계적으로 폐지하고 이를 새로운 피드백 시스템으로 바꿀 예정입니다. 자세한 내용은 다음을 참조하세요. https://aka.ms/ContentUserFeedback
다음에 대한 사용자 의견 제출 및 보기