지도에서 렌더링 연산자를 포인트, 원형 또는 거품으로 사용하여 쿼리의 일부로 지리 공간적 데이터를 시각화할 수 있습니다.
지리 공간적 클러스터링에 대한 자세한 내용은 지리 공간적 클러스터링을 참조 하세요.
예시
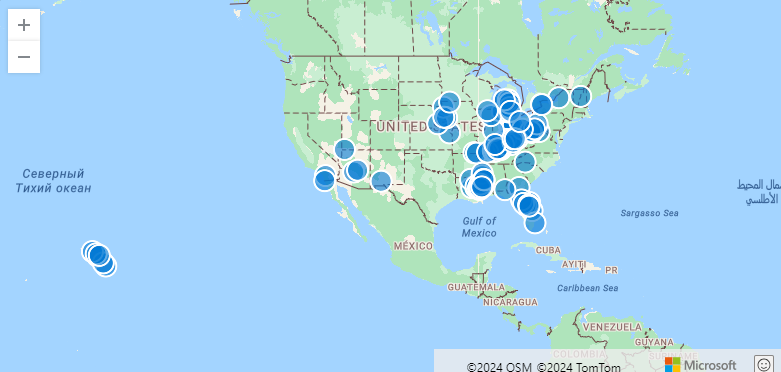
다음 예제에서는 Storm 이벤트를 찾고 지도에서 100을 시각화합니다.
StormEvents
| take 100
| project BeginLon, BeginLat
| render scatterchart with (kind = map)
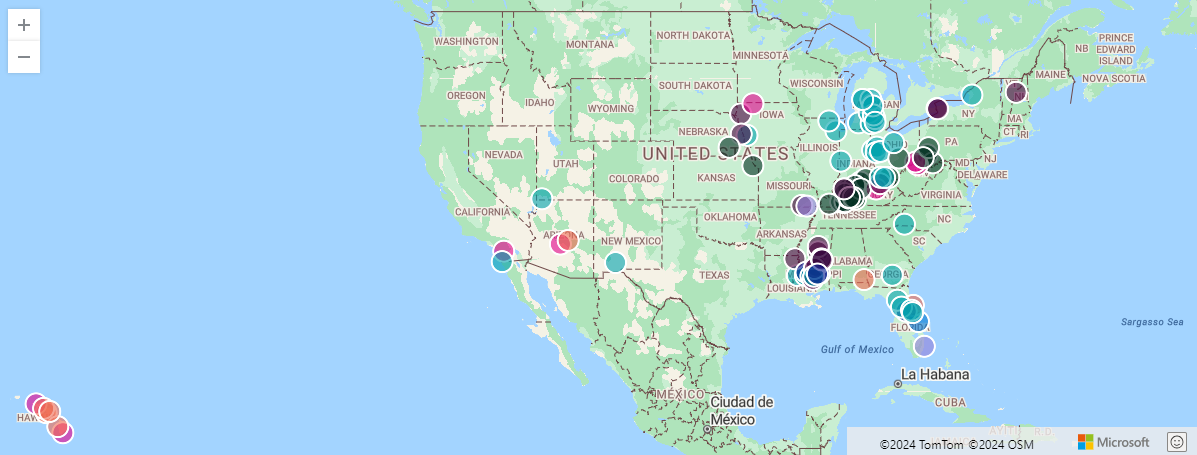
다음 예제에서는 [경도, 위도] 쌍이 각 점을 정의하고 세 번째 열이 계열을 정의하는 여러 일련의 점을 시각화합니다. 이 예제에서 계열은 .입니다 EventType.
StormEvents
| take 100
| project BeginLon, BeginLat, EventType
| render scatterchart with (kind = map)
다음 예제에서는 지도에서 일련의 점을 시각화합니다. 결과에 여러 열이 있는 경우 xcolumn(경도), ycolumn(위도) 및 계열에 사용할 열을 지정해야 합니다.
비고
여러 열 시각화는 Kusto.Explorer에서만 지원됩니다.
StormEvents
| take 100
| render scatterchart with (kind = map, xcolumn = BeginLon, ycolumns = BeginLat, series = EventType)
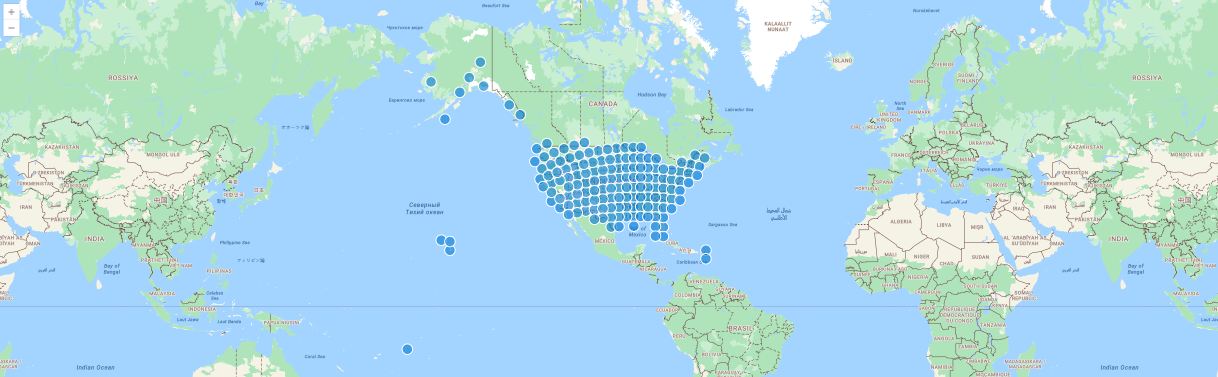
다음 예제에서는 GeoJSON 동적 값을 사용하여 맵의 점을 시각화하여 점을 정의합니다.
StormEvents
| project BeginLon, BeginLat
| summarize by hash=geo_point_to_s2cell(BeginLon, BeginLat, 5)
| project geo_s2cell_to_central_point(hash)
| render scatterchart with (kind = map)
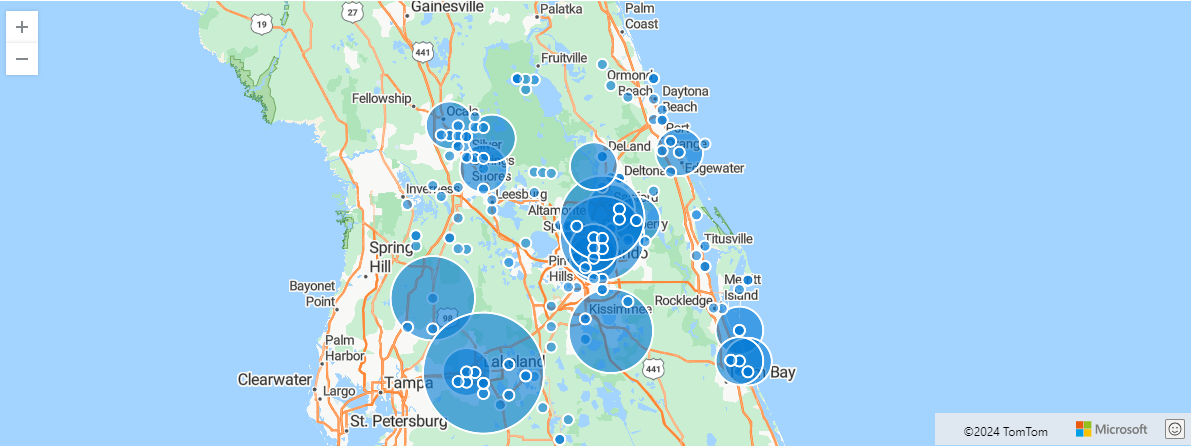
다음 예제에서는 S2 셀로 집계된 Storm 이벤트를 보여 줍니다. 차트는 거품의 이벤트를 한 가지 색의 위치별로 집계합니다.
StormEvents
| project BeginLon, BeginLat, EventType
| where geo_point_in_circle(BeginLon, BeginLat, real(-81.3891), 28.5346, 1000 * 100)
| summarize count() by EventType, hash = geo_point_to_s2cell(BeginLon, BeginLat)
| project geo_s2cell_to_central_point(hash), count_
| extend Events = "count"
| render piechart with (kind = map)
다음 예제에서는 S2 셀로 집계된 Storm 이벤트를 보여 줍니다. 차트는 위치별로 원형 차트의 이벤트 유형별로 이벤트를 집계합니다.
비고
색 축 시각화는 Kusto.Explorer에서만 지원됩니다.
StormEvents
| project BeginLon, BeginLat, EventType
| where geo_point_in_circle(BeginLon, BeginLat, real(-81.3891), 28.5346, 1000 * 100)
| summarize count() by EventType, hash = geo_point_to_s2cell(BeginLon, BeginLat)
| project geo_s2cell_to_central_point(hash), EventType, count_
| render piechart with (kind = map)

관련 콘텐츠
- 지리공간 클러스터링
- Render 연산자
- 자동차 테스트 차량 용 데이터 분석(지리 공간적 클러스터링 사용 사례)
- 지리 공간적 데이터 처리 및 분석을 위한 Azure 아키텍처에 대해 알아보기