In the Edge DevTools tab's Console tool in Visual Studio Code with this extension, you can do everything that you can do when using Microsoft Edge DevTools inside the browser.
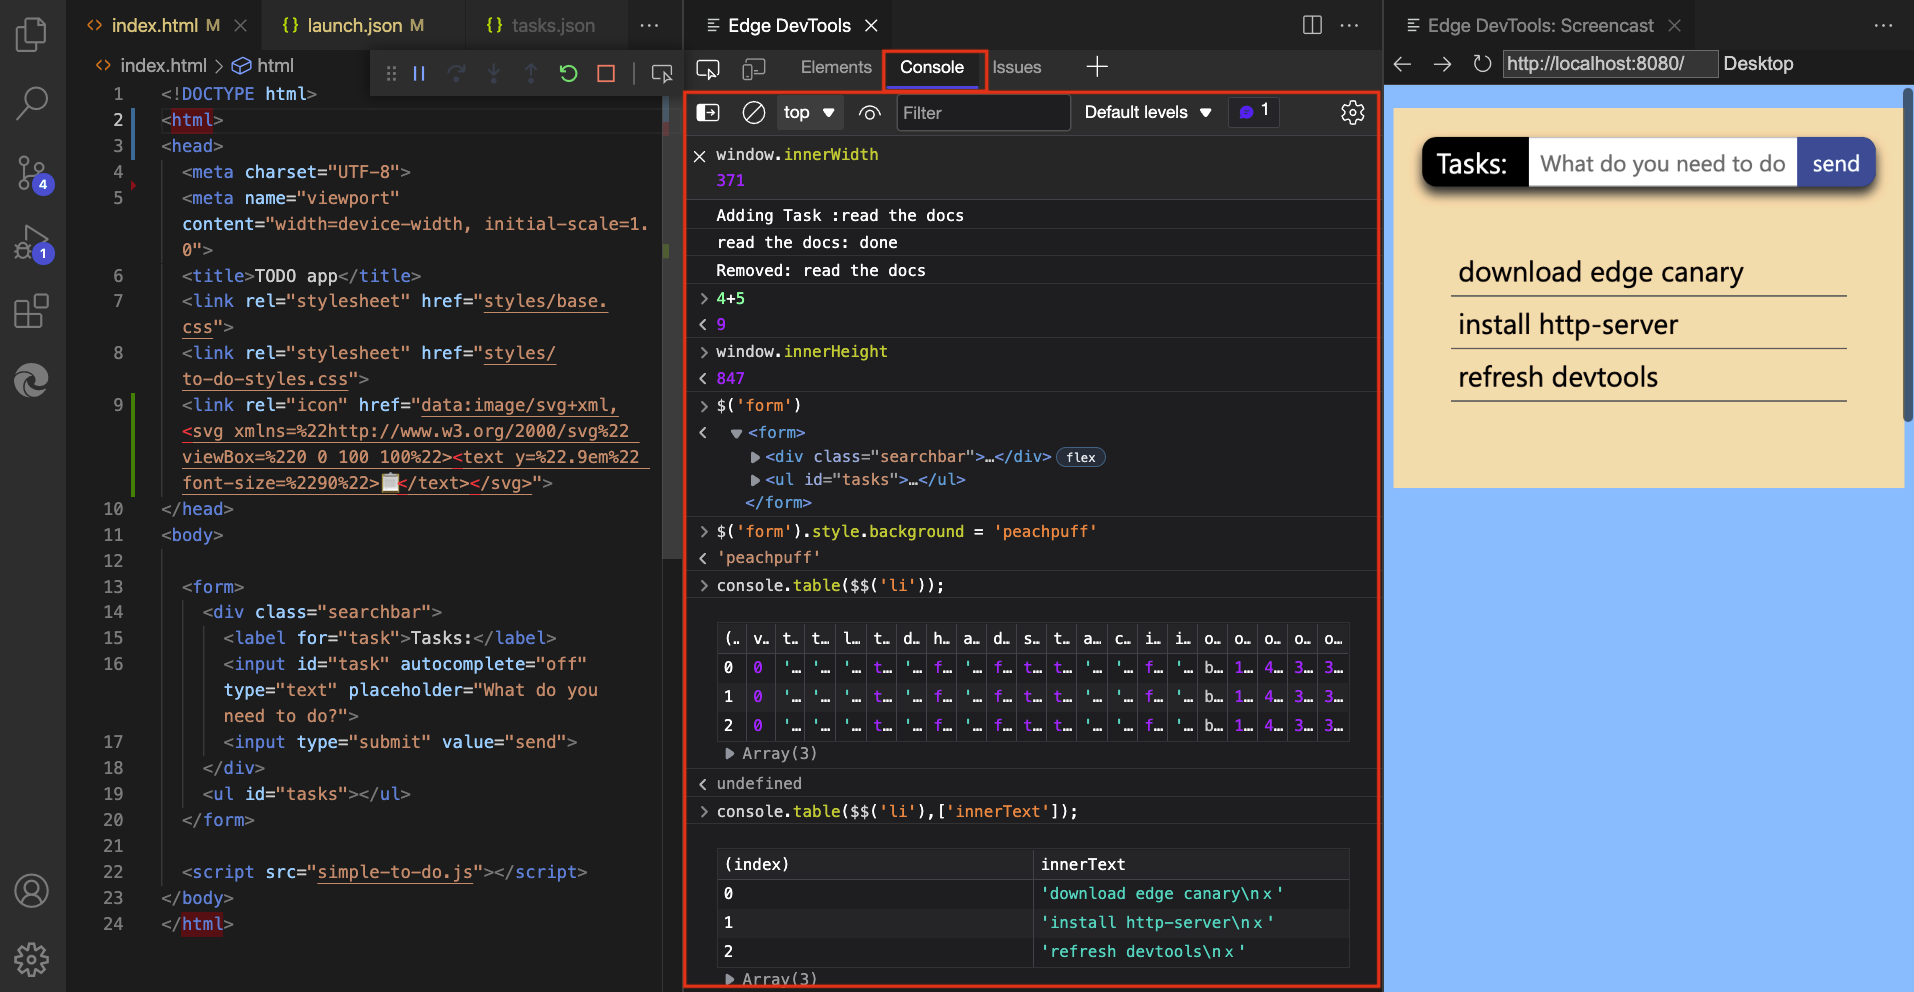
You can:
- View log messages.
- Access the
windowobject and use the DOM interaction convenience methods. - Filter the Console and set live expressions.
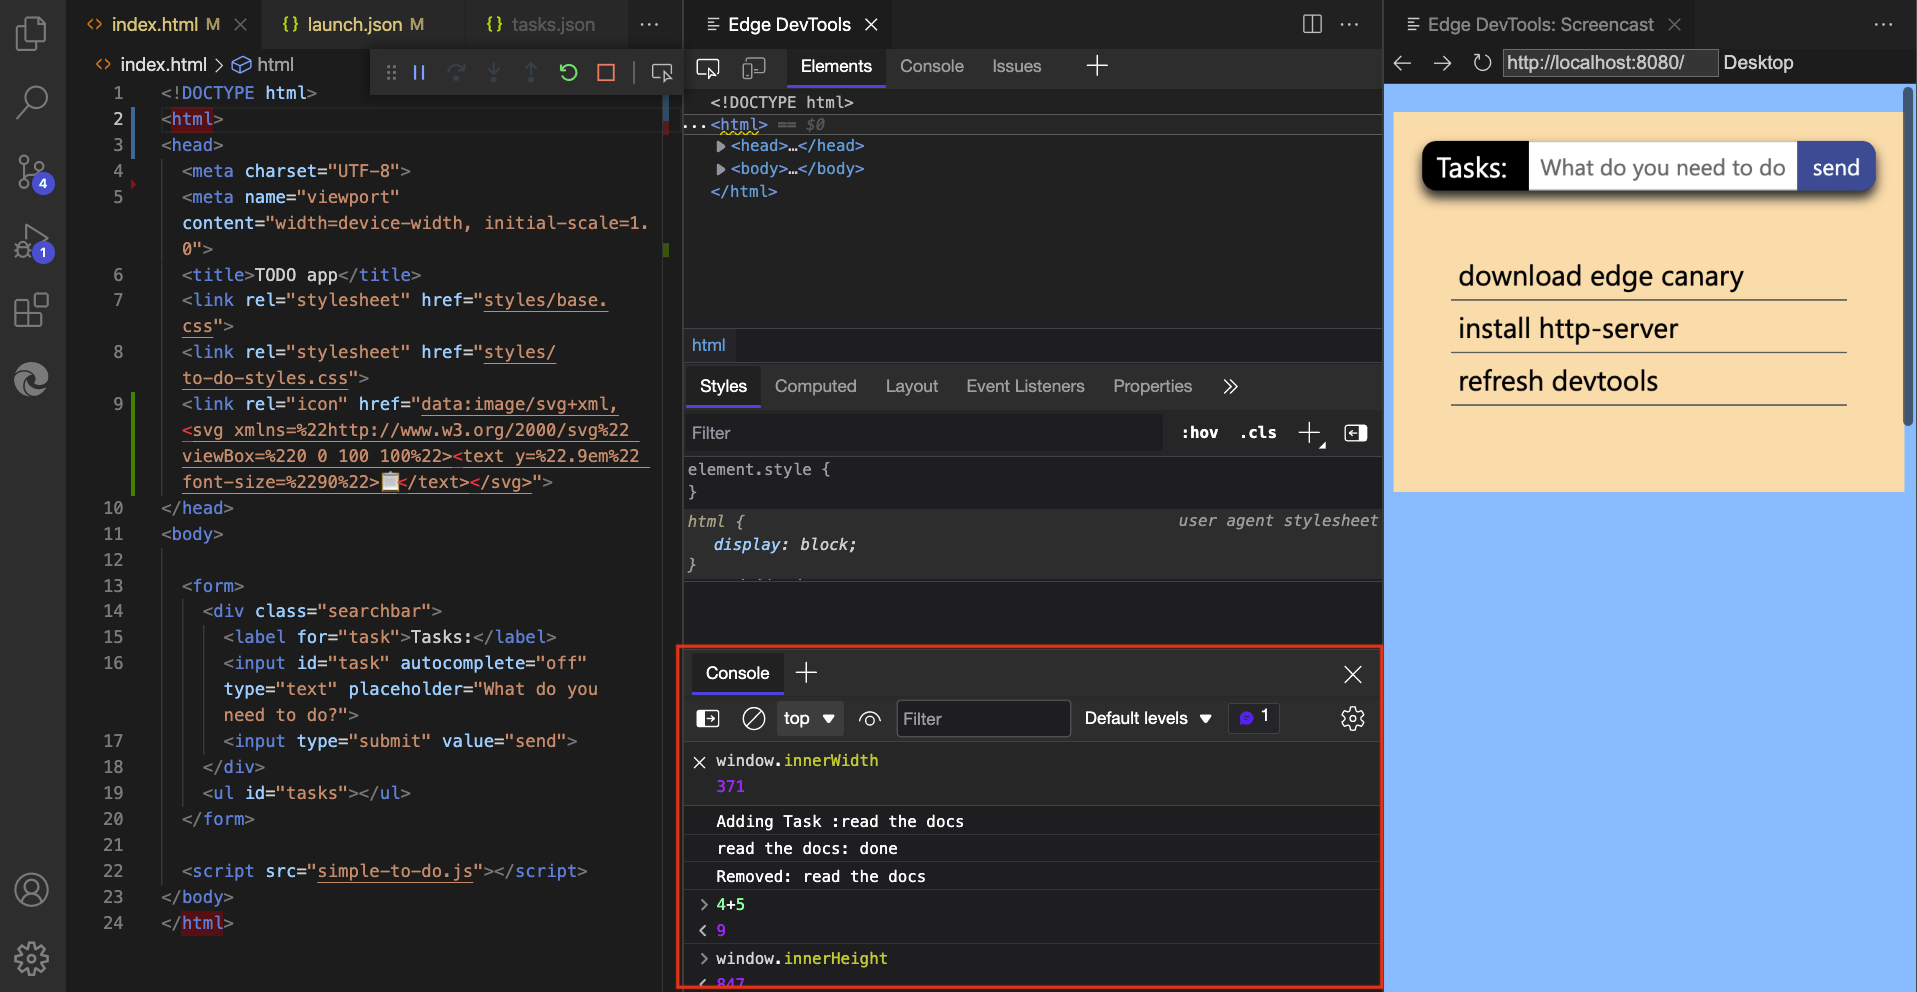
Console side-by-side with other tools
You can use the Console alongside the Elements tool, by opening the Console in the lower panel of the Edge DevTools tab:
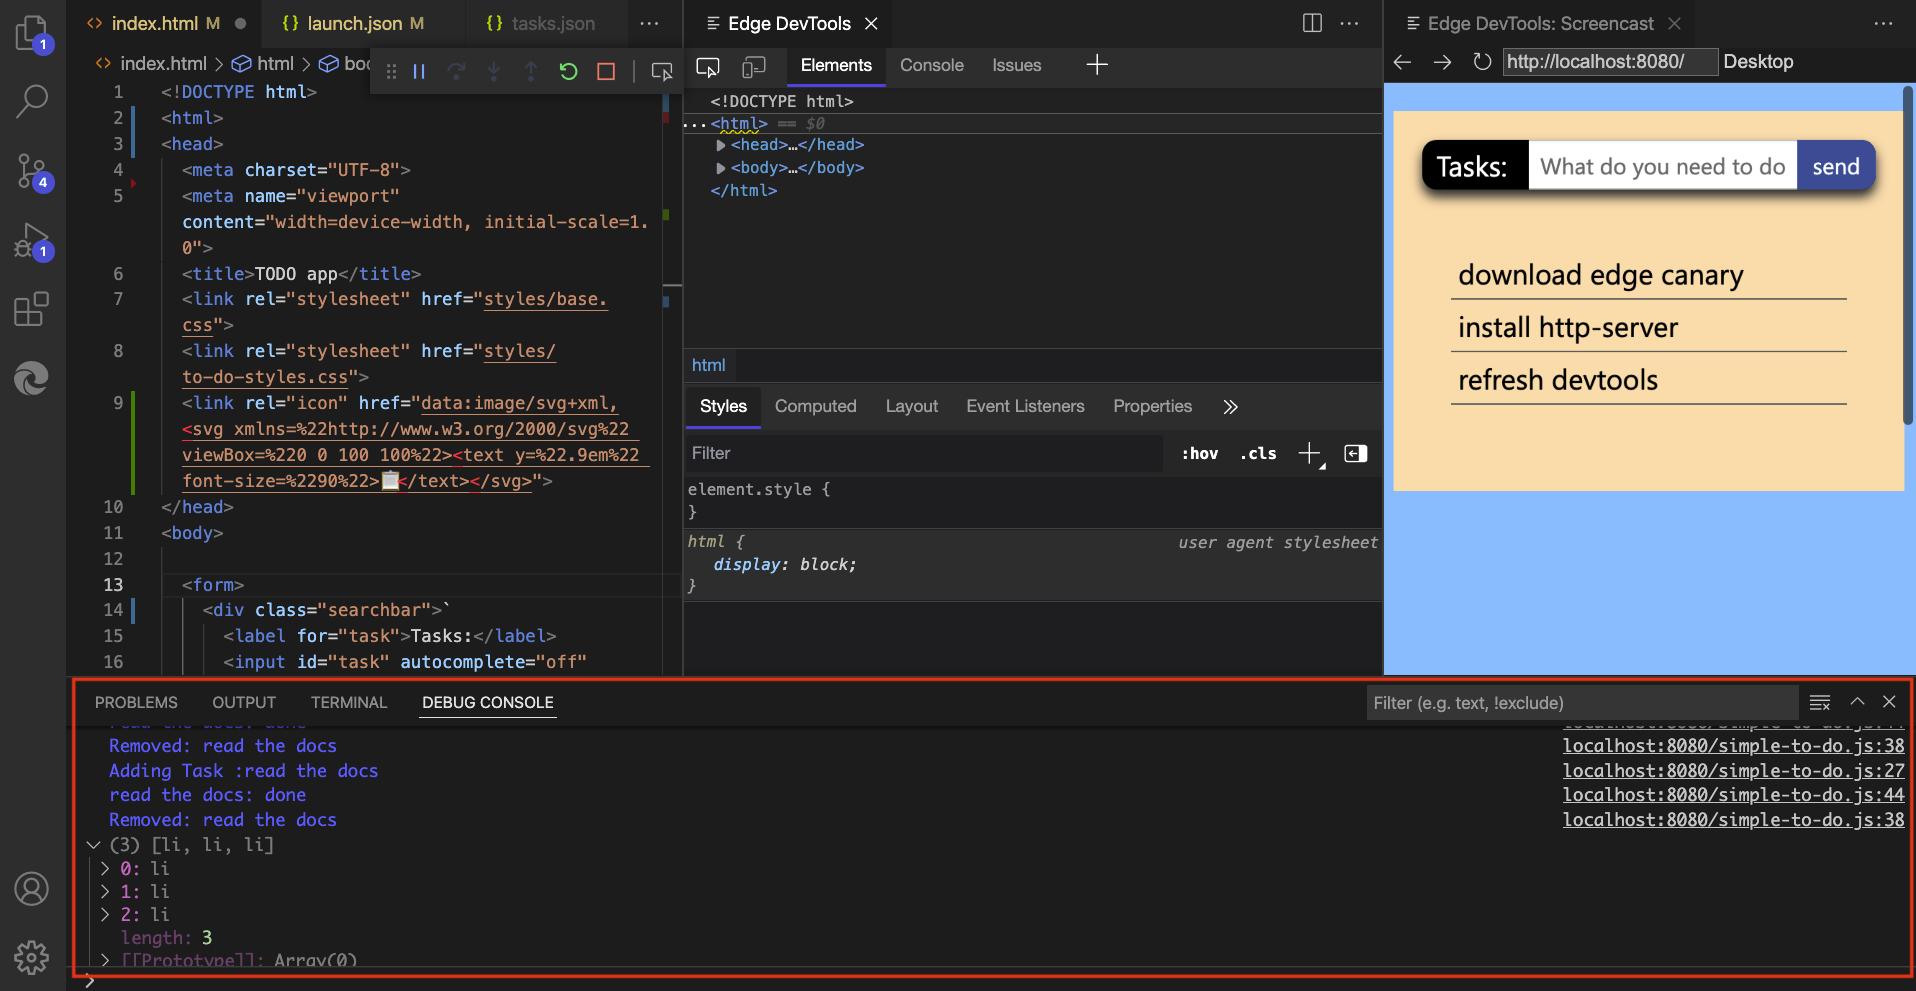
Console during Run and Debug
If you launch the DevTools extension from the Run and Debug workflow, the Debug Console of Visual Studio Code gives you most of the functions of the Edge DevTools tab's Console tool, but without filtering options, and with a more basic results display than the Edge DevTools tab's Console tool:
See also
- Console overview
- Debugging - the Debug Console of Visual Studio Code.
- Get started using the DevTools extension for Visual Studio Code
- Microsoft Edge DevTools extension for Visual Studio Code