Troubleshoot pipeline runs
TFS 2017 | TFS 2015
This topic provides general troubleshooting guidance. For specific troubleshooting about .NET Core, see .NET Core troubleshooting.
Note
In Microsoft Team Foundation Server (TFS) 2018 and previous versions, build and release pipelines are called definitions, runs are called builds, service connections are called service endpoints, stages are called environments, and jobs are called phases.
You can use the following troubleshooting sections to help diagnose issues with your pipeline. Most pipeline failures fall into one of these categories.
Pipeline won't trigger
If a pipeline doesn't start at all, check the following common trigger related issues.
- UI settings override YAML trigger setting
- Pull request triggers not supported with Azure Repos
- Branch filters misconfigured in CI and PR triggers
- Scheduled trigger time zone conversions
- UI settings override YAML scheduled triggers
UI settings override YAML trigger setting
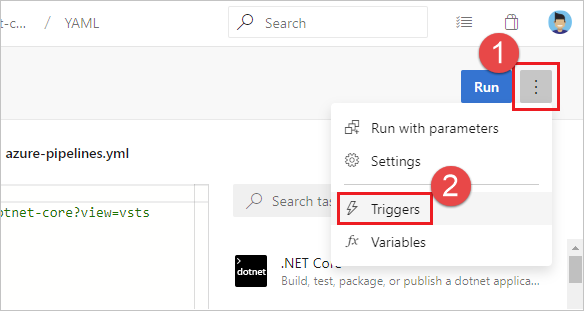
YAML pipelines can have their trigger and pr trigger settings overridden in the pipeline settings UI. If your trigger or pr triggers don't seem to be firing, check that setting. While editing your pipeline, choose ... and then Triggers.
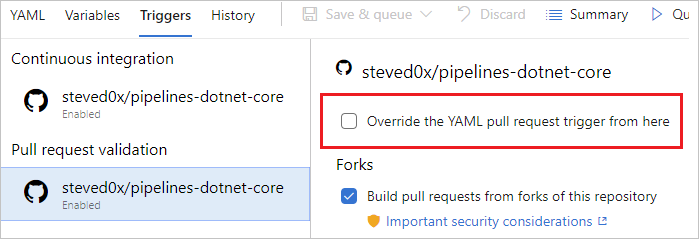
Check the Override the YAML trigger from here setting for the types of trigger (Continuous integration or Pull request validation) available for your repo.
Pull request triggers not supported with Azure Repos
If your pr trigger isn't firing, and you are using Azure Repos, it is because pr triggers aren't supported for Azure Repos. In Azure Repos Git, branch policies are used to implement pull request build validation. For more information, see Branch policy for pull request validation.
Branch filters misconfigured in CI and PR triggers
When you define a YAML PR or CI trigger, you can specify both include and exclude clauses for branches and paths. Ensure that the include clause matches the details of your commit and that the exclude clause doesn't exclude them.
Important
When you define a YAML PR or CI trigger, only branches explicitly configured to be included will trigger a run. Includes are processed first, and then excludes are removed from the list. If you specify an exclude but don't specify any includes, nothing will trigger. For more information, see pr and trigger.
Scheduled trigger time zone conversions
YAML scheduled triggers are set using UTC time zone. If your scheduled triggers don't seem to be firing at the right time, confirm the conversions between UTC and your local time zone, taking into account the day setting as well. For more information, see Scheduled triggers.
UI settings override YAML scheduled triggers
If your YAML pipeline has both YAML scheduled triggers and UI defined scheduled triggers, only the UI defined scheduled triggers are run. To run the YAML defined scheduled triggers in your YAML pipeline, you must remove the scheduled triggers defined in the pipeline settings UI.
To access the pipeline settings UI from a YAML pipeline, edit your pipeline, choose ... and then Triggers.
Remove all scheduled triggers.
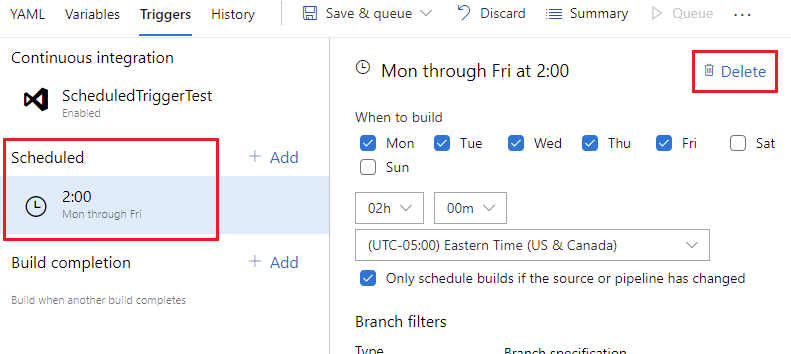
Once all UI scheduled triggers are removed, a push must be made in order for the YAML scheduled triggers to start running. For more information, see Scheduled triggers.
Pipeline queues but never gets an agent
If your pipeline queues but never gets an agent, check the following items.
- Parallel job limits - no available agents or you have hit your free limits
- Demands that don't match the capabilities of an agent
- TFS agent connection issues
Parallel job limits - no available agents or you have hit your free limits
If you are currently running other pipelines, you may not have any remaining parallel jobs, or you may have hit your free limits.
Demands that don't match the capabilities of an agent
If your pipeline has demands that don't meet the capabilities of any of your agents, your pipeline won't start. If only some of your agents have the desired capabilities and they are currently running other pipelines, your pipeline will be stalled until one of those agents becomes available.
To check the capabilities and demands specified for your agents and pipelines, see Capabilities.
TFS agent connection issues
- Config fails while testing agent connection (on-premises TFS only)
- Agent lost communication
- TFS Job Agent not started
- Misconfigured notification URL (1.x agent version)
Config fails while testing agent connection (on-premises TFS only)
Testing agent connection.
VS30063: You are not authorized to access http://<SERVER>:8080/tfs
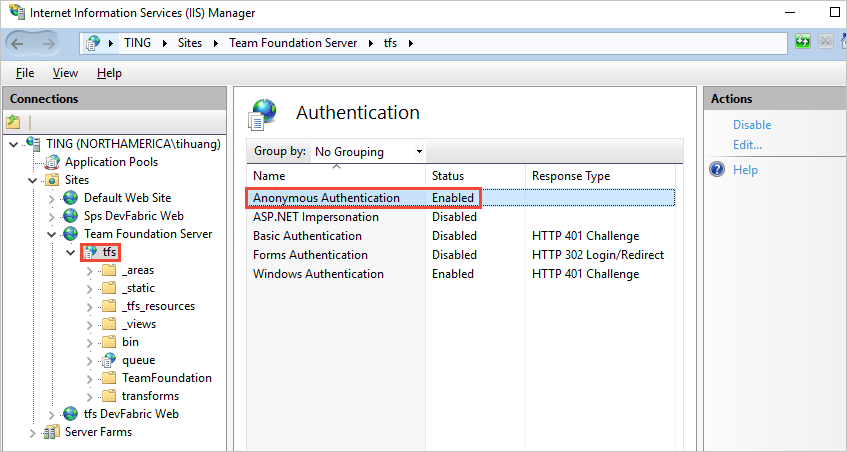
If the above error is received while configuring the agent, log on to your TFS machine. Start the Internet Information Services (IIS) manager. Make sure Anonymous Authentication is enabled.
Agent lost communication
This issue is characterized by the error message:
The job has been abandoned because agent did not renew the lock. Ensure agent is running, not sleeping, and has not lost communication with the service.
This error may indicate the agent lost communication with the server for a span of several minutes. Check the following to rule out network or other interruptions on the agent machine:
- Verify automatic updates are turned off. A machine reboot from an update will cause a build or release to fail with the above error. Apply updates in a controlled fashion to avoid this type of interruption. Before rebooting the agent machine, the agent should first be marked disabled in the pool administration page and let any running build finish.
- Verify the sleep settings are turned off.
- If the agent is running on a virtual machine, avoid any live migration or other VM maintenance operation that may severely impact the health of the machine for multiple minutes.
- If the agent is running on a virtual machine, the same operating-system-update recommendations and sleep-setting recommendations apply to the host machine. And also any other maintenance operations that several impact the host machine.
- Performance monitor logging or other health metric logging can help to correlate this type of error to constrained resource availability on the agent machine (disk, memory, page file, processor, network).
- Another way to correlate the error with network problems is to ping a server indefinitely and dump the output to a file, along with timestamps. Use a healthy interval, for example 20 or 30 seconds. If you are using Azure Pipelines, then you would want to ping an internet domain, for example bing.com. If you are using an on-premises TFS server, then you would want to ping a server on the same network.
- Verify the network throughput of the machine is adequate. You can perform an online speed test to check the throughput.
- If you use a proxy, verify the agent is configured to use your proxy. Refer to the agent deployment topic.
TFS Job Agent not started
This may be characterized by a message in the web console "Waiting for an agent to be requested". Verify the TFSJobAgent (display name: Visual Studio Team Foundation Background Job Agent) Windows service is started.
Misconfigured notification URL (1.x agent version)
This may be characterized by a message in the web console "Waiting for console output from an agent", and the process eventually times out.
A mismatching notification URL may cause the worker to process to fail to connect to the server. See Team Foundation Administration Console, Application Tier. The 1.x agent listens to the message queue using the URL that it was configured with. However, when a job message is pulled from the queue, the worker process uses the notification URL to communicate back to the server.
Pipeline fails to complete
If your pipeline gets an agent but fails to complete, check the following common issues. If your issue doesn't seem to match one of these, see Get logs to diagnose problems.
- Job time-out
- Issues downloading code
- My pipeline is failing on a command-line step such as MSBUILD
- File or folder in use errors
- Intermittent or inconsistent MSBuild failures
- Process stops responding
- Line endings for multiple platforms
- Variables having ' (single quote) appended
- Service Connection related issues
Job time-out
A pipeline may run for a long time and then fail due to job time-out. Job timeout closely depends on the agent being used. Free Microsoft hosted agents have a max timeout of 60 minutes per job for a private repository and 360 minutes for a public repository. To increase the max timeout for a job, you can opt for any of the following.
- Buy a Microsoft hosted agent which will give you 360 minutes for all jobs, irrespective of the repository used
- Use a self-hosted agent to rule out any timeout issues due to the agent
Learn more about job timeout.
Note
If your Microsoft-hosted agent jobs are timing out, ensure that you haven't specified a pipeline timeout that is less than the max timeout for a job. To check, see Timeouts.
Issues downloading code
My pipeline is failing on a checkout step
If you are using a checkout step on an Azure Repos Git repository in your organization that is in a different project than your pipeline, ensure that the Limit job authorization scope to current project setting is disabled, or follow the steps in Scoped build identities to ensure that your pipeline has access to the repository.
When your pipeline can't access the repository due to limited job authorization scope, you will receive the error Git fetch failed with exit code 128 and your logs will contain an entry similar to Remote: TF401019: The Git repository with name or identifier <your repo name> does not exist or you do not have permissions for the operation you are attempting.
If your pipeline is failing immediately with Could not find a project that corresponds with the repository, ensure that your project and repository name are correct in the checkout step or the repository resource declaration.
Team Foundation Version Control (TFVC) issues
Get sources not downloading some files
This may be characterized by a message in the log "All files up to date" from the tf get command. Verify the built-in service identity has permission to download the sources. Either the identity Project Collection Build Service or Project Build Service will need permission to download the sources, depending on the selected authorization scope on General tab of the build pipeline. In the version control web UI, you can browse the project files at any level of the folder hierarchy and check the security settings.
Get sources through Team Foundation Proxy
The easiest way to configure the agent to get sources through a Team Foundation Proxy is set environment variable TFSPROXY that point to the TFVC proxy server for the agent's run as user.
Windows:
    set TFSPROXY=http://tfvcproxy:8081
    setx TFSPROXY=http://tfvcproxy:8081 // If the agent service is running as NETWORKSERVICE or any service account you can't easily set user level environment variable
macOS/Linux:
export TFSPROXY=http://tfvcproxy:8081
My pipeline is failing on a command-line step such as MSBUILD
It is helpful to narrow whether a build or release failure is the result of an Azure Pipelines/TFS product issue (agent or tasks). Build and release failures may also result from external commands.
Check the logs for the exact command-line executed by the failing task. Attempting to run the command locally from the command line may reproduce the issue. It can be helpful to run the command locally from your own machine, and/or log-in to the machine and run the command as the service account.
For example, is the problem happening during the MSBuild part of your build pipeline (for example, are you using either the MSBuild or Visual Studio Build task)? If so, then try running the same MSBuild command on a local machine using the same arguments. If you can reproduce the problem on a local machine, then your next steps are to investigate the MSBuild problem.
Differences between local command prompt and agent
Keep in mind, some differences are in effect when executing a command on a local machine and when a build or release is running on an agent. If the agent is configured to run as a service on Linux, macOS, or Windows, then it is not running within an interactive logged-on session. Without an interactive logged-on session, UI interaction and other limitations exist.
File or folder in use errors
File or folder in use errors are often indicated by error messages such as:
Access to the path [...] is denied.The process cannot access the file [...] because it is being used by another process.Access is denied.Can't move [...] to [...]
Troubleshooting steps:
- Detect files and folders in use
- Anti-virus exclusion
- MSBuild and /nodeReuse:false
- MSBuild and /maxcpucount:[n]
Detect files and folders in use
On Windows, tools like Process Monitor can be to capture a trace of file events under a specific directory. Or, for a snapshot in time, tools like Process Explorer or Handle can be used.
Anti-virus exclusion
Anti-virus software scanning your files can cause file or folder in use errors during a build or release. Adding an anti-virus exclusion for your agent directory and configured "work folder" may help to identify anti-virus software as the interfering process.
MSBuild and /nodeReuse:false
If you invoke MSBuild during your build, make sure to pass the argument /nodeReuse:false (short form /nr:false). Otherwise MSBuild process(es) will remain running after the build completes. The process(es) remain for some time in anticipation of a potential subsequent build.
This feature of MSBuild can interfere with attempts to delete or move a directory - due to a conflict with the working directory of the MSBuild process(es).
The MSBuild and Visual Studio Build tasks already add /nr:false to the arguments passed to MSBuild. However, if you invoke MSBuild from your own script, then you would need to specify the argument.
MSBuild and /maxcpucount:[n]
By default the build tasks such as MSBuild and Visual Studio Build run MSBuild with the /m switch. In some cases this can cause problems such as multiple process file access issues.
Try adding the /m:1 argument to your build tasks to force MSBuild to run only one process at a time.
File-in-use issues may result when leveraging the concurrent-process feature of MSBuild. Not specifying the argument /maxcpucount:[n] (short form /m:[n]) instructs MSBuild to use a single process only. If you are using the MSBuild or Visual Studio Build tasks, you may need to specify "/m:1" to override the "/m" argument that is added by default.
Intermittent or inconsistent MSBuild failures
If you are experiencing intermittent or inconsistent MSBuild failures, try instructing MSBuild to use a single-process only. Intermittent or inconsistent errors may indicate that your target configuration is incompatible with the concurrent-process feature of MSBuild. See MSBuild and /maxcpucount:[n].
Process stops responding
Process stops responding causes and troubleshooting steps:
Waiting for Input
A process that stops responding may indicate that a process is waiting for input.
Running the agent from the command line of an interactive logged on session may help to identify whether a process is prompting with a dialog for input.
Running the agent as a service may help to eliminate programs from prompting for input. For example in .NET, programs may rely on the System.Environment.UserInteractive Boolean to determine whether to prompt. When running as a Windows service, the value is false.
Process dump
Analyzing a dump of the process can help to identify what a deadlocked process is waiting on.
WiX project
Building a WiX project when custom MSBuild loggers are enabled, can cause WiX to deadlock waiting on the output stream. Adding the additional MSBuild argument /p:RunWixToolsOutOfProc=true will workaround the issue.
Line endings for multiple platforms
When you run pipelines on multiple platforms, you can sometimes encounter problems with different line endings. Historically, Linux and macOS used linefeed (LF) characters while Windows used a carriage return plus a linefeed (CRLF). Git tries to compensate for the difference by automatically making lines end in LF in the repo but CRLF in the working directory on Windows.
Most Windows tools are fine with LF-only endings, and this automatic behavior can cause more problems than it solves.
If you encounter issues based on line endings, we recommend you configure Git to prefer LF everywhere.
To do this, add a .gitattributes file to the root of your repository.
In that file, add the following line:
* text eol=lf
Variables having ' (single quote) appended
If your pipeline includes a Bash script that sets variables using the ##vso command, you may see an additional ' appended to the value of the variable you set.
This occurs because of an interaction with set -x.
The solution is to disable set -x temporarily before setting a variable.
The Bash syntax for doing that is set +x.
set +x
echo ##vso[task.setvariable variable=MY_VAR]my_value
set -x
Why does this happen?
Many Bash scripts include the set -x command to assist with debugging.
Bash will trace exactly what command was executed and echo it to stdout.
This will cause the agent to see the ##vso command twice, and the second time, Bash will have added the ' character to the end.
For instance, consider this pipeline:
steps:
- bash: |
    set -x
    echo ##vso[task.setvariable variable=MY_VAR]my_value
On stdout, the agent will see two lines:
##vso[task.setvariable variable=MY_VAR]my_value
+ echo '##vso[task.setvariable variable=MY_VAR]my_value'
When the agent sees the first line, MY_VAR will be set to the correct value, "my_value".
However, when it sees the second line, the agent will process everything to the end of the line.
MY_VAR will be set to "my_value'".
Libraries aren't installed for Python application when script executes
When a Python application is deployed, in some cases, a CI/CD pipeline runs and the code is deployed successfully, but the requirements.txt file that's responsible for installing all dependency libraries doesn't execute.
To install the dependencies, use a post-deployment script in the App Service deployment task. The following example shows the command you must use in the post-deployment script. You can update the script for your scenario.
D:\home\python364x64\python.exe -m pip install -r requirements.txt
Service Connection related issues
To troubleshoot issues related to service connections, see Service connection troubleshooting.
Enable Storage Explorer to deploy static content like .css and .js to a static website from Azure DevOps via Azure Pipelines
In this scenario, you can use the Azure File Copy task to upload content to the website. You can use any of the tools described in Uploading content to upload content to the web container.
Get logs to diagnose problems
If none of the previous suggestions match your problem, you can use the information in the logs to diagnose your failing pipeline.
Start by looking at the logs in your completed build or release. You can view logs by navigating to the pipeline run summary and selecting the job and task. If a certain task is failing, check the logs for that task.
In addition to viewing logs in the pipeline build summary, you can download complete logs which include additional diagnostic information, and you can configure more verbose logs to assist with your troubleshooting.
For detailed instructions for configuring and using logs, see Review logs to diagnose pipeline issues.
I need more help. I found a bug. I've got a suggestion. Where do I go?
Get subscription, billing, and technical support
Report any problems or submit feedback at Developer Community.
We welcome your suggestions: