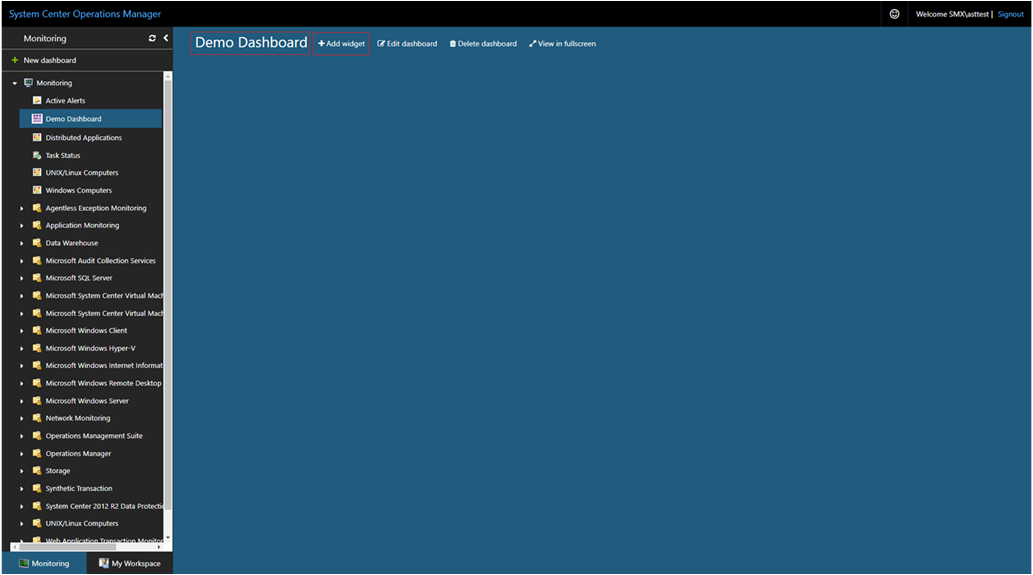
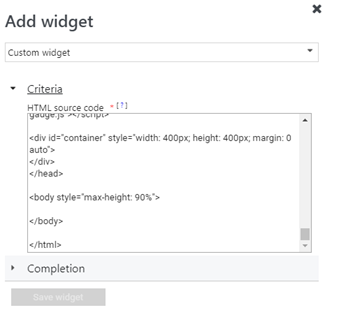
System Center Operations Manager에서 웹 콘솔은 웹 콘솔 서버에 연결된 브라우저를 사용하여 모든 컴퓨터에서 열 수 있는 관리 그룹에 대한 모니터링 인터페이스를 제공합니다. 다음 단계에서는 REST 기반의 새 API를 사용하는 새 HTML5 웹 콘솔의 대시보드에 사용자 지정 위젯을 추가하는 방법을 설명합니다. 지정된 HTML 코드를 실행하고 다양한 시각화에서 원하는 출력을 시각화합니다.
REST API 참조를 사용하여 대시보드에 운영 데이터를 표시하기 위해 사용자 지정 위젯으로 수행할 수 있는 사용 가능한 작업에 대해 알아봅니다. REST API를 익숙하지 않은 경우 아직 본 적이 없는 경우 이 API를 시작하는 방법에 대한 정보를 살펴보세요.
사용자 지정 위젯 스크립트에는 다음 세 가지 주요 섹션이 있습니다.
각 데이터 형식에 대한 모니터링 데이터의 범위를 지정하려면 클래스를 선택하여 해당 클래스의 모든 인스턴스를 보거나 선택한 클래스의 개체 하위 집합만 보려면 그룹을 포함할 수도 있습니다. 예를 들어 Windows Server DC Computer 클래스의 모든 개체를 지정하려면 classId의 속성 값을 수정합니다.
대상 클래스와 선택적으로 결과의 범위를 더 지정할 그룹을 지정한 후에는 하나 이상의 속성 값에 따라 표시할 데이터 형식을 제한하는 조건을 지정할 수 있습니다.
위젯은 다음 차트 유형에서 렌더링 모니터링 데이터를 지원합니다.
상태, 성능 및 경고 데이터를 표시하도록 차트 유형을 구성할 수 있습니다. 아래의 각 예제에 대해 특정 해결 상태와 일치하는 심각도에 대해 Windows 컴퓨터 그룹의 경고가 반환됩니다.
각 차트 종류에 대한 HTML 코드를 보려면 필요한 탭을 선택합니다.
다음 HTML 코드는 상태 데이터를 사용하여 가로 막대형 차트를 렌더링하는 방법을 보여 줍니다.
<!DOCTYPE HTML>
<html>
<head>
<script src="https://ajax.googleapis.com/ajax/libs/jquery/3.2.1/jquery.min.js"></script>
<script type="text/javascript">
var criticalCounter = 0;
var healthyCounter = 0;
var warningCounter = 0;
var unmonitoredCounter = 0;
window.onload = function () {
$.ajax({
url: "/OperationsManager/data/state",
type: "POST",
data: JSON.stringify({
"classId": "System.Library!System.Computer",
"objectIds": {
// Key value pairs => id: 0 (For objects)/-1 (For groups)
"1d62280e-f437-1369-316b-1e8659500e9a": -1
},
"criteria": "((HealthState = '0') OR (HealthState = '1') OR (HealthState = '2') OR (HealthState = '3') OR HealthState is null)",
"displayColumns": [
"healthstate",
"displayname",
"path",
"maintenancemode"
]
}),
success: function (result) {
for (var i = 0; i < result.rows.length; i++) {
switch (result.rows[i].healthstate) {
case "critical":
criticalCounter++;
break;
case "healthy":
healthyCounter++;
break;
case "warning":
warningCounter++;
break;
case "unmonitored":
unmonitoredCounter++;
break;
}
}
renderChart();
}
});
}
function renderChart() {
var chart = new CanvasJS.Chart("chartContainer", {
title: {
text: "Health State of Windows Computers"
},
data: [{
type: "column",
dataPoints: [
{ y: criticalCounter, label: "Critical", color: "Red" },
{ y: healthyCounter, label: "Healthy", color: "Green" },
{ y: warningCounter, label: "Warning", color: "Yellow" },
{ y: unmonitoredCounter, label: "Unmonitored", color: "Gray" }
]
}]
});
chart.render();
}
</script>
<script src="https://cdnjs.cloudflare.com/ajax/libs/canvasjs/1.7.0/canvasjs.min.js"></script>
<title>CanvasJS Example</title>
</head>
<body>
<div id="chartContainer" style="height: 400px; width: 100%;"></div>
</body>
</html>
다음 HTML 코드는 성능 데이터를 사용하여 스플라인 차트를 렌더링하는 방법을 보여 줍니다.
<!DOCTYPE HTML>
<html>
<head>
<script src="https://ajax.googleapis.com/ajax/libs/jquery/3.2.1/jquery.min.js"></script>
<script type="text/javascript">
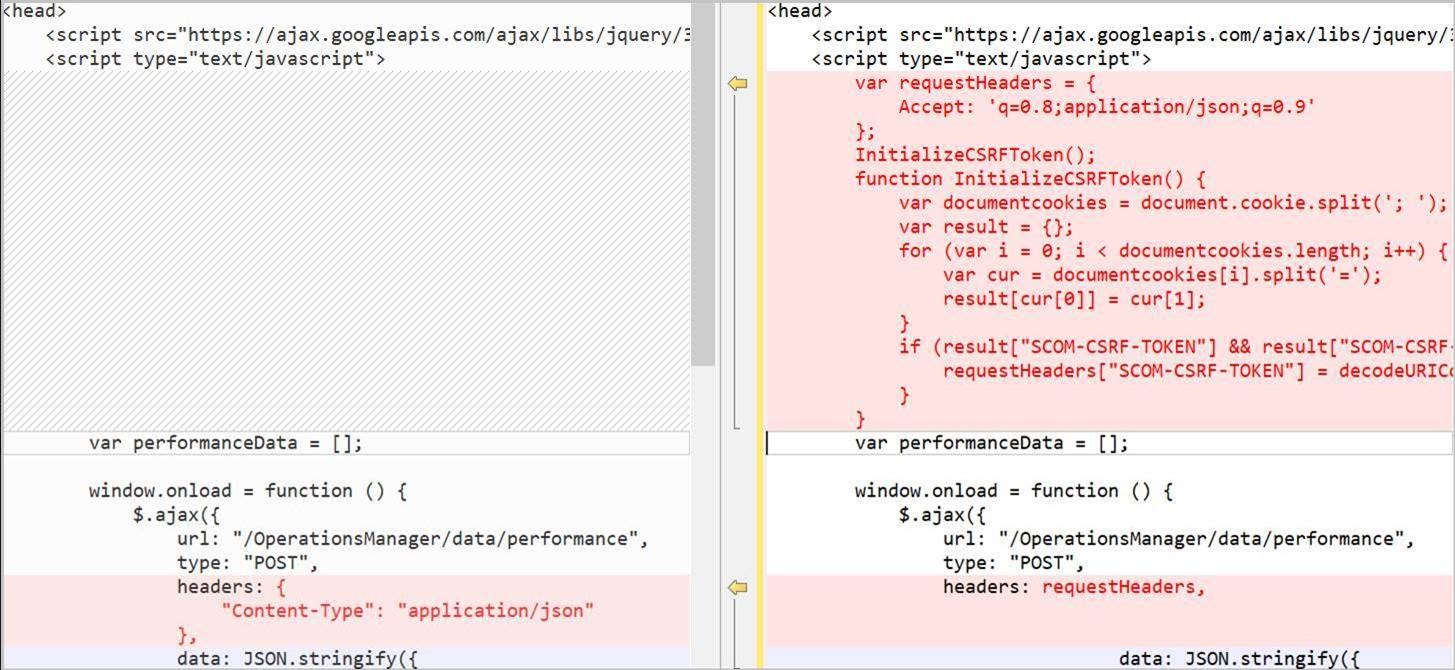
var performanceData = [];
window.onload = function () {
$.ajax({
url: "/OperationsManager/data/performance",
type: "POST",
headers: {
"Content-Type": "application/json"
},
data: JSON.stringify({
"id":"6f7e3306-beeb-2996-3795-7c1eafb925b8",
"performanceCounters":[
{
"objectname":"Health Service",
"countername":"agent processor utilization",
"instancename":""
}
],
"legends":[
"target",
"path",
"lastvalue"
],
"duration":4320
}),
success: function (result) {
let dataDictionary = result.datasets[0].data;
let sum = new Array(24).fill(0.0);
let count = new Array(24).fill(0.0);
for (var key in dataDictionary) {
if(dataDictionary.hasOwnProperty(key)) {
var datetime = new Date(key);
datetime = convertUTCDateToLocalDate(datetime);
sum[datetime.getHours()] += dataDictionary[key];
count[datetime.getHours()]++;
}
}
let tDate = new Date();
tDate.setHours(0,0,0,0);
for(var i=0; i<24; i++) {
performanceData.push({
y: sum[i] / count[i],
x: new Date(tDate.getTime())
});
tDate.setHours(tDate.getHours()+1);
}
renderChart();
}
});
}
function convertUTCDateToLocalDate(date) {
var newDate = new Date(date.getTime()+date.getTimezoneOffset()*60*1000);
var offset = date.getTimezoneOffset() / 60;
newDate.setMinutes(date.getMinutes() - date.getTimezoneOffset())
return newDate;
}
function renderChart() {
var chart = new CanvasJS.Chart("chartContainer", {
title: {
text: "Average Processor Utilization for Last 3 Days"
},
axisX: {
labelFormatter: function(e) {
return CanvasJS.formatDate(e.value, "hh:mm tt");
}
},
data: [{
type: "spline",
dataPoints: performanceData
}]
});
chart.render();
}
</script>
<script src="https://cdnjs.cloudflare.com/ajax/libs/canvasjs/1.7.0/canvasjs.min.js"></script>
<title>CanvasJS Example</title>
</head>
<body>
<div id="chartContainer" style="height: 100%; width: 100%;"></div>
</body>
</html>
다음 HTML 코드는 경고 데이터를 사용하여 가로 막대형 차트를 렌더링하는 방법을 보여 줍니다.
<!DOCTYPE HTML>
<html>

<head>
    <script src="https://ajax.googleapis.com/ajax/libs/jquery/3.2.1/jquery.min.js"></script>
    <script type="text/javascript">
        var criticalCounter = 0;
        var informationCounter = 0;
        var warningCounter = 0;

        window.onload = function () {
            $.ajax({
                url: "/OperationsManager/data/alert",
                type: "POST",
data: JSON.stringify({
"classId": null,
"objectIds": { "3c8ac4f3-475e-44dd-4163-8a97af363705": -1 },
"criteria": "((Severity = '0') OR (Severity = '1') OR (Severity = '2') OR (Severity = '3')) AND ((Priority = '2') OR (Priority = '1') OR (Priority = '0')) AND ((ResolutionState = '0') OR (ResolutionState = '247') OR (ResolutionState = '248') OR (ResolutionState = '249') OR (ResolutionState = '250') OR (ResolutionState = '254') OR (ResolutionState = '255'))",
"displayColumns":
[
"severity","monitoringobjectdisplayname","name","age","repeatcount","lastModified"
]
}),
success: function (result) {
for (var i = 0; i < result.rows.length; i++) {
switch(result.rows[i].severity)
{
case "Error":
criticalCounter++;
break;
case "Information":
informationCounter++;
break;
case "Warning":
warningCounter++
break;
}
}
renderChart();
}
});
}
function renderChart() {
var chart = new CanvasJS.Chart("chartContainer", {
title: {
text: "Alerts representation in bar chart"
},
data: [{
type: "column",
dataPoints: [
{ y: criticalCounter, label: "Critical" },
{ y: warningCounter, label: "Warning" },
{ y: informationCounter, label: "Information" }
]
}]
});
chart.render();
}
</script>
<script src="https://cdnjs.cloudflare.com/ajax/libs/canvasjs/1.7.0/canvasjs.min.js"></script>
<title>CanvasJS Example</title>
</head>
<body>
<div id="chartContainer" style="height: 400px; width: 100%;"></div>
</body>
</html>
다음 HTML 코드는 경고 데이터를 사용하여 원형 차트를 렌더링하는 방법을 보여 줍니다.
<!DOCTYPE HTML>
<html>

<head>
    <script src="https://ajax.googleapis.com/ajax/libs/jquery/3.2.1/jquery.min.js"></script>
    <script type="text/javascript">
        var criticalCounter = 0;
        var informationCounter = 0;
        var warningCounter = 0;

        window.onload = function () {
            $.ajax({
                url: "/OperationsManager/data/alert",
                type: "POST",
                data: JSON.stringify({
                    "classId": null,
                    "objectIds": { "3c8ac4f3-475e-44dd-4163-8a97af363705": -1 },
                    "criteria": "((Severity = '0') OR (Severity = '1') OR (Severity = '2') OR (Severity = '3')) AND ((Priority = '2') OR (Priority = '1') OR (Priority = '0')) AND ((ResolutionState = '0') OR (ResolutionState = '247') OR (ResolutionState = '248') OR (ResolutionState = '249') OR (ResolutionState = '250') OR (ResolutionState = '254') OR (ResolutionState = '255'))",
                    "displayColumns":
                    [
                        "severity","monitoringobjectdisplayname","name","age","repeatcount","lastModified"
                    ]
                }),
                success: function (result) {
                    for (var i = 0; i < result.rows.length; i++) {
            switch(result.rows[i].severity)
            {
                case "Error":
                    criticalCounter++;
                    break;
                case "Information":
                    informationCounter++;
                    break;
                case "Warning":
                                    warningCounter++
                    break;
            }
                    }
                    renderChart();
                }
            });
        }

        function renderChart() {
            var chart = new CanvasJS.Chart("chartContainer",
                {
                    theme: "theme2",
                    title: {
                        text: "Alerts representation in Pie chart"
                    },
                    data: [
                        {
                            type: "pie",
                            showInLegend: true,
                            toolTipContent: "{y} - #percent %",
                            legendText: "{indexLabel}",
                            dataPoints: [
                                { y: criticalCounter, indexLabel: "Critical" },
                                { y: warningCounter, indexLabel: "Warning" },
                                { y: informationCounter, indexLabel: "Information" }
                            ]
                        }
                    ]
                });
            chart.render();
        }
    </script>
    <script src="https://cdnjs.cloudflare.com/ajax/libs/canvasjs/1.7.0/canvasjs.min.js"></script>
    <title>CanvasJS Example</title>
</head>

<body>
    <div id="chartContainer" style="height: 400px; width: 100%;"></div>
</body>

</html>
다음 HTML 코드는 경고 데이터를 사용하여 3D 원형 차트를 렌더링하는 방법을 보여 줍니다.
<!DOCTYPE HTML>
<html>

<head>
    <script src="https://ajax.googleapis.com/ajax/libs/jquery/3.2.1/jquery.min.js"></script>
    <script type="text/javascript">
        var criticalCounter = 0;
        var informationCounter = 0;
        var warningCounter = 0;

        window.onload = function () {
            $.ajax({
                url: "/OperationsManager/data/alert",
                type: "POST",
                data: JSON.stringify({
                    "classId": null,
                    "objectIds": { "3c8ac4f3-475e-44dd-4163-8a97af363705": -1 },
                    "criteria": "((Severity = '0') OR (Severity = '1') OR (Severity = '2') OR (Severity = '3')) AND ((Priority = '2') OR (Priority = '1') OR (Priority = '0')) AND ((ResolutionState = '0') OR (ResolutionState = '247') OR (ResolutionState = '248') OR (ResolutionState = '249') OR (ResolutionState = '250') OR (ResolutionState = '254') OR (ResolutionState = '255'))",
                    "displayColumns":
                    [
                        "severity","monitoringobjectdisplayname","name","age","repeatcount","lastModified"
                    ]
                }),
                success: function (result) {
                    for (var i = 0; i < result.rows.length; i++) {
            switch(result.rows[i].severity)
            {
                case "Error":
                    criticalCounter++;
                    break;
                case "Information":
                    informationCounter++;
                    break;
                case "Warning":
                                    warningCounter++
                    break;
            }
                    }
                    renderChart();
                }
            });
        }

        function renderChart() {
            var chart = new Highcharts.chart('container', {
    chart: {
        type: 'pie',
        options3d: {
            enabled: true,
            alpha: 45,
            beta: 0
        }
    },
    title: {
        text: 'Alerts share per severity'
    },
    tooltip: {
        pointFormat: '{series.name}: <b>{point.percentage:.1f}%</b>'
    },
    plotOptions: {
        pie: {
            allowPointSelect: true,
            cursor: 'pointer',
            depth: 35,
            dataLabels: {
                enabled: true,
                format: '{point.name}'
            }
        }
    },
    series: [{
        type: 'pie',
        name: 'Alerts share',
        data: [
            {
                name: 'Critical',
                y: 48,
                sliced: true,
                selected: true
            },
            ['Warning', 39],
            ['Information', 13],
        ]
    }]
});

            chart.render();
        }
    </script>
   <script src="https://code.highcharts.com/highcharts.js"></script>
<script src="https://code.highcharts.com/highcharts-3d.js"></script>
<script src="https://code.highcharts.com/modules/exporting.js"></script>

<div id="container" style="height: 400px"></div>
</head>

<body>
    <div id="chartContainer" style="height: 400px; width: 100%;"></div>
</body>

</html>
다음 HTML 코드는 경고 데이터를 사용하여 도넛형 차트를 렌더링하는 방법을 보여 줍니다.
<!DOCTYPE HTML>
<html>

<head>
    <script src="https://ajax.googleapis.com/ajax/libs/jquery/3.2.1/jquery.min.js"></script>
    <script type="text/javascript">
        var criticalCounter = 0;
        var informationCounter = 0;
        var warningCounter = 0;

        window.onload = function () {
            $.ajax({
                url: "/OperationsManager/data/alert",
                type: "POST",
                data: JSON.stringify({
                    "classId": null,
                    "objectIds": { "3c8ac4f3-475e-44dd-4163-8a97af363705": -1 },
                    "criteria": "((Severity = '0') OR (Severity = '1') OR (Severity = '2') OR (Severity = '3')) AND ((Priority = '2') OR (Priority = '1') OR (Priority = '0')) AND ((ResolutionState = '0') OR (ResolutionState = '247') OR (ResolutionState = '248') OR (ResolutionState = '249') OR (ResolutionState = '250') OR (ResolutionState = '254') OR (ResolutionState = '255'))",
                    "displayColumns":
                    [
                        "severity","monitoringobjectdisplayname","name","age","repeatcount","lastModified"
                    ]
                }),
                success: function (result) {
                    for (var i = 0; i < result.rows.length; i++) {
            switch(result.rows[i].severity)
            {
                case "Error":
                    criticalCounter++;
                    break;
                case "Information":
                    informationCounter++;
                    break;
                case "Warning":
                                    warningCounter++
                    break;
            }
                    }
                    renderChart();
                }
            });
        }

        function renderChart() {
            var chart = new CanvasJS.Chart("chartContainer",
                {
                    theme: "theme2",
animationEnabled: true,
                    title: {
                        text: "Alerts representation in doughnut"
                    },
                    data: [
                        {
                            type: "doughnut",
                indexLabelFontFamily: "Garamond",
                indexLabelFontSize: 20,
                startAngle:0,
                indexLabelFontColor: "dimgrey",
                indexLabelLineColor: "darkgrey",
                toolTipContent: "{y} %",
                            dataPoints: [
                                { y: criticalCounter, indexLabel: "Critical" },
                                { y: warningCounter, indexLabel: "Warning" },
                                { y: informationCounter, indexLabel: "Information" }
                            ]
                        }
                    ]
                });
            chart.render();
        }
    </script>
    <script src="https://cdnjs.cloudflare.com/ajax/libs/canvasjs/1.7.0/canvasjs.min.js"></script>
    <title>CanvasJS Example</title>
</head>

<body>
    <div id="chartContainer" style="height: 400px; width: 100%;"></div>
</body>

</html>
다음 HTML 코드는 경고 데이터를 사용하여 3D 도넛형 차트를 렌더링하는 방법을 보여 줍니다.
<!DOCTYPE HTML>
<html>

<head>
    <script src="https://ajax.googleapis.com/ajax/libs/jquery/3.2.1/jquery.min.js"></script>
    <script type="text/javascript">
        var criticalCounter = 0;
        var informationCounter = 0;
        var warningCounter = 0;

        window.onload = function () {
            $.ajax({
                url: "/OperationsManager/data/alert",
                type: "POST",
                data: JSON.stringify({
                    "classId": null,
                    "objectIds": { "3c8ac4f3-475e-44dd-4163-8a97af363705": -1 },
                    "criteria": "((Severity = '0') OR (Severity = '1') OR (Severity = '2') OR (Severity = '3')) AND ((Priority = '2') OR (Priority = '1') OR (Priority = '0')) AND ((ResolutionState = '0') OR (ResolutionState = '247') OR (ResolutionState = '248') OR (ResolutionState = '249') OR (ResolutionState = '250') OR (ResolutionState = '254') OR (ResolutionState = '255'))",
                    "displayColumns":
                    [
                        "severity","monitoringobjectdisplayname","name","age","repeatcount","lastModified"
                    ]
                }),
                success: function (result) {
                    for (var i = 0; i < result.rows.length; i++) {
            switch(result.rows[i].severity)
            {
                case "Error":
                    criticalCounter++;
                    break;
                case "Information":
                    informationCounter++;
                    break;
                case "Warning":
                                    warningCounter++
                    break;
            }
                    }
                    renderChart();
                }
            });
        }

        function renderChart() {
            var chart = Highcharts.chart('container', {
    chart: {
        type: 'pie',
        options3d: {
            enabled: true,
            alpha: 45
        }
    },
    title: {
        text: 'Alerts representation in 3D donut'
    },
    subtitle: {
        text: ''
    },
    plotOptions: {
        pie: {
            innerSize: 100,
            depth: 45
        }
    },
    series: [{
        name: 'Number of alerts',
        data: [
        ['Critical', criticalCounter],
                                ['Warning', warningCounter ],
                                ['Information',  informationCounter]

        ]
    }]
});
            chart.render();
        }
    </script>
    <script src="https://code.highcharts.com/highcharts.js"></script>
<script src="https://code.highcharts.com/highcharts-3d.js"></script>
<script src="https://code.highcharts.com/modules/exporting.js"></script>

<div id="container" style="height: 400px">
</div>
</head>

<body>
    <div id="chartContainer" style="height: 400px; width: 100%;"></div>
</body>

</html>
다음 HTML 코드는 원형 및 스플라인 차트에 경고를 표시하는 조합 차트를 만드는 방법을 보여 줍니다.
<!DOCTYPE HTML>
<html>

<head>
    <script src="https://ajax.googleapis.com/ajax/libs/jquery/3.2.1/jquery.min.js"></script>
    <script type="text/javascript">
        var criticalCounter = 0;
        var informationCounter = 0;
        var warningCounter = 0;
var totalCounter =0;

        window.onload = function () {
            $.ajax({
                url: "/OperationsManager/data/alert",
                type: "POST",
                data: JSON.stringify({
                    "classId": null,
                    "objectIds": { "3c8ac4f3-475e-44dd-4163-8a97af363705": -1 },
                    "criteria": "((Severity = '0') OR (Severity = '1') OR (Severity = '2') OR (Severity = '3')) AND ((Priority = '2') OR (Priority = '1') OR (Priority = '0')) AND ((ResolutionState = '0') OR (ResolutionState = '247') OR (ResolutionState = '248') OR (ResolutionState = '249') OR (ResolutionState = '250') OR (ResolutionState = '254') OR (ResolutionState = '255'))",
                    "displayColumns":
                    [
                        "severity","monitoringobjectdisplayname","name","age","repeatcount","lastModified"
                    ]
                }),
                success: function (result) {
                    for (var i = 0; i < result.rows.length; i++) {
            switch(result.rows[i].severity)
            {
                case "Error":
                    criticalCounter++;
                    break;
                case "Information":
                    informationCounter++;
                    break;
                case "Warning":
                                    warningCounter++
                    break;
            }
                    }
                    renderChart();
                }
            });
        }

        function renderChart() {
            var chart = new Highcharts.chart('container', {
    title: {
        text: 'Alerts representation in combination chart'
    },
    xAxis: {
        categories: ['Critical', 'Warning', 'Information']
    },
    labels: {
        items: [{
            html: 'Total alerts generated',
            style: {
                left: '50px',
                top: '0px',
                color: (Highcharts.theme && Highcharts.theme.textColor) || 'black'
            }
        }]
    },
    series: [{
        type: 'column',
        name: 'Critical',
        data: [criticalCounter, 0, 0]
    }, {
        type: 'column',
        name: 'Warning',
        data: [0, warningCounter, 0]
    }, {
        type: 'column',
        name: 'Information',
        data: [0, 0, informationCounter]
    }, {
        type: 'spline',
        name: 'Spline chart',
        data: [criticalCounter, warningCounter, informationCounter],
        marker: {
            lineWidth: 2,
            lineColor: Highcharts.getOptions().colors[3],
            fillColor: 'white'
        }
    }, {
        type: 'pie',
        name: 'Total consumption',
        data: [{
            name: 'Critical',
            y: criticalCounter,
            color: Highcharts.getOptions().colors[0] // Jane's color
        }, {
            name: 'Warning',
            y: warningCounter,
            color: Highcharts.getOptions().colors[1] // John's color
        }, {
            name: 'Information',
            y: informationCounter,
            color: Highcharts.getOptions().colors[2] // Joe's color
        }],
        center: [150, 100],
        size: 100,
        showInLegend: false,
        dataLabels: {
            enabled: false
        }
    }]
});


            chart.render();
        }
    </script>
    <script src="https://code.highcharts.com/highcharts.js"></script>
<script src="https://code.highcharts.com/modules/exporting.js"></script>

<div id="container" style="min-width: 310px; height: 400px; margin: 0 auto"></div>

</head>

<body>
    <div id="chartContainer" style="height: 400px; width: 100%;"></div>
</body>

</html>
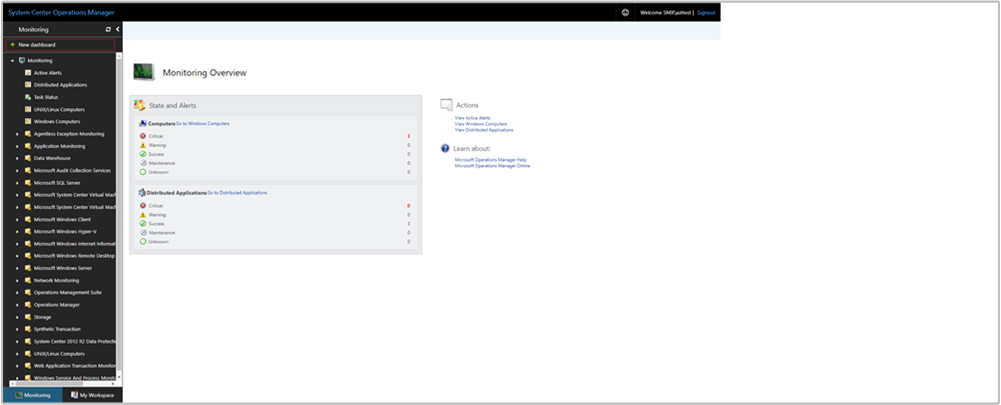
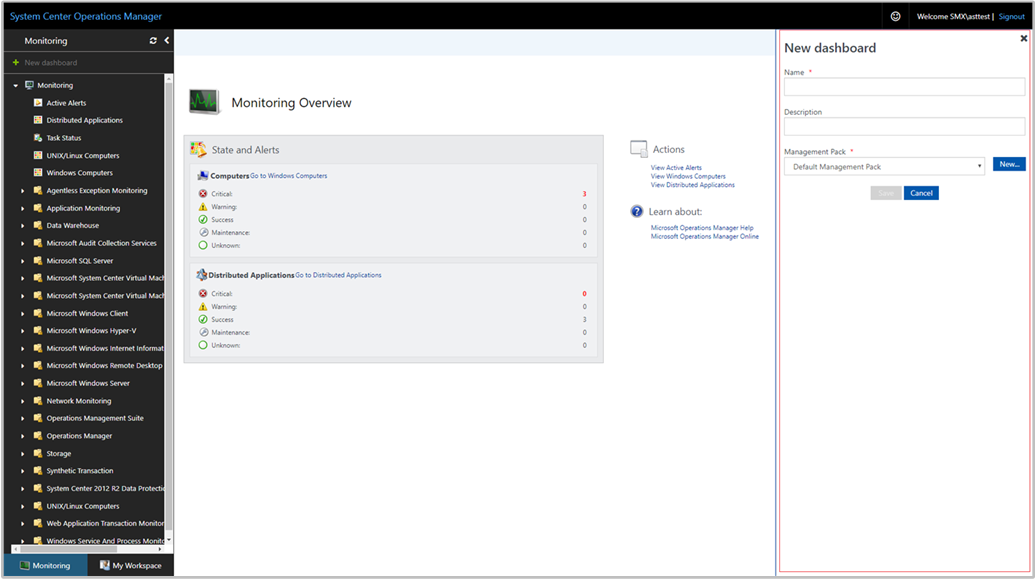
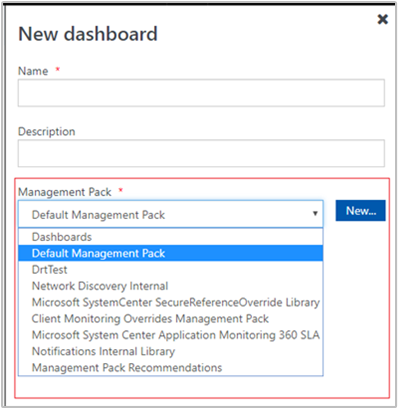
위젯이 만들어지면 HTML 코드의 출력이 표시됩니다.