Notiz
Zougrëff op dës Säit erfuerdert Autorisatioun. Dir kënnt probéieren, Iech unzemellen oder Verzeechnesser ze änneren.
Zougrëff op dës Säit erfuerdert Autorisatioun. Dir kënnt probéieren, Verzeechnesser ze änneren.
The Microsoft Fabric Monitor feature opens the monitoring hub, which provides a centralized view of job execution health, progress, and outcomes. You can quickly identify problems and take action. Use the monitoring hub to answer these questions:
- What is the current status of a job—running, succeeded, or failed?
- Where did it fail, and what error details are available?
- Has this job failed before in the last 30 days?
- Which scheduled items have failure notifications configured?
Any Fabric user can open the monitoring hub, but you only see activities for Fabric items you have permission to view.

Key features
The monitoring hub provides the following features to help you track and investigate your Fabric activities:
Current run status: Open the monitoring hub to track active and recently completed jobs from one place.
Historical runs: View activity history to investigate failures, compare performance over time, and validate reruns.
Activity details and diagnostics: View details to inspect status, timing, and error details for faster troubleshooting.
Activity filtering and search: Use search and filtering to narrow the list to the activities and run windows pertaining to your investigation.
Schedule failure notifications: View and manage failure notifications for scheduled items from a centralized location.
Item types: The Activities page displays activities for these Fabric items:
- Copy Job
- Dataflow Gen2
- Dataflow Gen2 CI/CD
- Datamart
- Data Build Tool (dbt) Job
- Digital Twin Builder Flow
- Experiment
- Graph model
- Lakehouse
- Map
- Notebook
- Pipeline
- Semantic model
- Snowflake database
- Spark job definition
- User data function
Note
For Spark Notebook jobs with jobType "NotebookInteractiveRun," all terminated notebooks display as "Stopped" in the monitoring hub. This temporary UI-only change has the following limitations:
- You can't filter by the "Stopped" status.
- Status might be inconsistent between the monitoring hub table, the Public Job Status API, and job events.
Open the monitoring hub
To open the monitoring hub in Fabric, select Monitor from the navigation pane. The monitoring hub has two pages:
- Activities — Track active and recently completed jobs across your workspaces.
- Schedule failures (Preview) — View and manage failure notifications for scheduled items. For more information, see Schedule failures (Preview).
The Activities page displays up to 100 Fabric activities from the past 30 days, ordered by start time with the newest activities at the top. The table shows up to 100 activities per Fabric item.
If you have the appropriate permissions for a Fabric item, you can perform certain actions directly from the monitoring hub. The available actions depend on the item type.
Get activity details
On the Activities page, the details pane provides information about an activity, such as its status, start time, duration, and error details. To open the details pane for an activity, point to the activity name and select the View details symbol (i).
View activity history
The main Activities page displays only the 100 most recent activities from the past 30 days, so frequently run jobs might not show all executions. However, you can view the complete 30-day history for a specific activity by using the Historical runs option.
To access the full 30-day history for an activity, point to the activity name, select More options (...), and then select Historical runs. The table displays up to 30 days of historical information for that activity. To return to the main display, select Back to main view.

Change columns and display order
On the Activities page, use the following controls to find Fabric activities and items or change how they're displayed in the monitoring hub or historical table:
- Sort - Select a column header to change the sort order. The arrow next to the column header indicates the sorting order.
- Change the columns displayed - Use the Column Options button to add, remove, or rearrange columns by dragging them to a different position in the list.
Search and filter
To find specific activities or items in the monitoring hub, use the following search and filter options:
Keyword search - Use the Filter by keyword search box to quickly find activities or items by name or keyword. The search queries only the loaded data, not all the activities in the database.
Filter - Use Filter to narrow results by properties like status, start time, and owner. For example, to find failed jobs in a specific workspace from the last 24 hours, select
Status = Failed,Location = <workspace>, andStart time = Last 24 hours. The monitoring hub remembers your filter selection for the next time you access the hub. Use the following filter options to customize the displayed results (filter options vary by item type):Status - Select the type of status you want the table to display.
Note
Each Fabric item has a unique set of operations and statuses. To display consistent results, the monitoring hub might show a simplified version of an item's status. You can find the exact status of an item in the details panel.
Item type - Select the Fabric item types you want the table to display.
Start time - Select the time period for the table to display. You can select a predetermined period, or use Customize to personalize the time period.
Submitted by - Select the owner of the Fabric item that the table displays activities for.
Location - Select which workspaces to view item activities from.
Limitations
Dataflow Gen1 isn't supported and isn't displayed in the table.
Schedule failures (Preview)
Important
This feature is currently in preview. Preview features may change before general availability.
The Schedule failures page lets you view and manage failure notifications for scheduled items from a centralized location. Instead of configuring notifications item by item through the job scheduler, you can use this page to see all items with failure notifications, configure new ones, and edit or remove existing configurations.
Notifications configured on the Schedule failures page and in the job scheduler are the same underlying configuration. Changes made in either location are reflected in both.
To open the Schedule failures page, under Configure notifications in the side panel, select Schedule failures.

Configure new failure notifications
To set up failure notifications for a scheduled item:
On the Schedule failures page, select + Configure notifications.
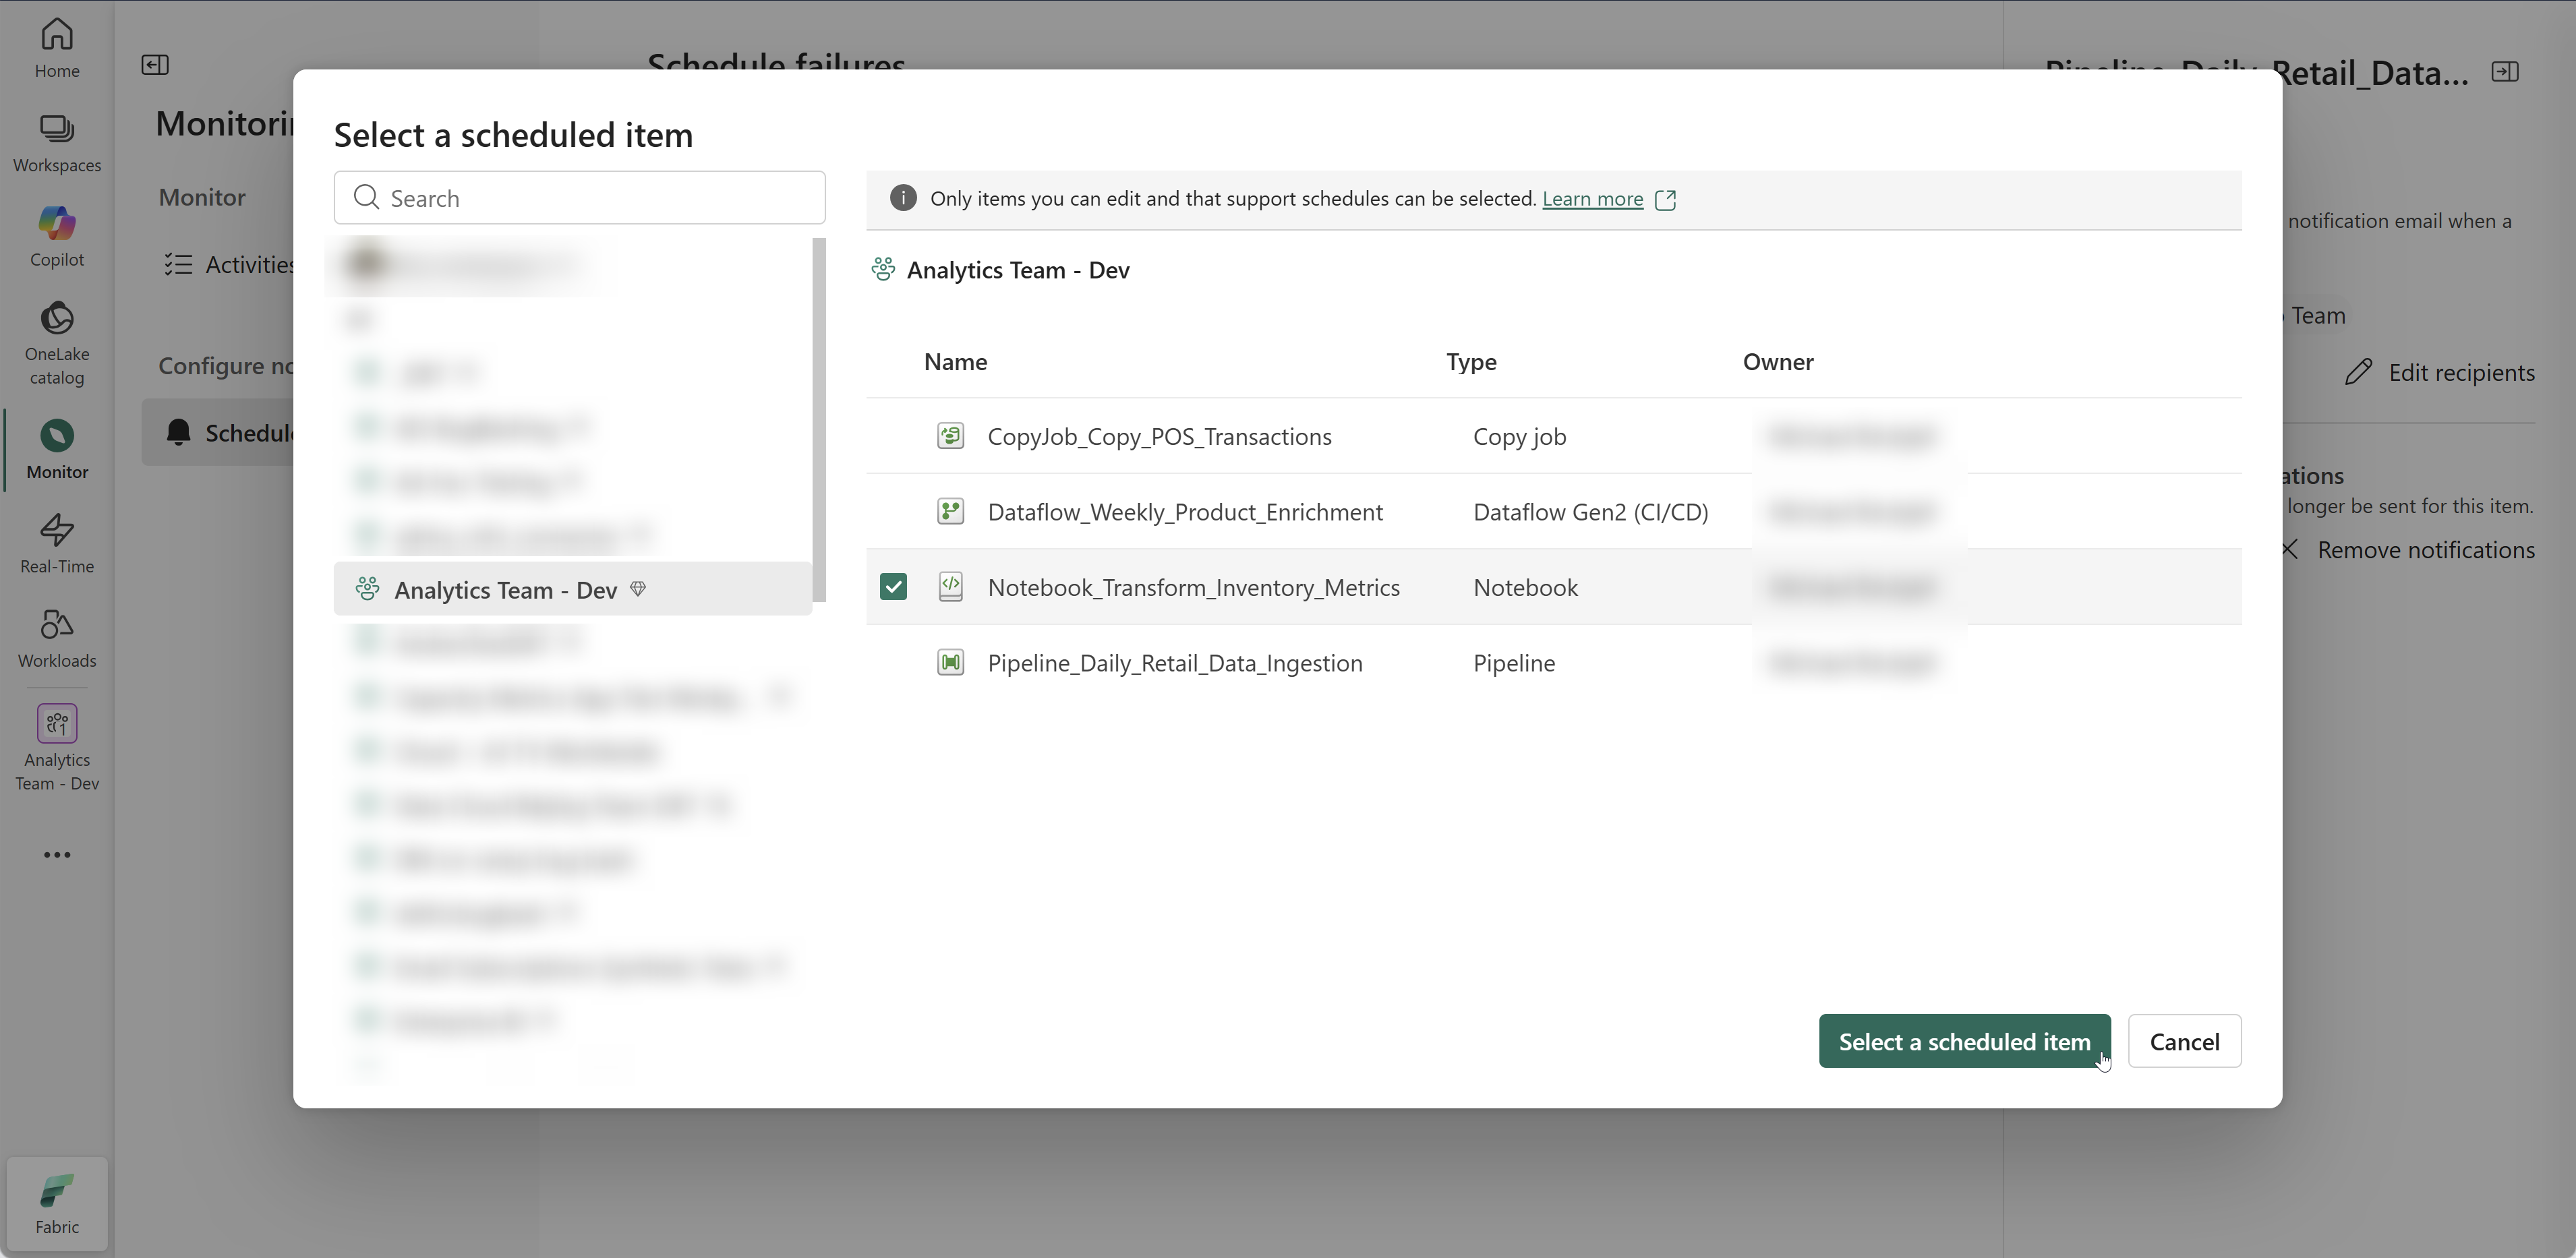
Select an item that supports schedules from the list.
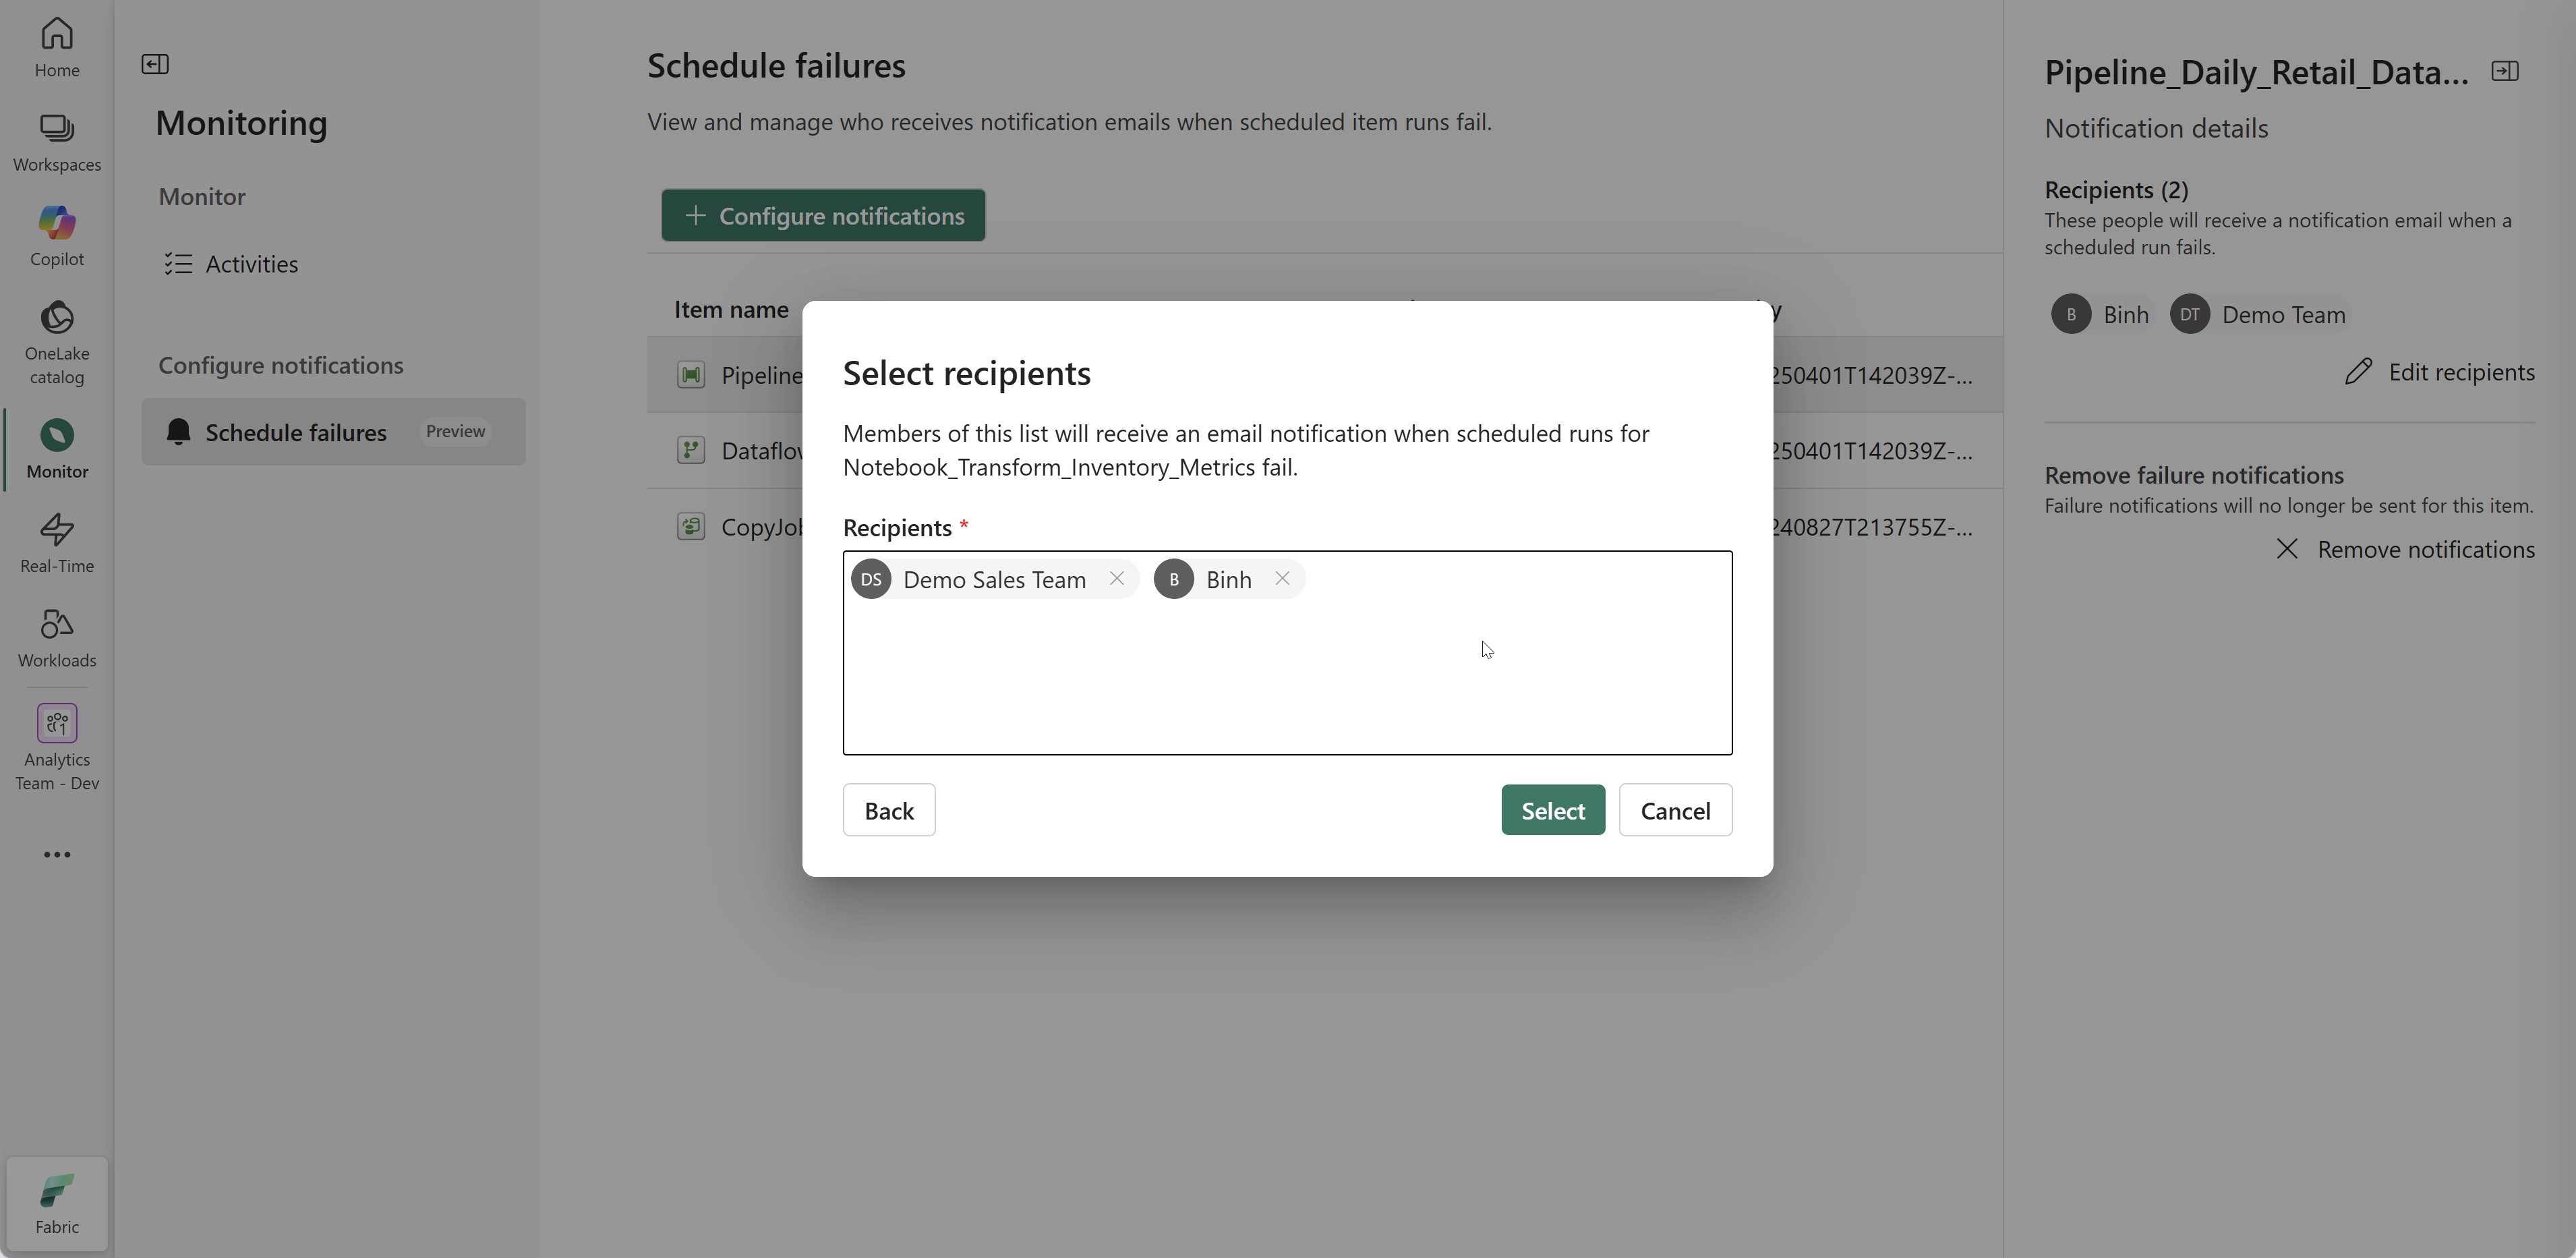
Enter the recipients who should receive an email when a scheduled run of the item fails. Recipients can be users or groups in your Microsoft Entra tenant, including B2B guest users. Direct external email addresses aren't supported.
Select Save.


Edit or remove failure notifications
To edit recipients or remove failure notifications for an item:
On the Schedule failures page, select an item from the table.
The Notification details pane opens on the right, showing the current recipients.
To edit recipients, select Edit recipients, make your changes, and save.
To stop receiving failure notifications for this item entirely, select Remove notifications.
Permissions
- Visibility — You can see failure notifications for any scheduled item you have permission to view. For supported item types, see Limitations.
- Editing — To configure new failure notifications, edit recipients, or remove notifications for an item, you must have at least the Contributor role in the workspace, or Write permission on the item. For more information, see Roles in workspaces.
Limitations
- Semantic models aren't yet supported on the Schedule failures page. All other item types visible on the Activities page are supported.
- Failure notifications apply only to scheduled runs. Manually triggered runs or runs initiated through other means don't trigger notifications.
- Notifications are sent in the display language of the recipient's Fabric account. English is used as a fallback.
For details about what the notification email includes, see Notification content.
Note
You can also configure failure notifications per item in the job scheduler pane. For more information, see Receive notifications for failed scheduled jobs.