Note
Access to this page requires authorization. You can try signing in or changing directories.
Access to this page requires authorization. You can try changing directories.
The Console Utilities API contains a collection of convenience variables and functions for performing common tasks, such as:
- Selecting and inspecting DOM elements.
- Displaying data in a readable format.
- Stopping and starting the profiler.
- Monitoring DOM events.
These variables and functions only work by entering them directly into the DevTools Console; you can't use the variables and call the functions from scripts.
Summary
| Variable or function | Description |
|---|---|
| Recently evaluated expression: $_ | Returns the value of the most recently evaluated expression. |
| Recently selected element or JavaScript object: $0-$4 | Returns a recently selected element or JavaScript object. |
| Query selector: $(selector) | Query selector; returns the reference to the first DOM element with the specified CSS selector, like document.querySelector(). |
| Query selector all: $$(selector, [startNode]) | Query selector all; returns an array of elements that match the specified CSS selector, like document.querySelectorAll(). |
| XPath: $x(path, [startNode]) | Returns an array of DOM elements that match the specified XPath expression. |
| clear() | Clears the console of its history. |
| copy(object) | Copies a string representation of the specified object to the clipboard. |
| debug(function) | When the specified function is called, the debugger is invoked and breaks inside the function on the Sources panel. |
| dir(object) | Displays an object-style listing of all of the properties for the specified object, like console.dir(). |
| dirxml(object) | Prints an XML representation of the specified object, as displayed in the Elements tool, like console.dirxml(). |
| inspect(object/function) | Opens and selects the specified DOM element in the Elements tool, or the specified JavaScript heap object in the Memory tool. |
| getEventListeners(object) | Returns the event listeners that are registered on the specified object. |
| keys(object) | Returns an array containing the names of the properties belonging to the specified object. |
| monitor(function) | Logs a message to the console that indicates the function name, along with the arguments passed to the function as part of a request. |
| monitorEvents(object[, events]) | When one of the specified events occurs on the specified object, the event object is logged to the console. |
| profile([name]) | Starts a JavaScript CPU profiling session with an optional name. |
| profileEnd([name]) | Completes a JavaScript CPU profiling session and displays the results in the Performance tool. |
| queryObjects(constructor) | Returns an array of the objects that were created by the specified constructor. |
| table(data[, columns]) | Logs object data, formatted as a table with column headings, for the specified data object. |
| undebug(function) | Stops the debug of the specified function, so that when the function is requested, the debugger is no longer invoked. |
| unmonitor(function) | Stops the monitoring of the specified function. |
| unmonitorEvents(object[, events]) | Stops monitoring events for the specified object and events. |
| values(object) | Returns an array containing the values of all properties belonging to the specified object. |
Recently evaluated expression: $_
$_ returns the value of the most recently evaluated expression.
Syntax:
$_
Example 1
Press Ctrl+Shift+J (Windows, Linux) or Command+Option+J (macOS). The Console tool opens in DevTools, next to the webpage.
In the Console tool, type the expression
2+2, and then press Enter.The expression is evaluated, and the result is shown. The
$_variable is also set to the result of the expression.Type
$_, and then press Enter: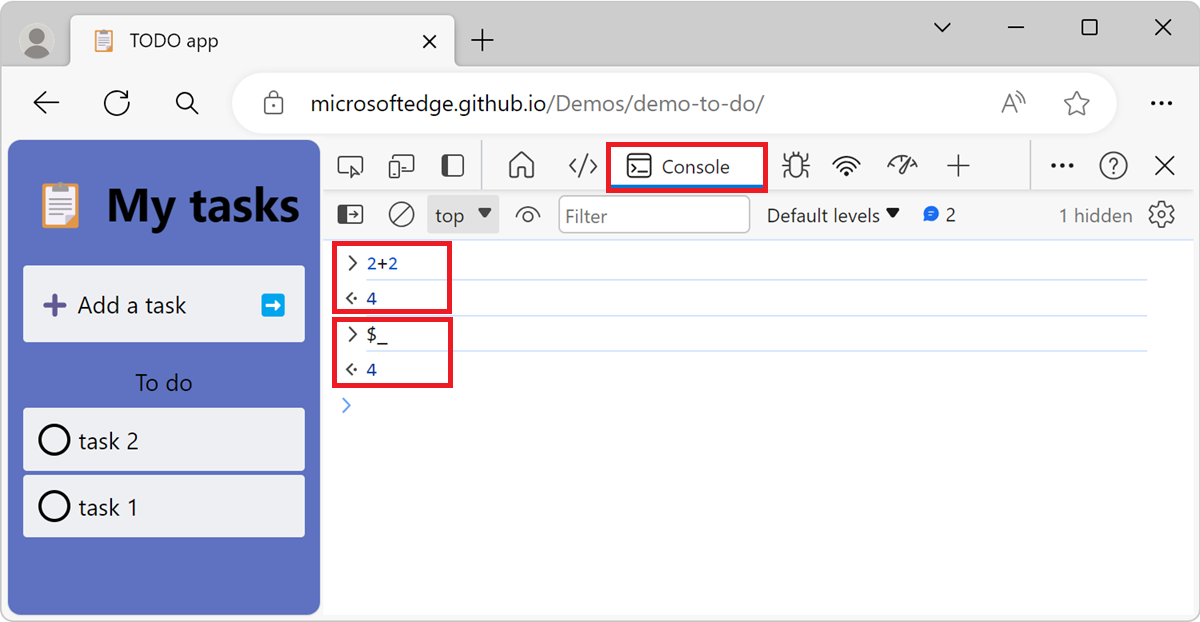
Example 2
Press Ctrl+Shift+J (Windows, Linux) or Command+Option+J (macOS). The Console tool opens in DevTools, next to the webpage.
Paste the following code into the Console, and then press Enter:
["john", "paul", "george", "ringo"]The evaluated expression is an array of names.
Type the following code into the Console, and then press Enter:
$_.lengthThe expression
$_.lengthis evaluated and4is shown in the Console because$_refers to the previously evaluated expression, which is the array of names.$_.lengthis the length of the array of names.Type the following code into the Console, and then press Enter:
$_$_always refers to the previously evaluated expression, which is now the number 4.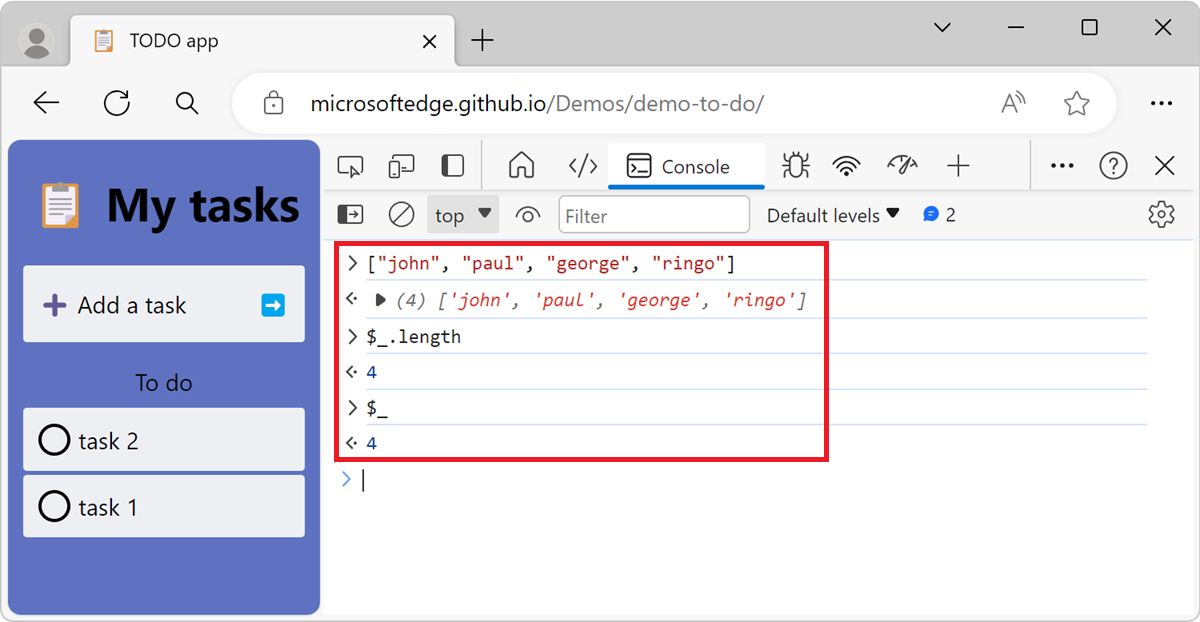
Recently selected element or JavaScript object: $0-$4
$0, $1, $2, $3, and $4 return recently selected elements or JavaScript objects.
$0 returns the most recently selected element or JavaScript object, $1 returns the second most recently selected one, and so on. The $0, $1, $2, $3, and $4 variables work as a historical reference to the last five DOM elements that were inspected within the Elements tool, or the last five JavaScript heap objects that were selected in the Memory tool.
Syntax
$0
Example
To open DevTools, right-click the webpage, and then select Inspect. Or, press Ctrl+Shift+I (Windows, Linux) or Command+Option+I (macOS). DevTools opens.
In the Elements tool, select an element, for example an
<input>element.Open the Console tool in the Quick View panel, at the bottom of DevTools.
Type
$0in the Console tool, and then press Enter.The
$0variable returns the selected<input>element: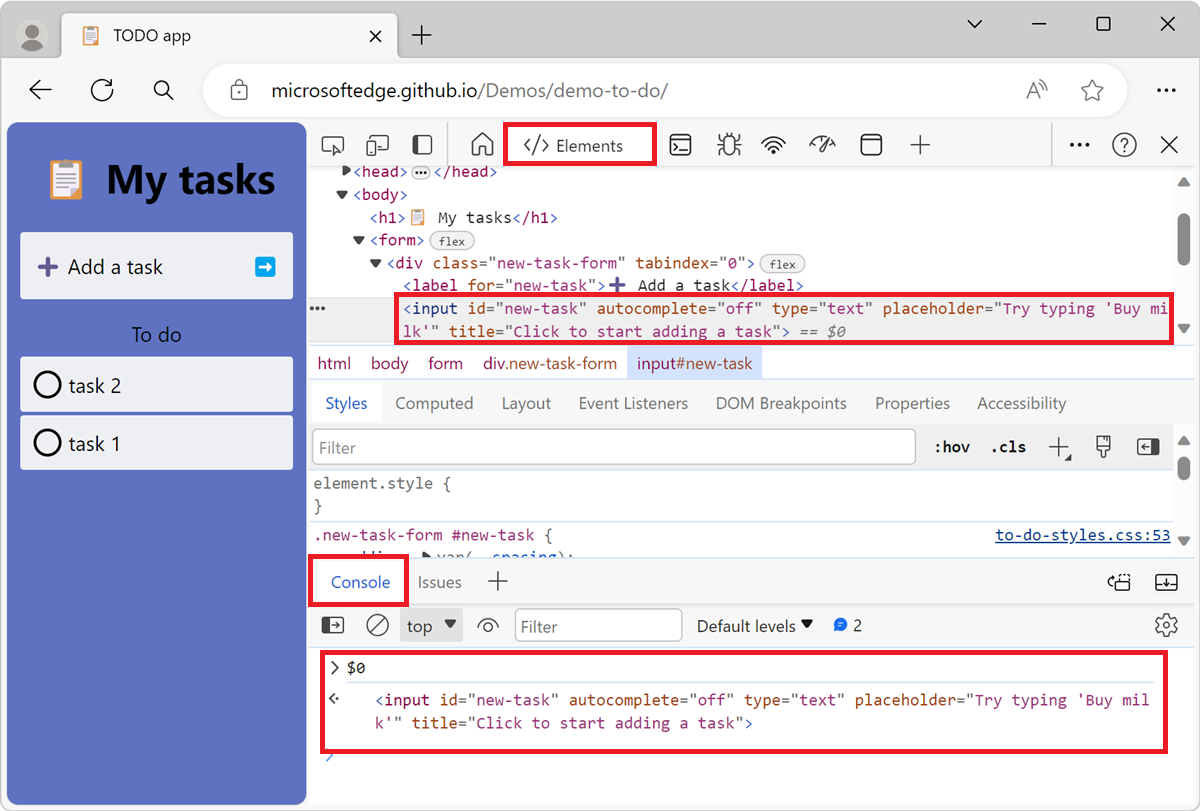
Select a different element in the Elements tool, for example a
<div>element.In the Console tool, type
$0, and then press Enter.$0refers to the newly selected element, which is the<div>element.Type
$1, and then press Enter.$1refers to the previously selected element, which is the<input>element: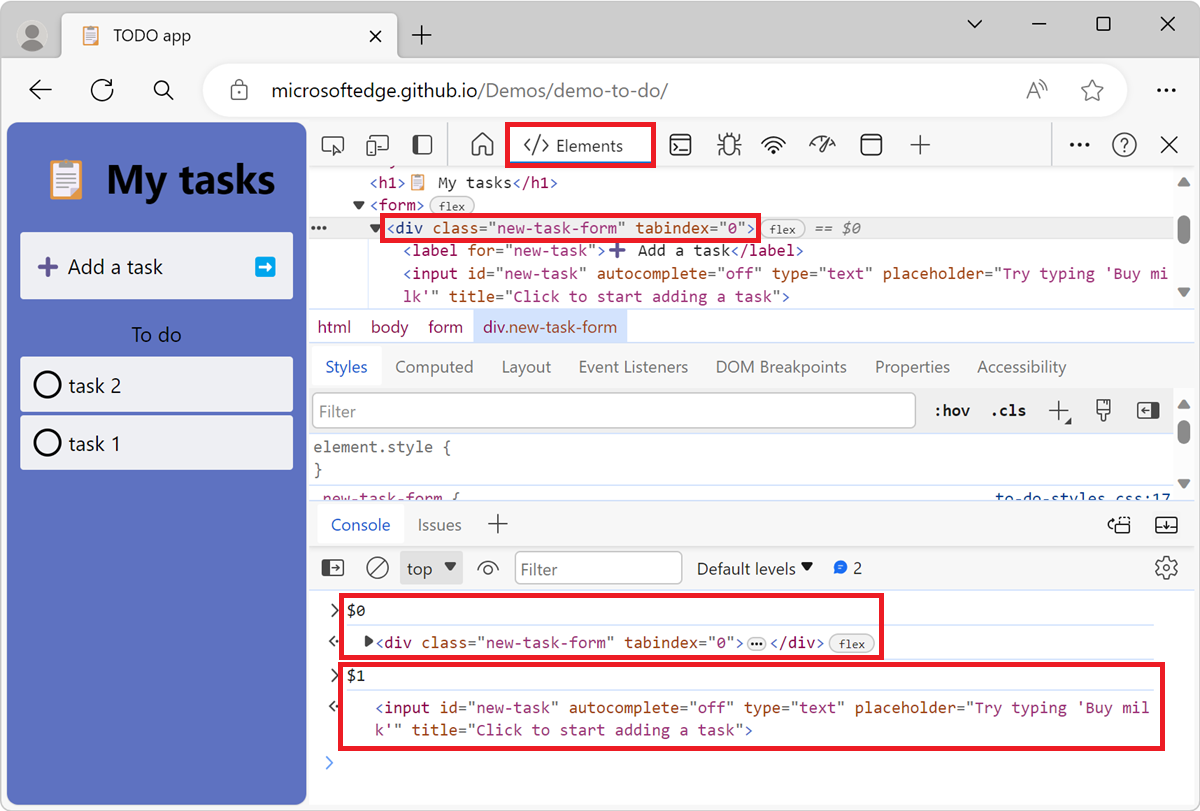
Query selector: $(selector)
$(selector) returns the reference to the first DOM element that matches the specified CSS selector selector.
This function is similar to the document.querySelector() function.
If you are using a library such as jQuery that uses $, the functionality is overwritten, and $ corresponds to the implementation from that library.
Syntax
$(selector, [parentElement])
Example 1
Press Ctrl+Shift+J (Windows, Linux) or Command+Option+J (macOS). The Console tool opens in DevTools, next to the webpage.
In the Console tool, type
$('input'). The first element that matches theinputCSS selector is displayed: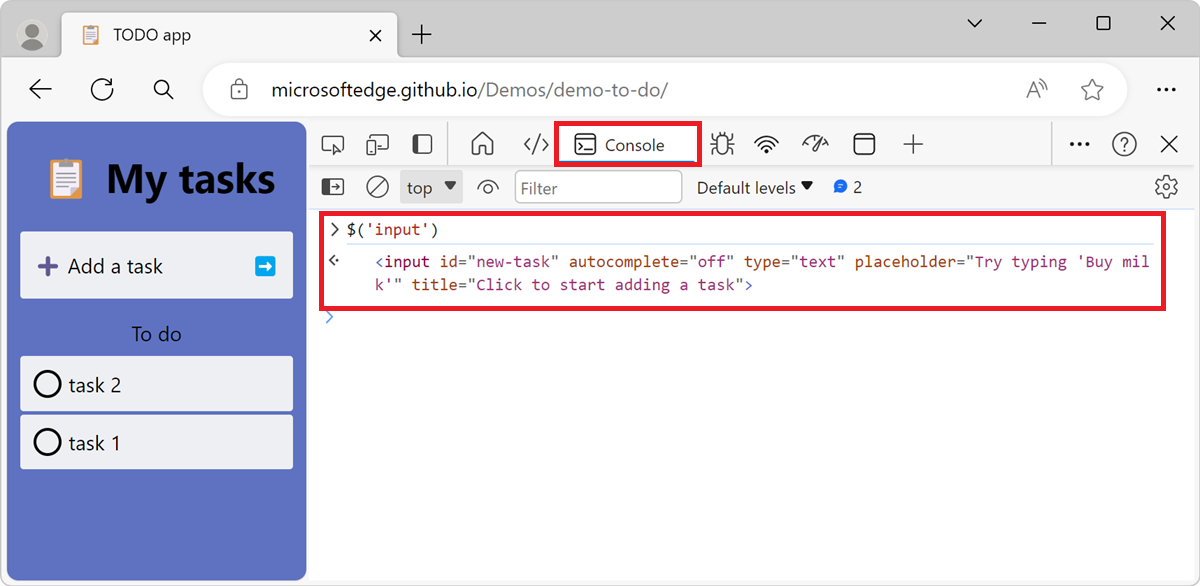
Right-click the returned result and then select Reveal in Elements Panel to find it in the DOM, or Scroll in to View to show it on the page.
Example 2
The $() function accepts a second parameter, parentElement, that specifies a parent element which to search in. The default value of the parameter is document, which means that the entire webpage is searched by default. By specifying a parent element, you can search for elements within a specific part of the webpage.
Press Ctrl+Shift+J (Windows, Linux) or Command+Option+J (macOS). The Console tool opens in DevTools, next to the webpage.
In the Console tool, type
$('input', $('ul'))The first element that matches the
inputCSS selector found within the firstulelement is retruned: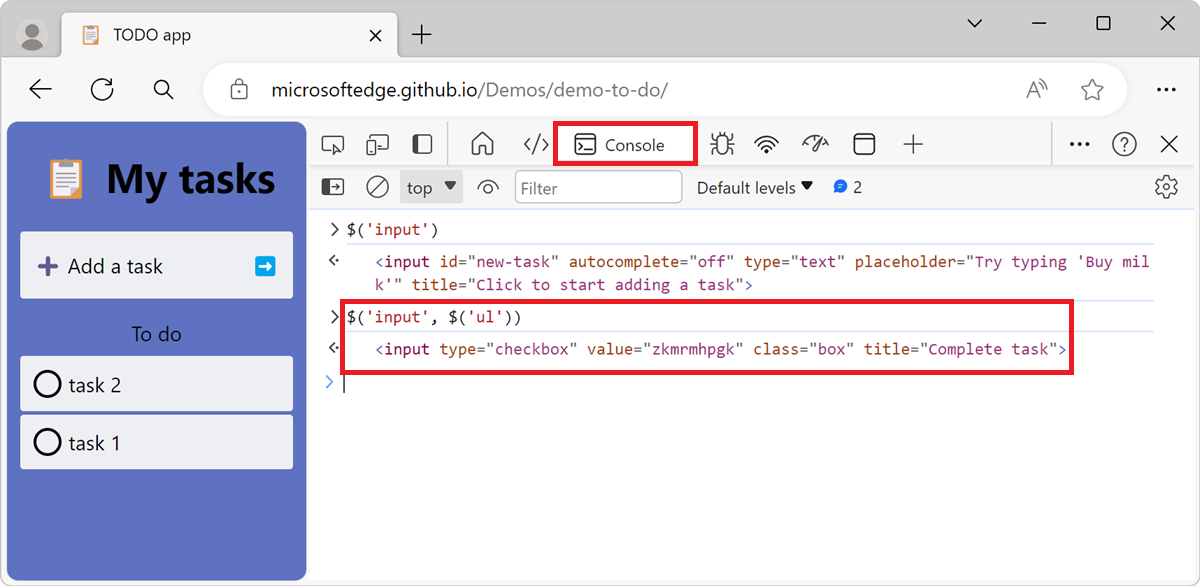
Query selector all: $$(selector, [startNode])
$$() returns a list of elements that match the specified CSS selector, like document.querySelectorAll().
This function is similar to document.querySelectorAll() but returns an array of element, instead of a NodeList.
Syntax
$$(selector, [parentElement])
Example 1
Press Ctrl+Shift+J (Windows, Linux) or Command+Option+J (macOS). The Console tool opens in DevTools, next to the webpage.
In the Console tool, type
$$('button'). All the<button>elements in the webpage are displayed: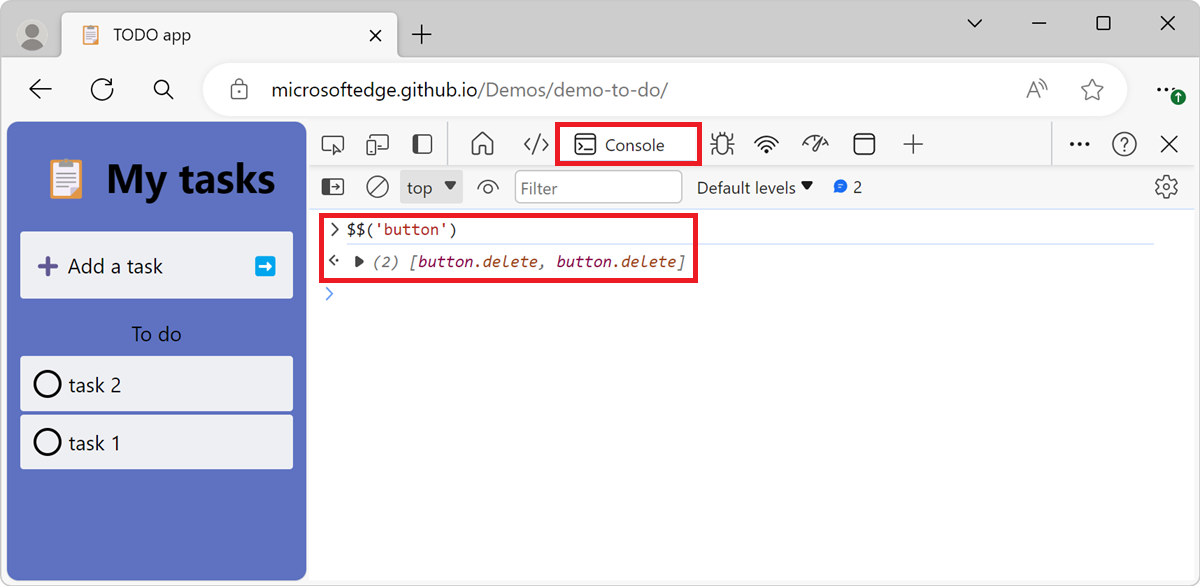
Example 2
This $$() function also supports a second parameter, parentElement, that specifies a parent element which to search in. The default value of the parameter is document, which means that the entire webpage is searched by default. By specifying a parent element, you can search for elements within a specific part of the webpage.
Press Ctrl+Shift+J (Windows, Linux) or Command+Option+J (macOS). The Console tool opens in DevTools, next to the webpage.
In the Console tool, type
$$('button', $('li.task')). All the<button>elements that are descendants of the first<li class="task">element are displayed: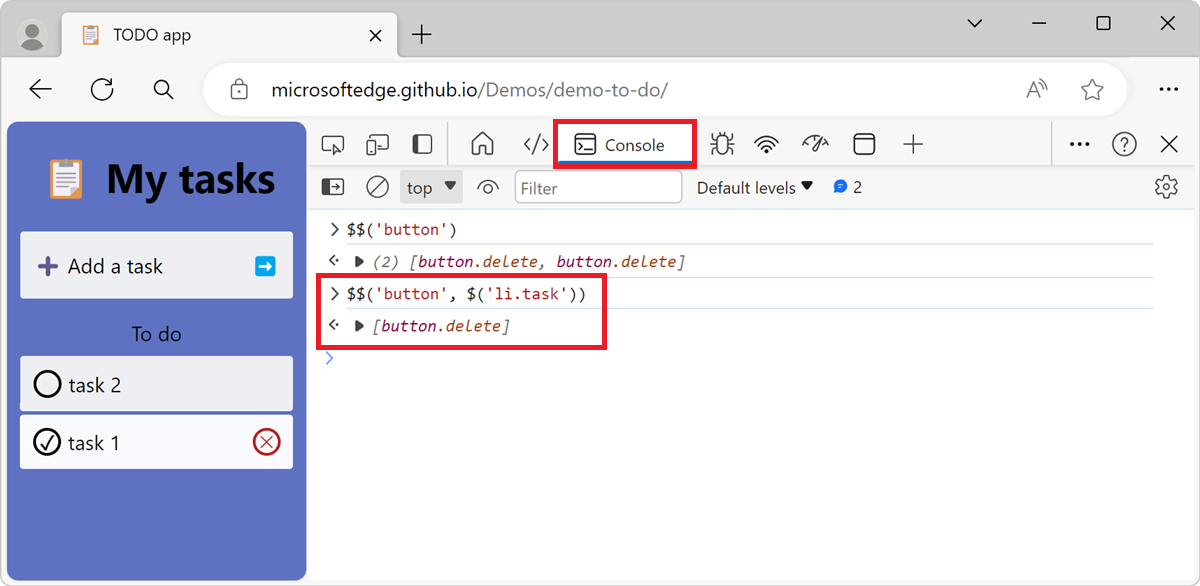
XPath: $x(path, [startNode])
$x(path) returns an array of DOM elements that match the specified XPath expression path.
Syntax
$x(path, [parentElement])
Example 1
Press Ctrl+Shift+J (Windows, Linux) or Command+Option+J (macOS). The Console tool opens in DevTools, next to the webpage.
In the Console tool, type
$x("//li"). All the<li>elements in the webpage are displayed: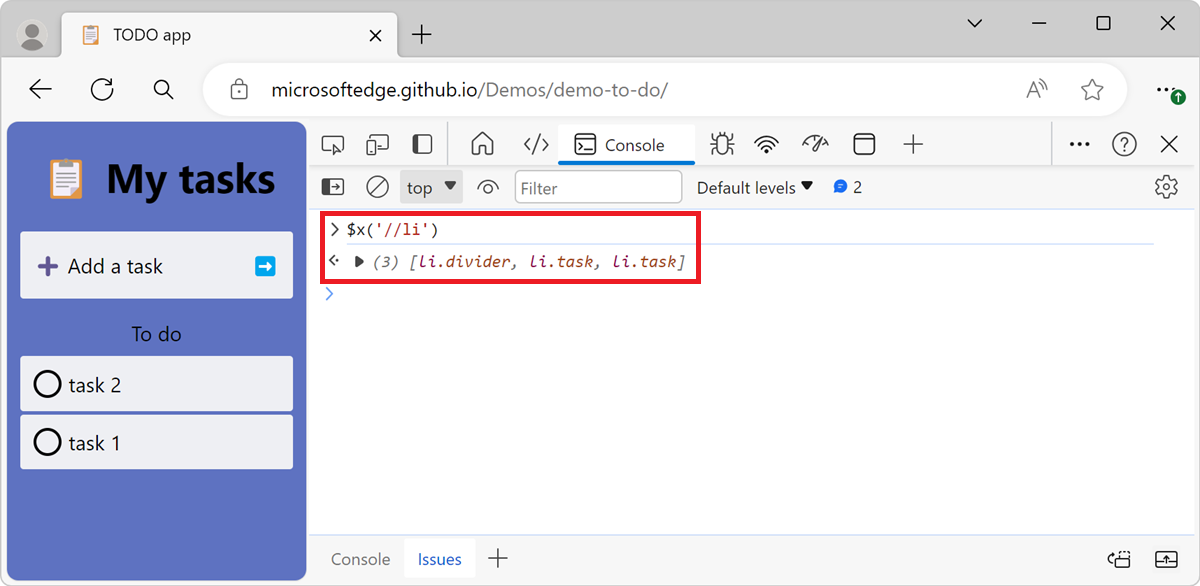
Example 2
Press Ctrl+Shift+J (Windows, Linux) or Command+Option+J (macOS). The Console tool opens in DevTools, next to the webpage.
In the Console tool, type
$x("//li[button]"). All the<li>elements that contain<button>elements are displayed: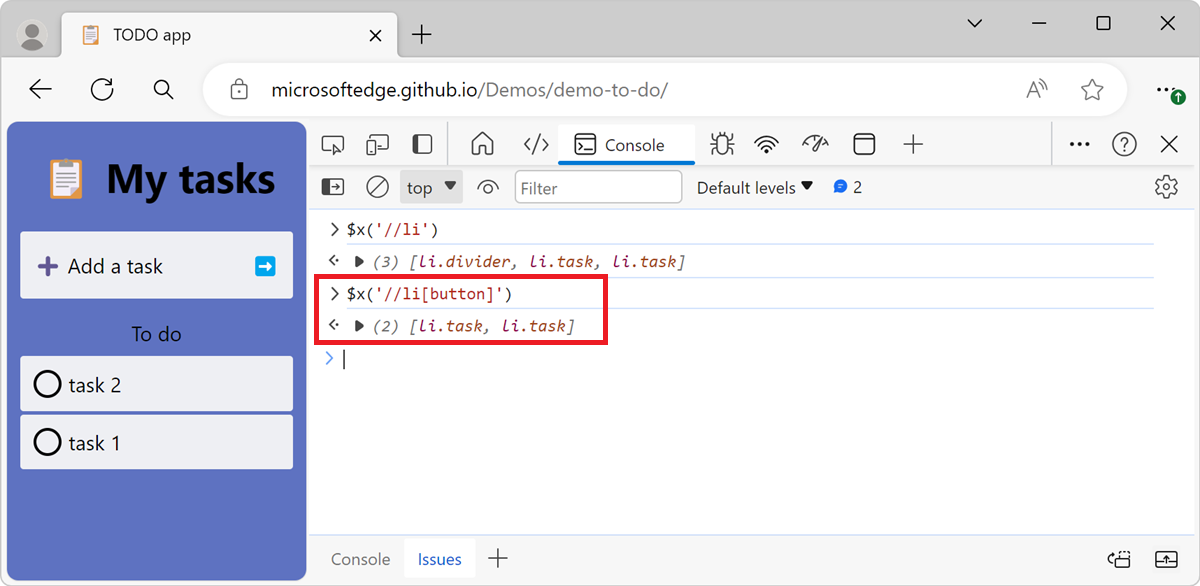
Similar to the other selector commands, $x(path) has an optional second parameter, parentElement, that specifies an element or node in which to search for elements.
clear()
clear() clears the console of its history.
Syntax
clear()
Example
Press Ctrl+Shift+J (Windows, Linux) or Command+Option+J (macOS). The Console tool opens in DevTools, next to the webpage.
To create history in the Console tool, enter multiple JavaScript expressions. For example:
for (let i = 0; i < 10; i++) {
    console.log(i);
}
To clear the history, type
clear()in the Console tool, and then press Enter: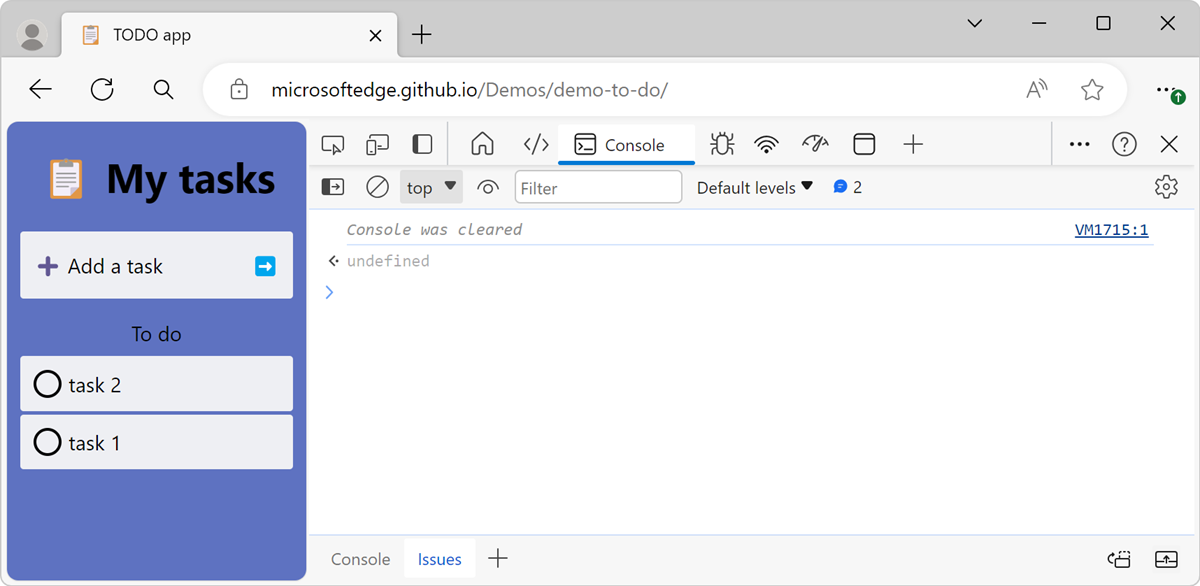
copy(object)
copy(object) copies a string representation of the specified object to the clipboard.
Syntax
copy(object)
Example
Press Ctrl+Shift+J (Windows, Linux) or Command+Option+J (macOS). The Console tool opens in DevTools, next to the webpage.
Enter the following code in the Console tool, and then press Enter:
copy($$('*').map(element => element.tagName));The code snippet selects all elements in the webpage by using the
$$(selector)function, and then maps thetagNameproperty of each element to an array. The array is then copied to the clipboard by using thecopy()function.Paste the contents of the clipboard into a text editor. The contents of the clipboard is a list of all the HTML tags in the webpage, for example:
["HTML", "HEAD", "META", "TITLE", "LINK", "BODY", "H1", "FORM", "DIV", "LABEL", ...]
debug(function)
debug(function) pauses inside the specified function function in the Sources tool, when that function is called.
After the debugger is paused, you can then step through the code and debug it.
Syntax
debug(function)
Example
Open a new tab or window, and then go to a page that contains a JavaScript function you want to debug. For example, go to the TODO app demo page.
Press Ctrl+Shift+J (Windows, Linux) or Command+Option+J (macOS). The Console tool opens in DevTools, next to the webpage.
In the Console tool, type
debug(updateList).In the rendered webpage, add a new TODO item to the list by typing test in the Add a task text field and then pressing Enter.
The debugger pauses inside the
updateList()function in the Sources tool: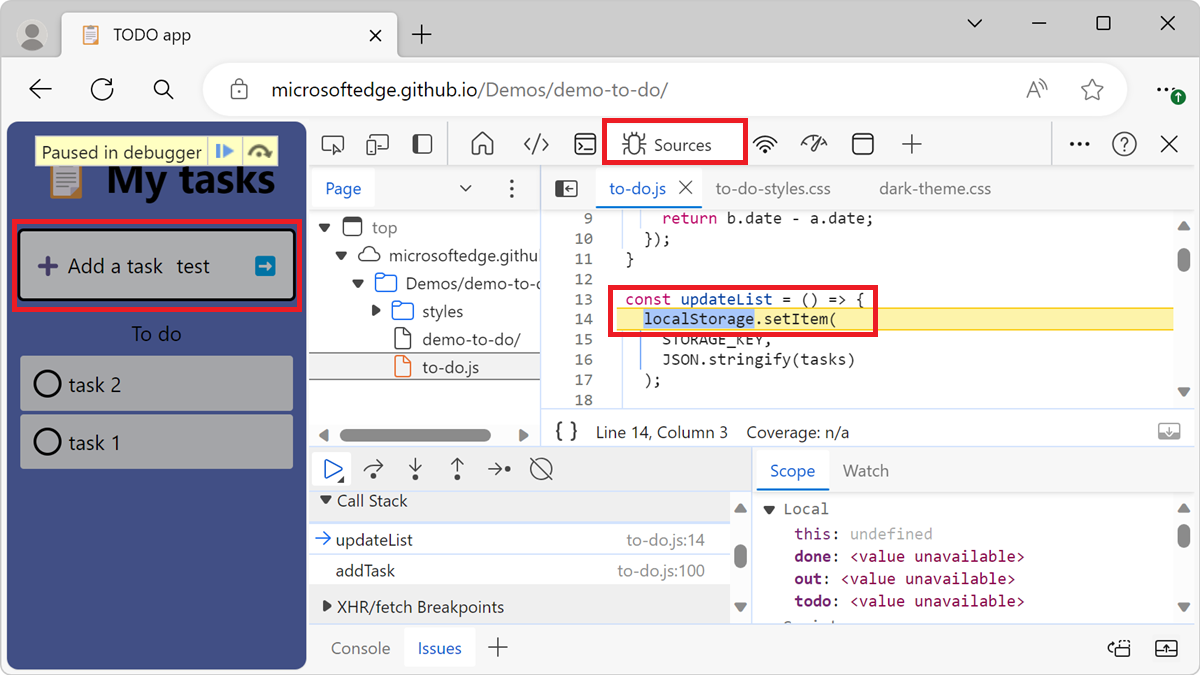
Use undebug(function) to stop breaking on the function, or use the UI to turn off all breakpoints.
For more information on breakpoints, see Pause your code with breakpoints.
dir(object)
dir(object) displays an object-style listing of all of the properties for the specified object, like console.dir().
This function is an alias for console.dir().
Syntax
dir(object)
Example
Press Ctrl+Shift+J (Windows, Linux) or Command+Option+J (macOS). The Console tool opens in DevTools, next to the webpage.
In the Console tool, enter
document.headand then press Enter.An HTML representation of the
<head>element is displayed.Enter
dir(document.head)and then press Enter.An object-style listing of all of the properties for the
<head>element is displayed: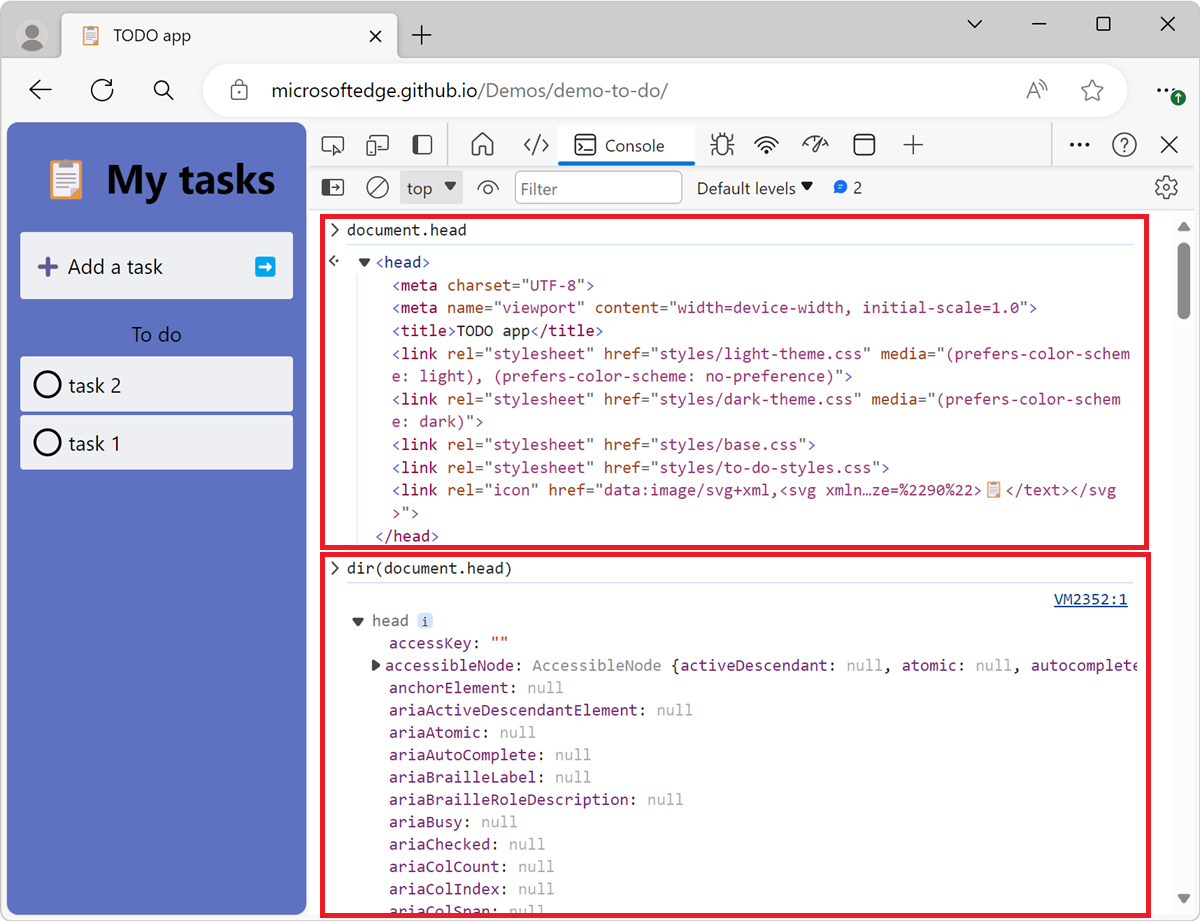
For more information, see console.dir() in the Console API.
dirxml(object)
dirxml(object) prints an XML representation of the specified object, as displayed in the Elements tool, like console.dirxml().
This function is equivalent to console.dirxml().
Syntax
dirxml(object)
inspect(object/function)
inspect(element/function) opens and selects the specified DOM element in the Elements tool, or the specified JavaScript function in the Sources tool.
- For a DOM element, this function opens and selects the specified DOM element in the Elements tool.
- For a JavaScript function, this function opens the specified JavaScript function in the Sources tool.
Syntax
inspect(element/function)
Example
Press Ctrl+Shift+J (Windows, Linux) or Command+Option+J (macOS). The Console tool opens in DevTools, next to the webpage.
In the Console tool, enter
inspect(document.body)and then press Enter.The Elements tool opens and the
<body>element is selected: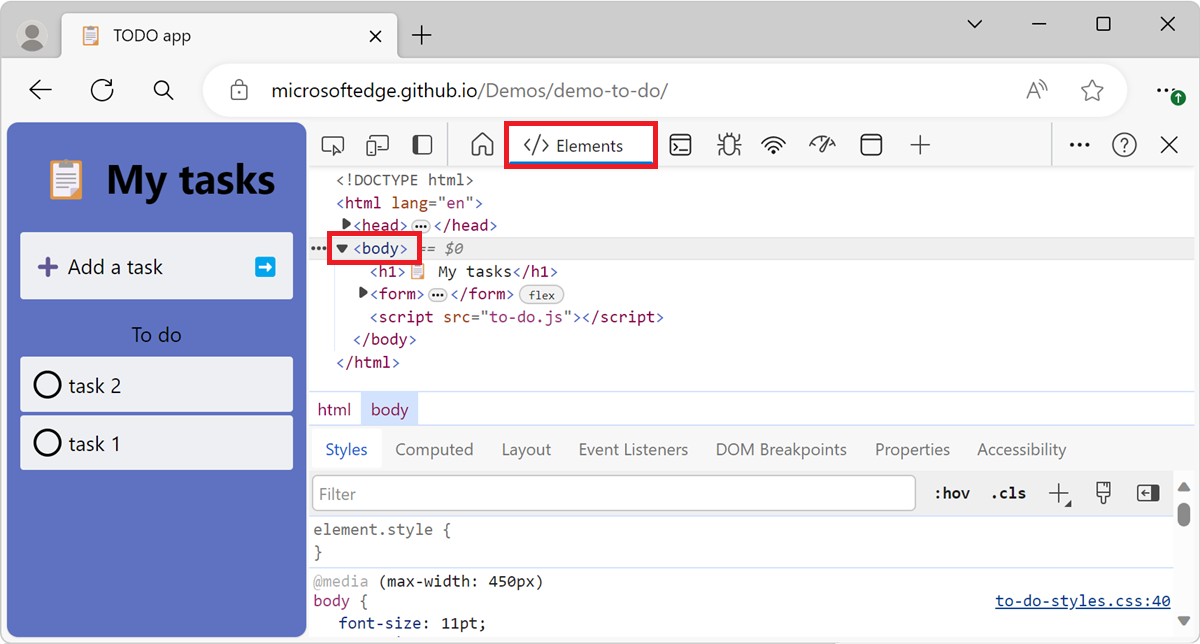
When passing a function to inspect, the function opens the webpage in the Sources tool for you to inspect.
getEventListeners(object)
getEventListeners(object) returns the event listeners that are registered on the specified object.
The return value is an object that contains an array for each registered event type (such as click or keydown). The items in each array are objects that describe the listener registered for each type.
Syntax
getEventListeners(object)
Example
Press Ctrl+Shift+J (Windows, Linux) or Command+Option+J (macOS). The Console tool opens in DevTools, next to the webpage.
In the Console tool, enter
getEventListeners($('form'))and then press Enter.The event listeners that are registered on the first
<form>element are displayed: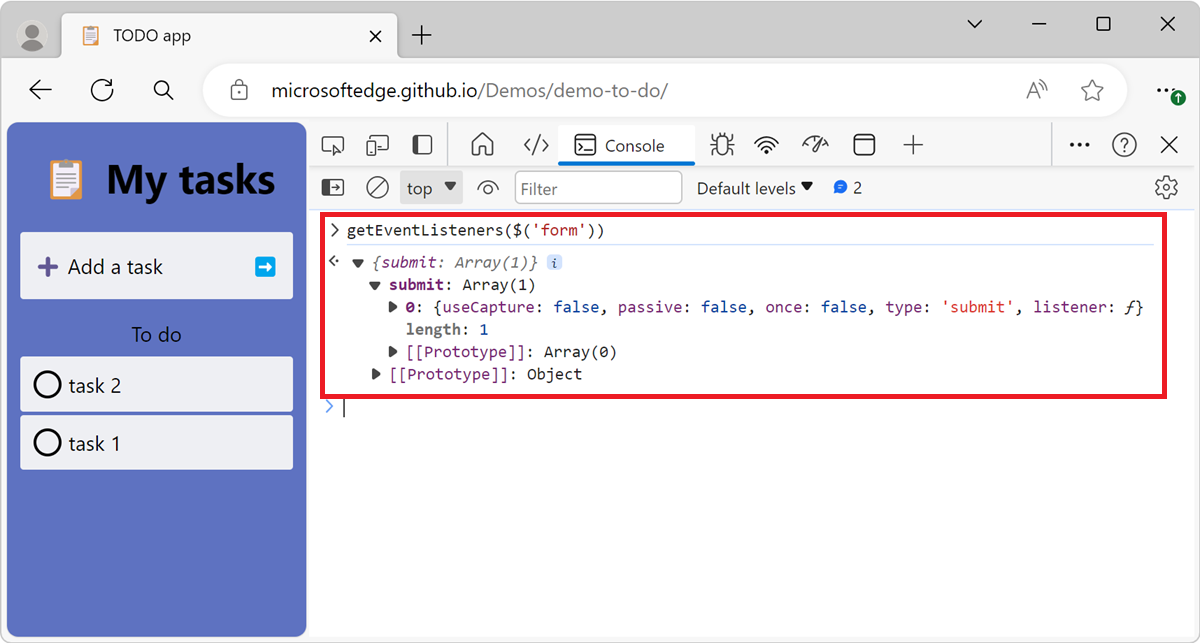
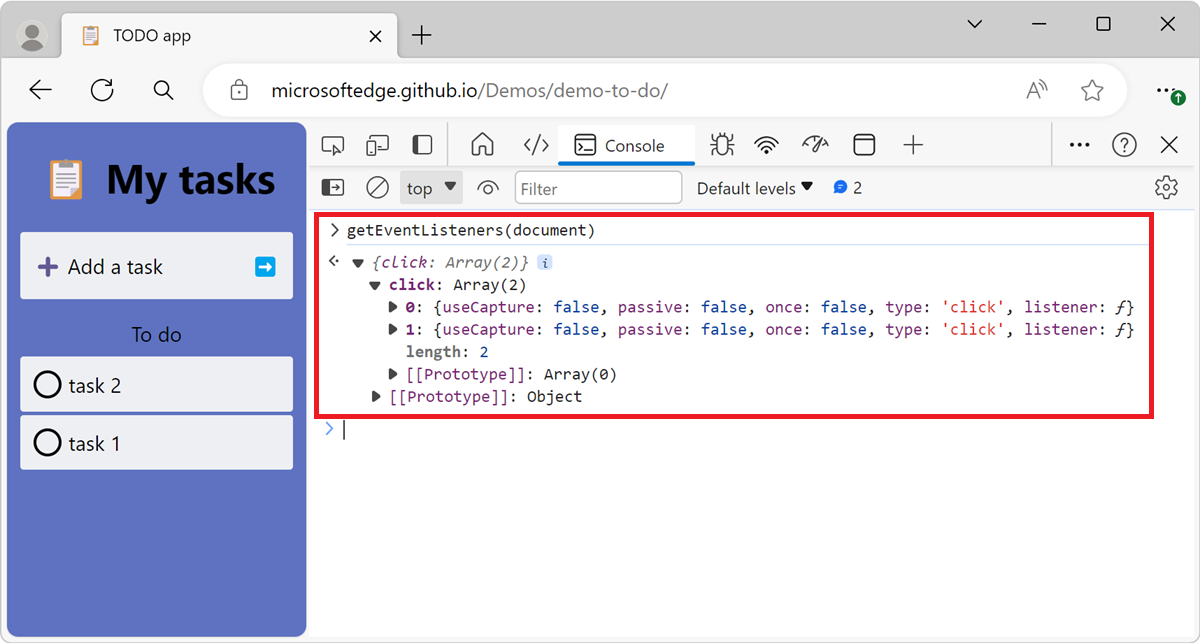
If more than one listener is registered on the specified object, then the array contains a member for each listener. In the following figure, two event listeners are registered on the document element for the click event:
keys(object)
keys(object) returns an array containing the names of the properties belonging to the specified object.
To get the associated values of the same properties, see values(object), below.
Syntax
keys(object)
Example
Press Ctrl+Shift+J (Windows, Linux) or Command+Option+J (macOS). The Console tool opens in DevTools, next to the webpage.
In the Console tool, enter the following code, and then press Enter:
var player1 = {"name": "Ted", "level": 42}The above code snippet defines an object in the global namespace named
player1, which contains two properties.To get the names of the properties belonging to the
player1object, enterkeys(player1)in the Console tool, and then press Enter: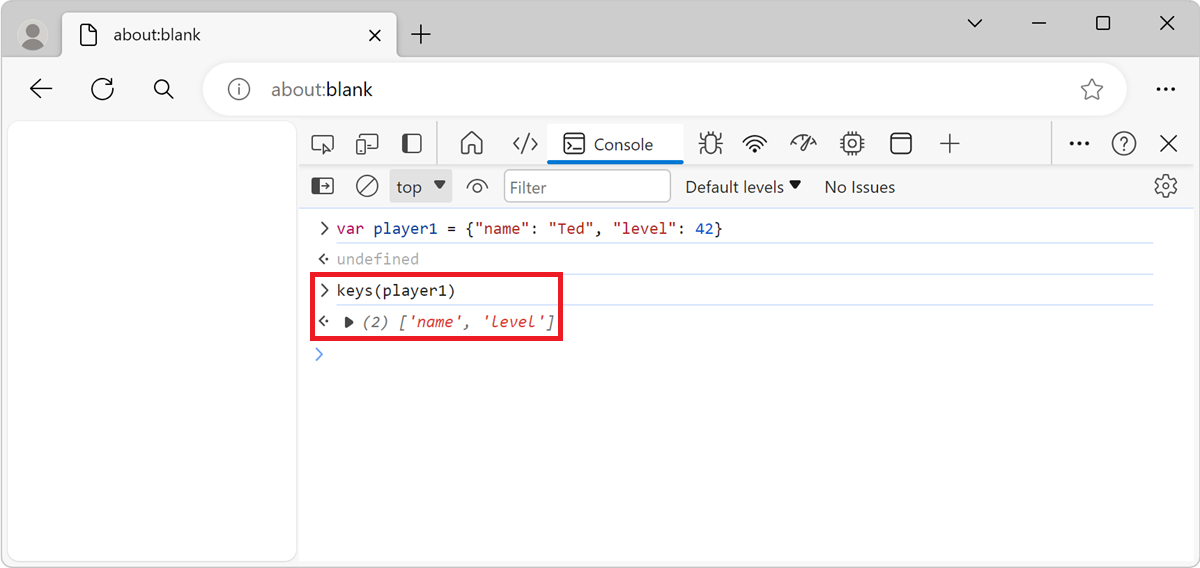
To get the values of the properties belonging to the
player1object, entervalues(player1)in the Console tool, and then press Enter: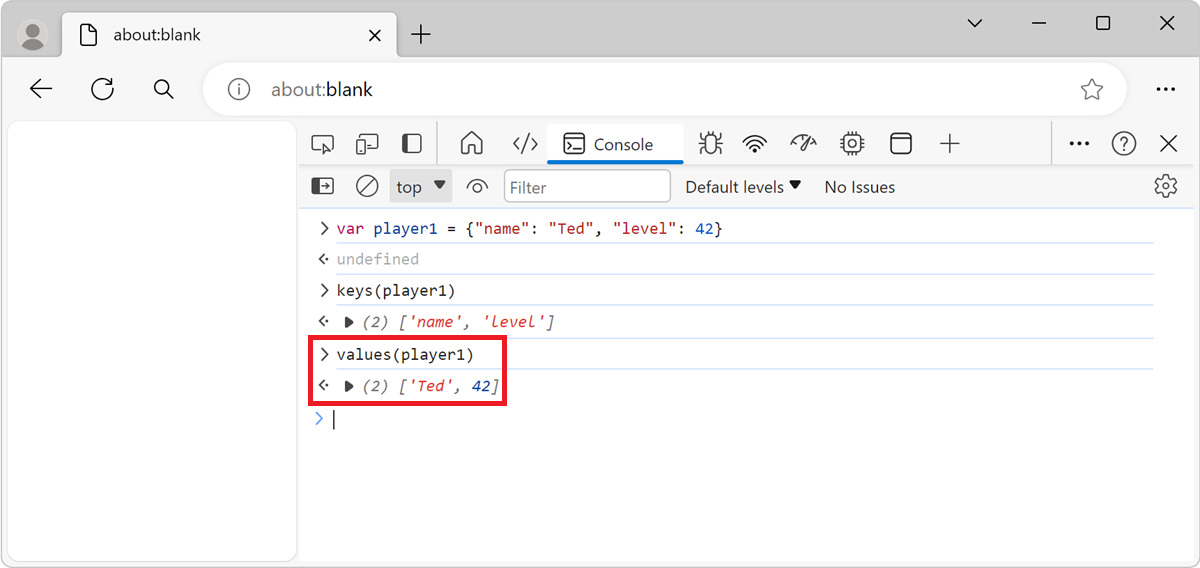
monitor(function)
monitor(function) logs a message to the console everytime the specified function is called. The message indicates the function name and the arguments passed to the function.
Syntax
monitor(function)
Example
Press Ctrl+Shift+J (Windows, Linux) or Command+Option+J (macOS). The Console tool opens in DevTools, next to the webpage.
In the Console tool, enter the following code and then press Enter:
function sum(x, y) {
  return x + y;
}
The above code snippet defines a function named
sum, which accepts two arguments.To start monitoring the
sumfunction, entermonitor(sum)in the Console tool, and then press Enter:To call the function, enter
sum(1, 2)and press Enter. A message appears, indicating that thesumfunction was called, and the arguments passed to the function: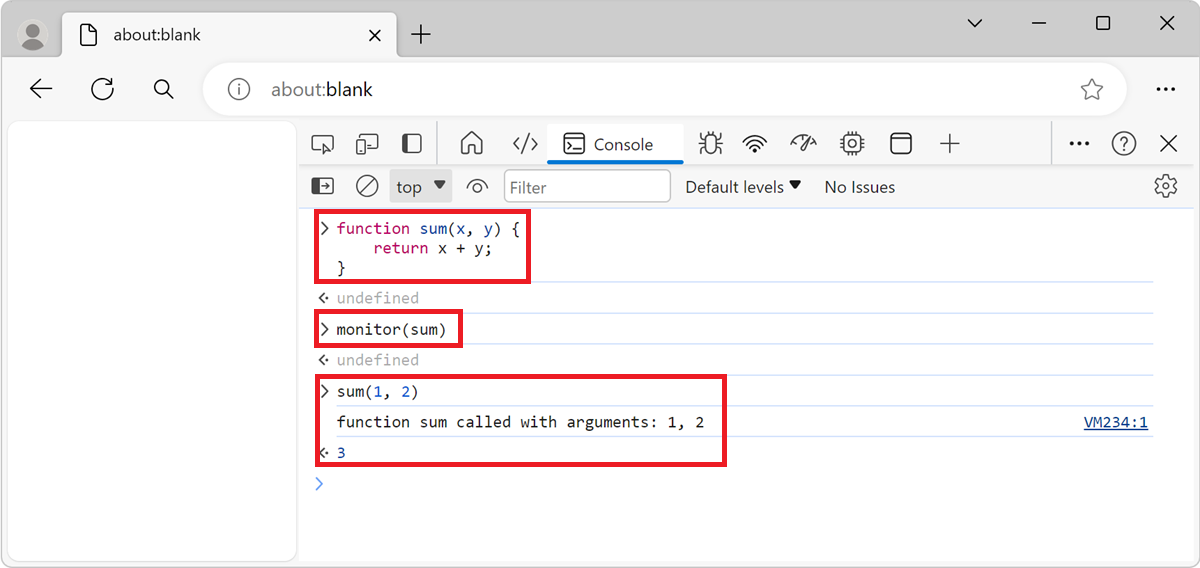
To end monitoring, use unmonitor(function).
monitorEvents(object[, events])
monitorEvents(object[, events]) logs an event object to the console every time the specified events occur on the specified object.
You can specify a single event to monitor, an array of events, or one of the generic events types that are mapped to a predefined collection of events.
Syntax
monitorEvents(object[, events])
Example 1
To monitor a single event:
Press Ctrl+Shift+J (Windows, Linux) or Command+Option+J (macOS). The Console tool opens in DevTools, next to the webpage.
In the Console tool, enter the following code and then press Enter:
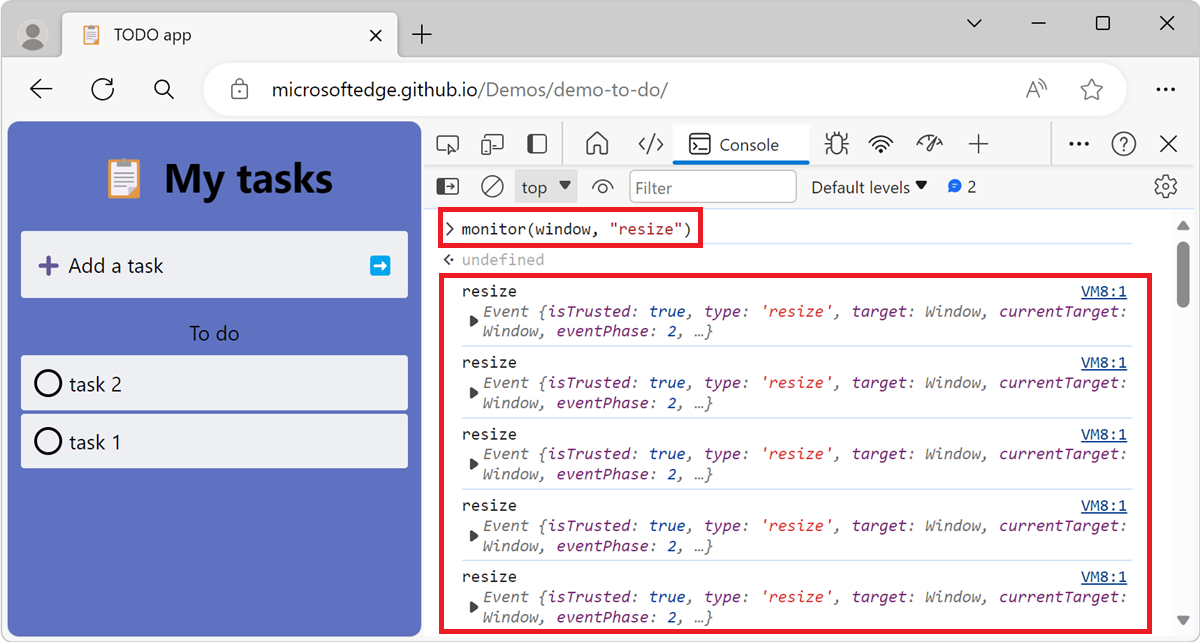
monitorEvents(window, "resize");The previous code snippet monitors all resize events on the window object.
Resize the window, for example by making DevTools larger or smaller. Resize events appear in the Console tool:
Example 2
To monitor multiple events:
Press Ctrl+Shift+J (Windows, Linux) or Command+Option+J (macOS). The Console tool opens in DevTools, next to the webpage.
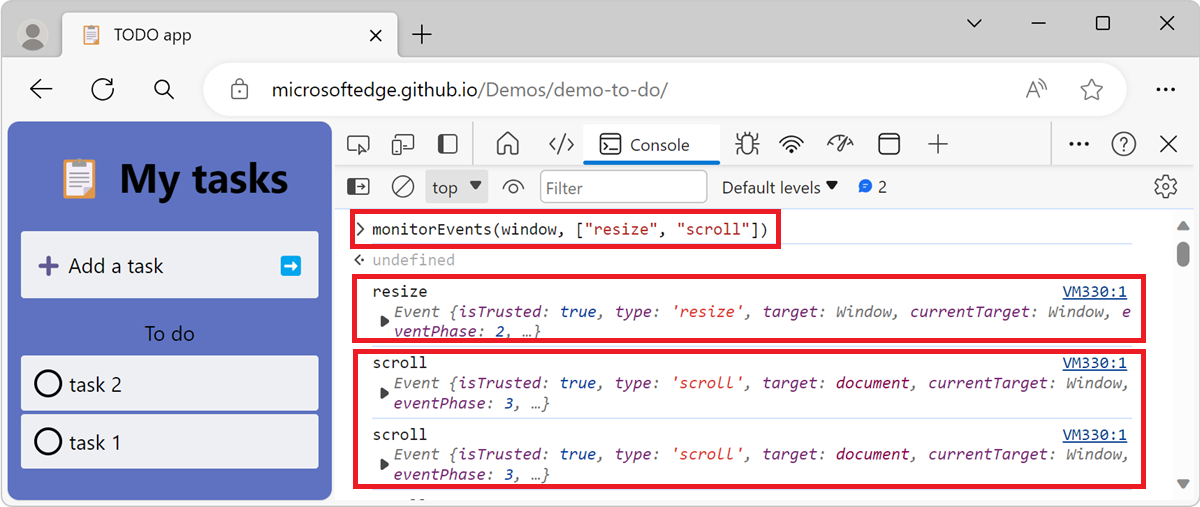
In the Console tool, enter the following code and then press Enter:
monitorEvents(window, ["resize", "scroll"]);The previous code snippet defines an array of event names to monitor both
resizeandscrolleevents on the window object.Resize the window, for example by making it shorter, and then scroll in the rendered webpage. Resize and scroll events appear in the Console tool:
Example 3
You can also specify a collection of events by using one of the predefined sets of events. The following table shows the available event types and the associated event mappings:
| Event type | Corresponding mapped events |
|---|---|
mouse |
"click", "dblclick", "mousedown", "mousemove", "mouseout", "mouseover", "mouseup", "mousewheel" |
key |
"keydown", "keypress", "keyup", "textInput" |
touch |
"touchcancel", "touchend", "touchmove", "touchstart" |
control |
"blur", "change", "focus", "reset", "resize", "scroll", "select", "submit", "zoom" |
Press Ctrl+Shift+J (Windows, Linux) or Command+Option+J (macOS). The Console tool opens in DevTools, next to the webpage.
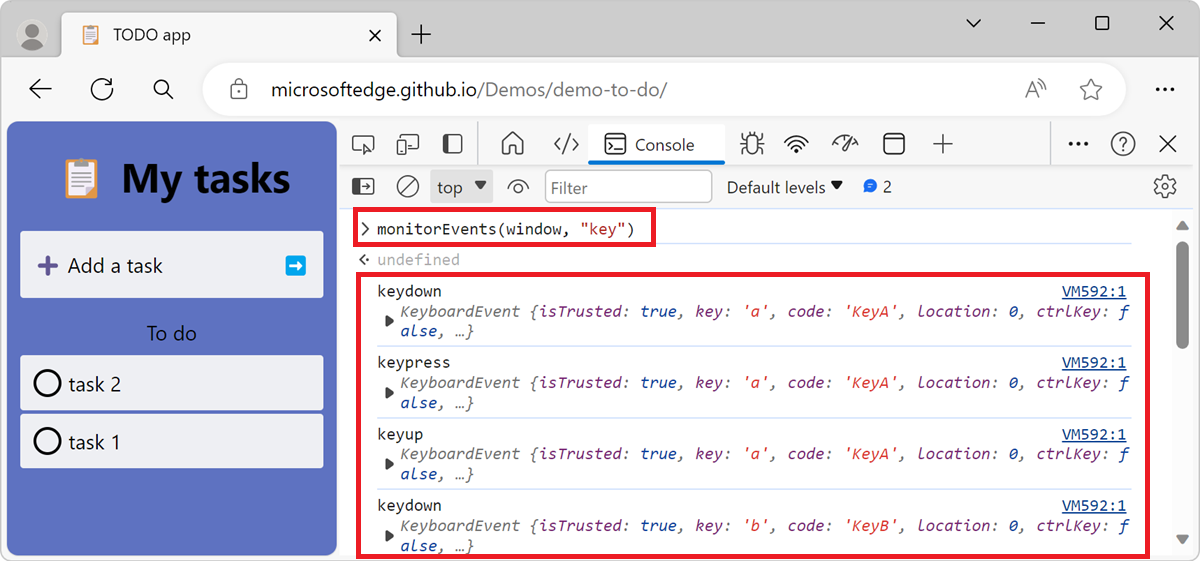
In the Console tool, enter the following code and then press Enter:
monitorEvents(window, "key");The previous code snippet monitors all keyboard events on the window object.
In the rendered webpage, press any keys. Keyboard events appear in the Console tool:
profile([name])
profile([name]) starts a JavaScript CPU profiling session with an optional name.
To complete the profile and display the results in the Performance tool, call profileEnd([name]).
Syntax
profile([name])
Example
Open the page that you want to profile in a new tab or window. For example, go to the Sluggish Animation demo page.
Press Ctrl+Shift+J (Windows, Linux) or Command+Option+J (macOS). The Console tool opens in DevTools, next to the webpage.
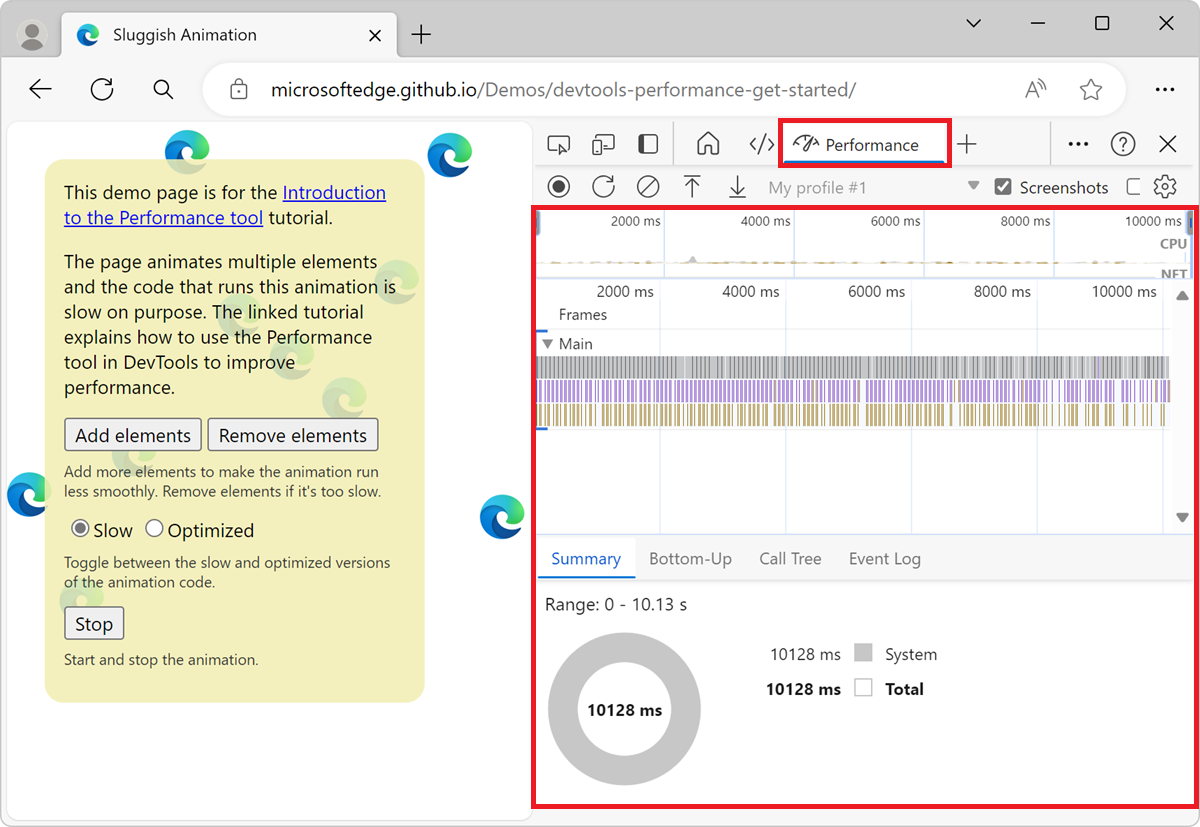
To start profiling, in the Console tool, type
profile("My profile), and then press Enter.To stop profiling, after some time has passed, type
profileEnd("My profile"), and then press Enter.The profile results appear in the Performance tool:
You can create multiple profiles at the same time, and you aren't required to end each profile in creation order. For example, the following code creates two profiles, and then ends them in the opposite order:
profile('A');
profile('B');
profileEnd('B');
profileEnd('A');
profileEnd([name])
profileEnd([name]) completes a JavaScript CPU profiling session and displays the results in the Performance tool.
To call this function, you must be running the profile([name]) function.
Syntax
profileEnd([name])
For more information, see profile([name]), above.
queryObjects(constructor)
queryObjects(constructor) returns an array of the objects that were created by the specified constructor.
The scope of queryObjects() is the currently selected runtime context in the Console.
Syntax
queryObjects(constructor)
Example
Press Ctrl+Shift+J (Windows, Linux) or Command+Option+J (macOS). The Console tool opens in DevTools, next to the webpage.
To return all instances of HTML elements, enter
queryObjects(HTMLElement)in the Console tool, and then press Enter: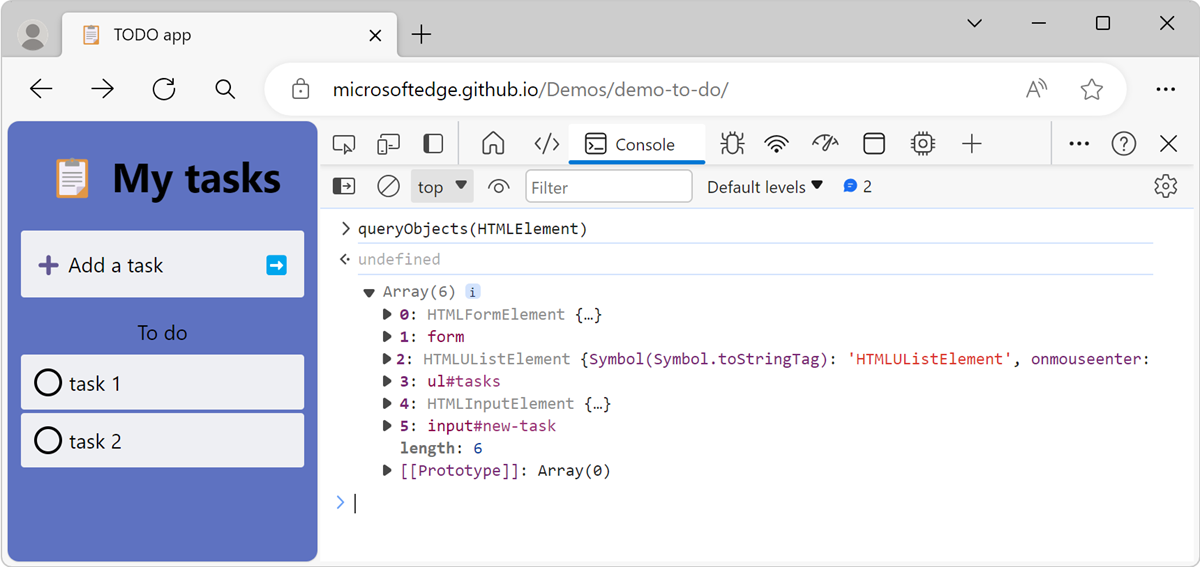
Other examples:
- Use
queryObjects(Promise)to return all instances ofPromiseobjects if your webpage usesPromiseobjects. - Use
queryObjects(ClassName)to return all instances of theClassNameclass if your webpage uses JavaScript classes.
table(data[, columns])
table(data[, columns]) logs object data, formatted as a table with column headings, for the specified data object.
This function is an alias for console.table().
Syntax
table(data[, columns])
Example
To display a list of people's names as a table, in the Console:
Press Ctrl+Shift+J (Windows, Linux) or Command+Option+J (macOS). The Console tool opens in DevTools, next to the webpage.
Enter the following code in the Console, and then press Enter:
var names = {
  0: {
    firstName: "John",
    lastName: "Smith"
  },
  1:  {
    firstName: "Jane",
    lastName: "Doe"
  }
};
The above code snippet defines an object in the global namespace named
names, which contains two properties.To display the
namesobject as a table, entertable(names)in the Console, and then press Enter: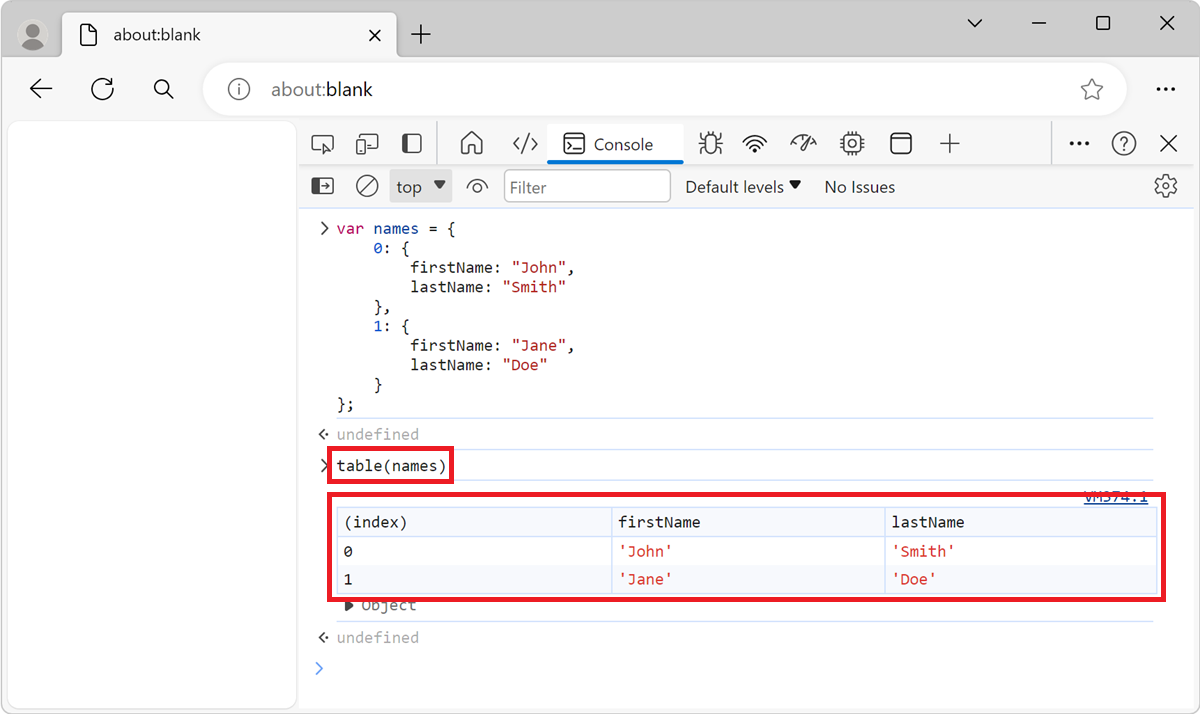
undebug(function)
undebug(function) stops the debug of the specified function, so that when the function runs, the debugger no longer pauses in the function.
For more information, see debug(function), above.
Syntax
undebug(function)
unmonitor(function)
unmonitor(function) stops the monitoring of the specified function.
For more information, see monitor(function), above.
Syntax
unmonitor(function)
unmonitorEvents(object[, events])
unmonitorEvents(object[, events]) stops monitoring events for the specified object and events.
For more information, see monitorEvents(object[, events]), above.
Syntax
unmonitorEvents(object[, events])
values(object)
values(object) returns an array containing the values of all properties belonging to the specified object.
To get the associated keys of the same properties, see keys(object), above.
Syntax
values(object)
Example
See the example in keys(object), above.
See also
- Console features reference
- Console object API Reference -
console.*functions, such asconsole.log()andconsole.error().
Note
Portions of this page are modifications based on work created and shared by Google and used according to terms described in the Creative Commons Attribution 4.0 International License. The original page is found here and is authored by Kayce Basques.
![]() This work is licensed under a Creative Commons Attribution 4.0 International License.
This work is licensed under a Creative Commons Attribution 4.0 International License.