Note
Access to this page requires authorization. You can try signing in or changing directories.
Access to this page requires authorization. You can try changing directories.
These are the latest features in the Stable release of Microsoft Edge DevTools.
Video: What's new in DevTools 109
Import and export your DevTools instances with the new enhanced traces feature
In Microsoft Edge 109, you can turn on new settings to export enhanced traces from the Performance and Memory tools. These enhanced traces include more information, such as:
- Messages logged to the Console.
- The JavaScript that was running on the page at the time of recording.
- Snapshots of the DOM.
When saving performance profiles, heap snapshots, allocation timelines, or allocation sampling, you can now export a new .devtools file format. When you then import the .devtools file, a new instance of DevTools opens, with the state of your Elements, Console, and Sources tools preserved. These enhanced traces offer a powerful new way to collaborate and share the information in your DevTools.
To try the enhanced traces feature:
In DevTools, click the Settings (
 ) button.
In the Persistence section of the Preferences settings page, select the Export enhanced performance and memory traces checkbox:
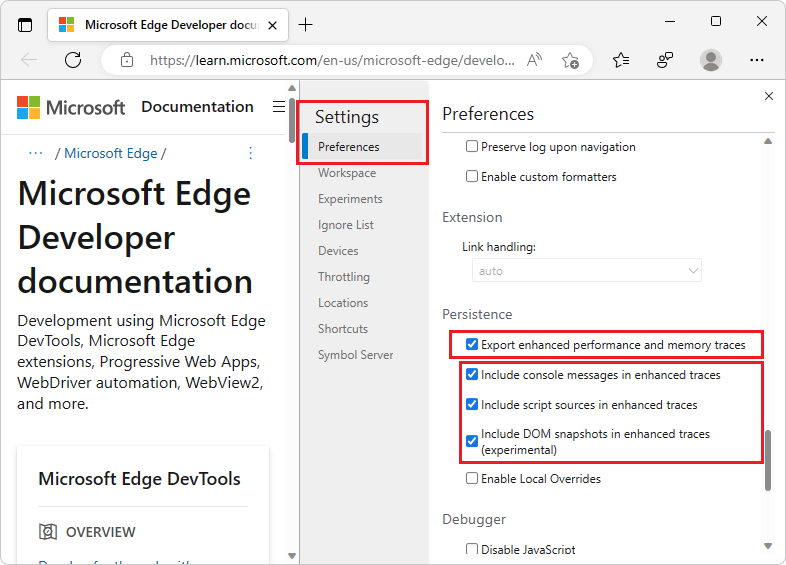
If you want to preserve Console messages, JavaScript, or DOM snapshots, select the corresponding checkboxes.
Click the Close (x) button in DevTools Settings.
In the Performance tool, take a recording.
Click the Save profile (
 ) button.
In the Save As dialog, save the new
.devtoolsfile.
Importing:
Import the
.devtoolsfile from within the Performance tool by clicking the Load profile ( ) button:
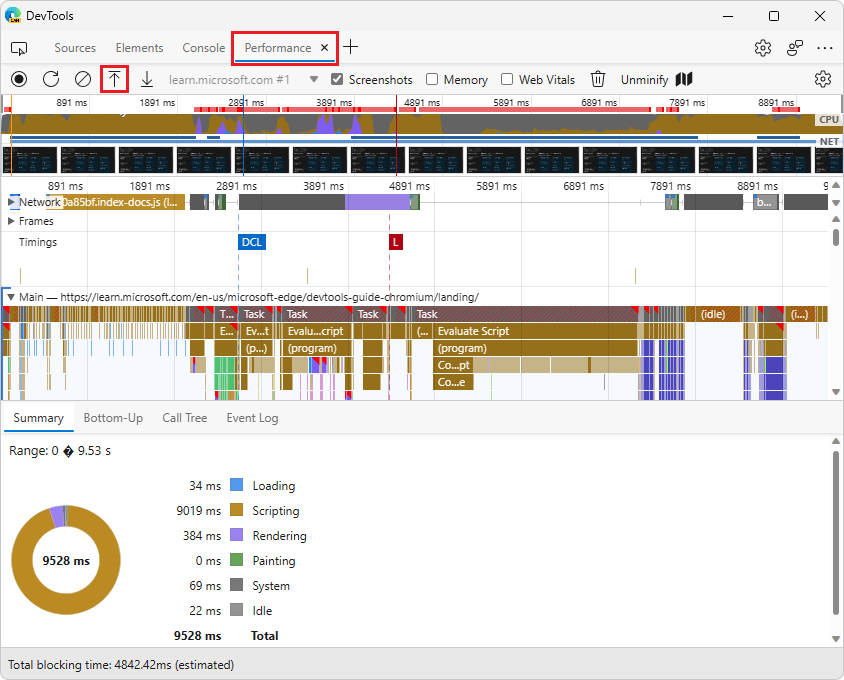
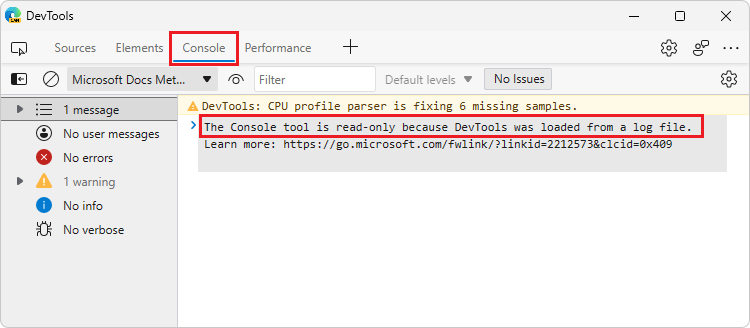
A new DevTools window opens, containing a subset of the tools, including the Performance tool loaded with the profile that you just recorded. The Elements, Console, and Sources tools are also pre-populated with their preserved state:
You can also export from the Memory tool with the new .devtools file format. This is a new feature that the DevTools team is actively experimenting with, so please send us your feedback in [Feedback] Enhanced Traces experiment #122.
See also:
Debug long-running Recalculate Style events with new selector stats
In Microsoft Edge 109, in the Performance tool, you can turn on the Enable advanced rendering instrumentation (slow) setting in the Performance tool to access the new selector stats feature.
With this setting turned on:
Select Record, and then run the scenario that you want to improve on your website or app.
Select Stop.
Select a Recalculate Style event. In the bottom section of the Performance tool, select the Selector Stats tab:
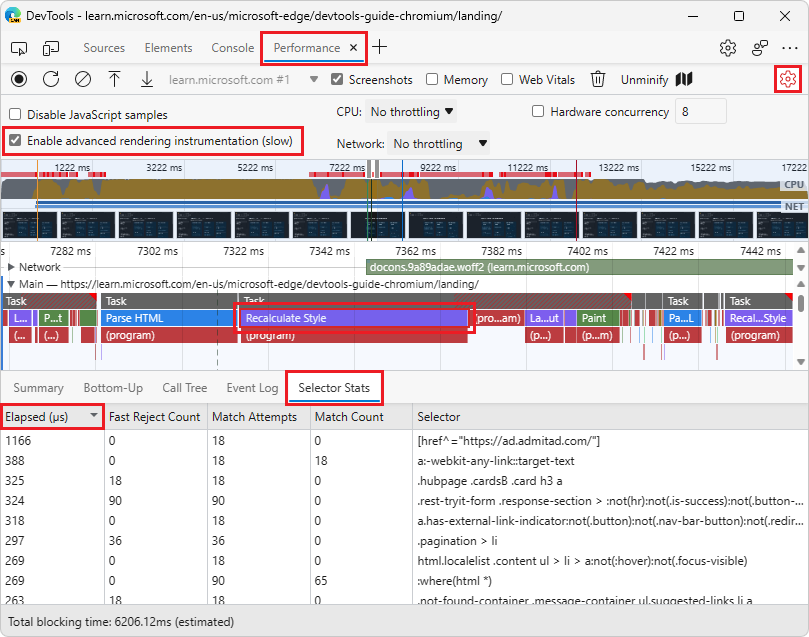
The Selector Stats tab provides a list of all the CSS selectors that were calculated by the browser engine during the Recalculate Style event. You can sort selectors by the Elapsed time they took to process, or by the number of elements they matched (the Match Count column). Use this data to:
- Find selectors that take a long time for the browser to process, and simplify them.
- Make selectors more specific, to improve performance.
See also:
- The truth about CSS selector performance - blog post
- [Feedback] Selector Performance Tracing Explainer · Issue #98
- Analyze CSS selector performance during Recalculate Style events
Track objects discarded by garbage collection when allocation sampling
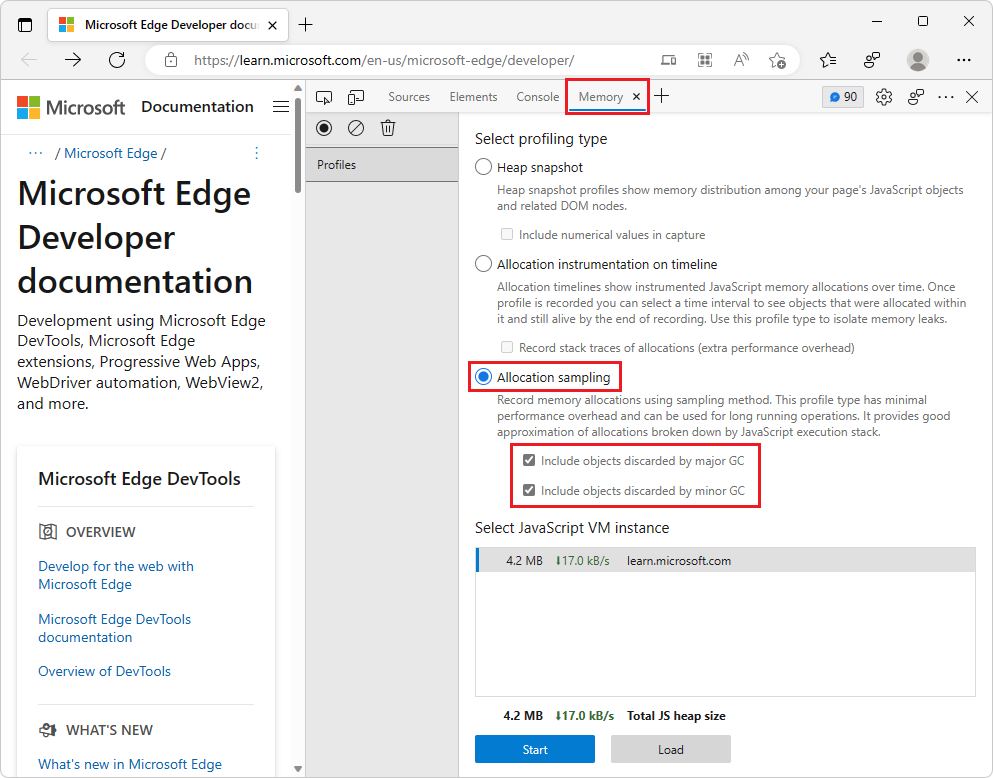
In Microsoft Edge 109, the Allocation sampling profiling type in the Memory tool now has two new options:
Include objects discarded by major GC.
Include objects discarded by minor GC.
Without selecting these options, the Memory tool will continue to work as it did before, reporting allocations that are still alive at the end of the profiling session. In this mode, objects that are generated and garbage-collected (GC'd) and then disappear aren't tracked by allocation sampling.
Select both options if you want to track garbage that is being generated by your website or app. In the resulting profile, you'll be able to see garbage that was generated by your JavaScript functions that was then GC'd. Use these options if you want to reduce the amount of garbage that your code is generating. To learn more about the differences between major and minor GC, see Trash talk: the Orinoco garbage collector.
See also:
- Investigate memory allocation, with reduced garbage ("Include objects" checkboxes) in Speed up JavaScript runtime ("Allocation sampling" profiling type).
Heap Snapshot visualizer extension for DevTools
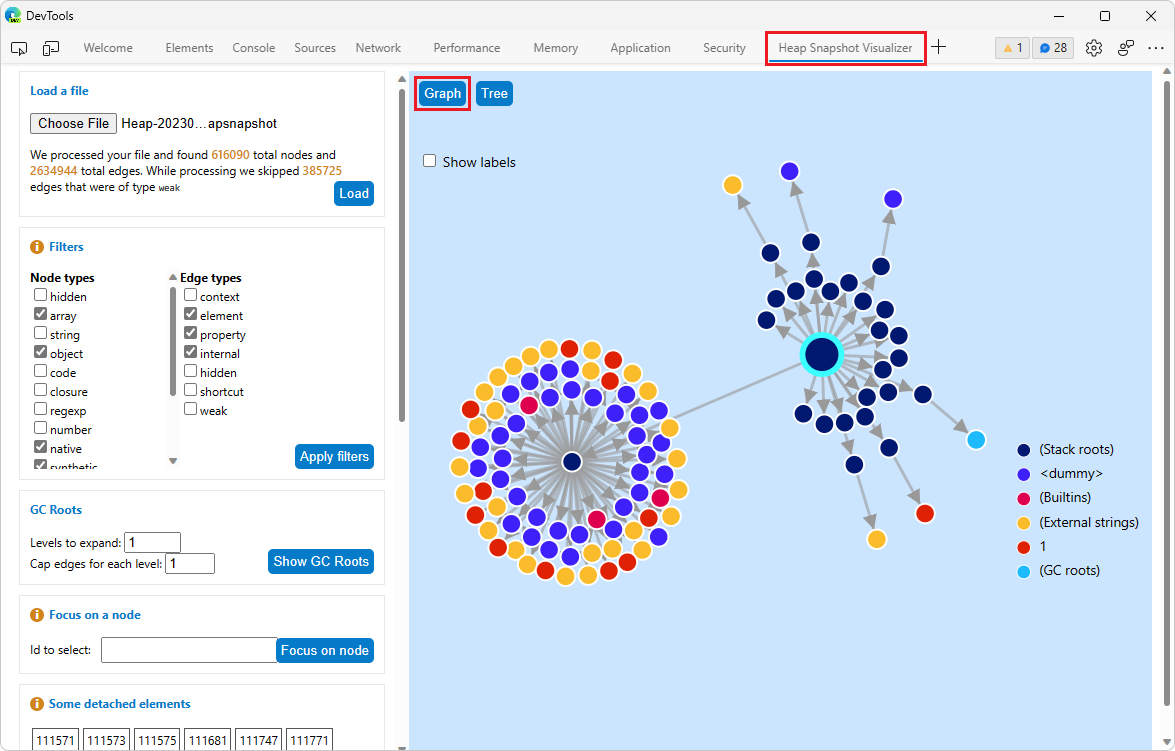
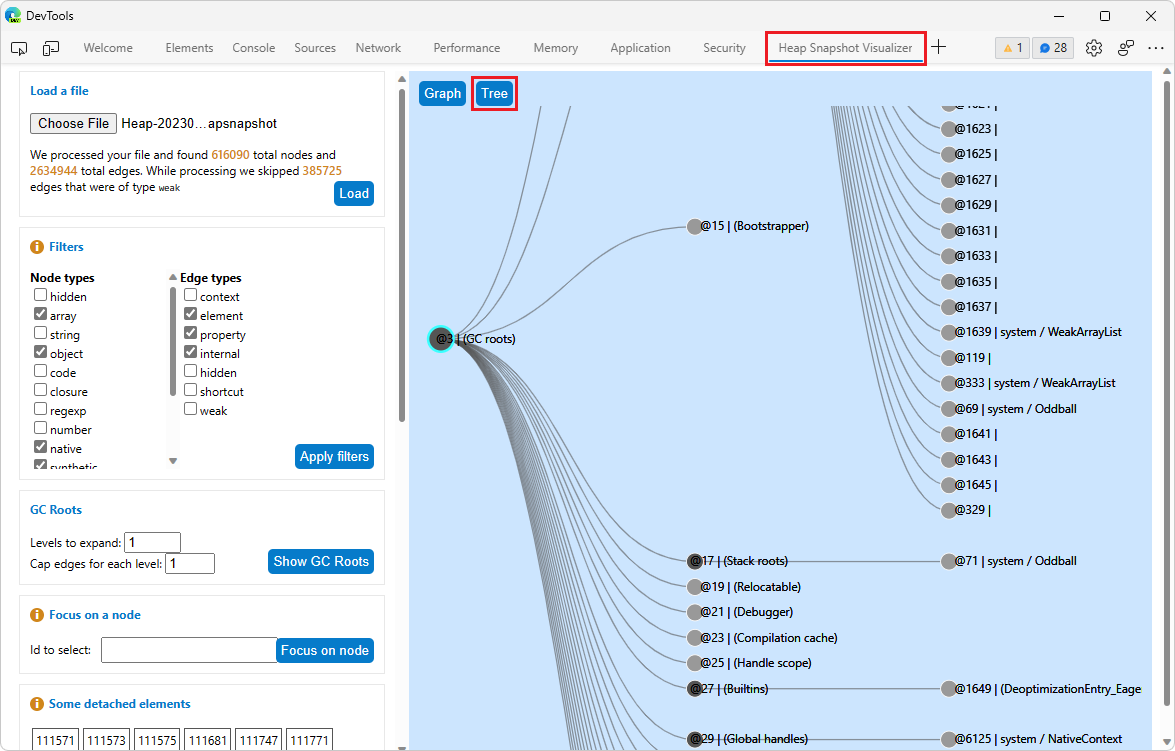
Add the new Heap Snapshot Visualizer extension to Microsoft Edge to get new visualizations of the data that's in your heap snapshot files. Installing this extension adds a new Heap Snapshot Visualizer tool in DevTools. In the Heap Snapshot Visualizer tool, you can load a heap snapshot file to see it represented either as a directed graph or as a tree. These new visualizations enable you to explore the retainers chain from the garbage-collection (GC) root to an individual node.
Graph view:
Tree view:
See also:
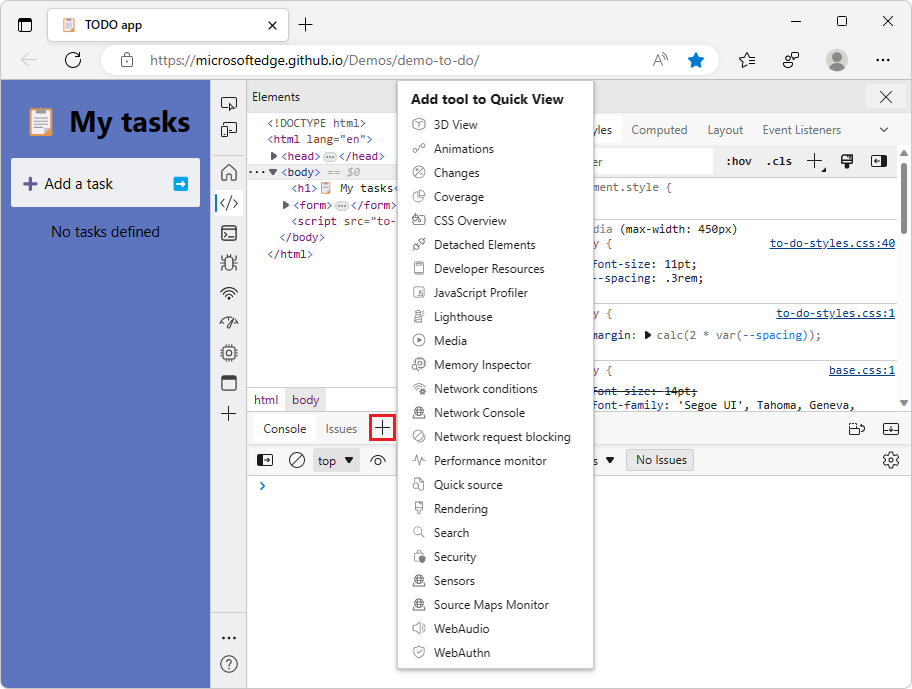
Improvements to Quick View in Focus Mode
We listened to your feedback and improved the Quick View options in Focus Mode. Instead of offering only a subset of the tools in a Quick View dropdown list, you can now select any DevTools tool by clicking the More tools (![]() ) button, like in the main toolbar of DevTools. Load any tool in the Quick View panel of DevTools, to show multiple tools at the same time.
) button, like in the main toolbar of DevTools. Load any tool in the Quick View panel of DevTools, to show multiple tools at the same time.
The state of your Quick View toolbar persists across DevTools sessions. The Quick View panel automatically collapses if you open the same tool in the upper pane of DevTools.
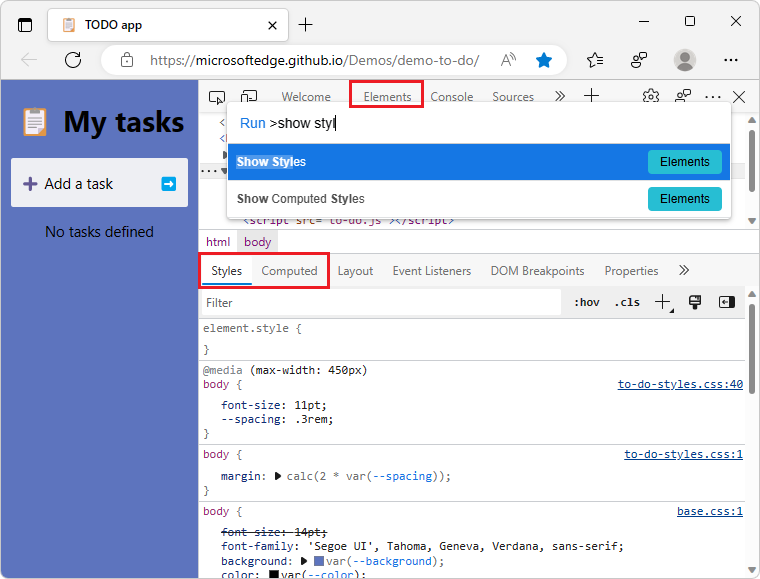
Navigate directly to the Styles and Computed Styles tabs of the Elements tool
There was an accessibility issue where voice-command users couldn't navigate to the Styles tab or Computed tab in the Elements tool. You can now access these tabs through two new commands in the Command Menu:
- Show Styles
- Show Computed Styles
See also:
Announcements from the Chromium project
Microsoft Edge 109 also includes the following updates from the Chromium project:
- Show actual function names in performance's recordings
- New keyboard shortcuts in the Console & Sources panel
- Improved JavaScript debugging