Nota
L-aċċess għal din il-paġna jeħtieġ l-awtorizzazzjoni. Tista’ tipprova tidħol jew tibdel id-direttorji.
L-aċċess għal din il-paġna jeħtieġ l-awtorizzazzjoni. Tista’ tipprova tibdel id-direttorji.
APPLIES TO:
NoSQL
The Java SDK for Azure Cosmos DB implements client metrics using Micrometer for instrumentation in popular observability systems like Prometheus. This article includes instructions and code snippets for scraping metrics into Prometheus, taken from this sample. The full list of metrics provided by the SDK is documented here. If your clients are deployed on Azure Kubernetes Service (AKS), you can also use the Azure Monitor managed service for Prometheus with custom scraping, see documentation here.
Consume metrics from Prometheus
You can download prometheus from here. To consume Micrometer metrics in the Java SDK for Azure Cosmos DB using Prometheus, first ensure you have imported the required libraries for registry and client:
<dependency>
    <groupId>io.micrometer</groupId>
    <artifactId>micrometer-registry-prometheus</artifactId>
    <version>1.6.6</version>
</dependency>

<dependency>
    <groupId>io.prometheus</groupId>
    <artifactId>simpleclient_httpserver</artifactId>
    <version>0.5.0</version>
</dependency>
In your application, provide the prometheus registry to the telemetry config. Notice that you can set various diagnostic thresholds, which will help to limit metrics consumed to the ones you're most interested in:
//prometheus meter registry
PrometheusMeterRegistry prometheusRegistry = new PrometheusMeterRegistry(PrometheusConfig.DEFAULT);

//provide the prometheus registry to the telemetry config
CosmosClientTelemetryConfig telemetryConfig = new CosmosClientTelemetryConfig()
        .diagnosticsThresholds(
                new CosmosDiagnosticsThresholds()
                        // Any requests that violate (are lower than) any of the below thresholds that are set
                        // will not appear in "request-level" metrics (those with "rntbd" or "gw" in their name).
                        // The "operation-level" metrics (those with "ops" in their name) will still be collected.
                        // Use this to reduce noise in the amount of metrics collected.
                        .setRequestChargeThreshold(10)
                        .setNonPointOperationLatencyThreshold(Duration.ofDays(10))
                        .setPointOperationLatencyThreshold(Duration.ofDays(10))
        )
        // Uncomment below to apply sampling to help further tune client-side resource consumption related to metrics.
        // The sampling rate can be modified after Azure Cosmos DB Client initialization – so the sampling rate can be
        // modified without any restarts being necessary.
        //.sampleDiagnostics(0.25)
        .clientCorrelationId("samplePrometheusMetrics001")
        .metricsOptions(new CosmosMicrometerMetricsOptions().meterRegistry(prometheusRegistry)
                //.configureDefaultTagNames(CosmosMetricTagName.PARTITION_KEY_RANGE_ID)
                .applyDiagnosticThresholdsForTransportLevelMeters(true)
        );
Start local HttpServer server to expose the meter registry metrics to Prometheus:
try {
    HttpServer server = HttpServer.create(new InetSocketAddress(8080), 0);
    server.createContext("/metrics", httpExchange -> {
        String response = prometheusRegistry.scrape();
        int i = 1;
        httpExchange.sendResponseHeaders(200, response.getBytes().length);
        try (OutputStream os = httpExchange.getResponseBody()) {
            os.write(response.getBytes());
        }
    });
    new Thread(server::start).start();
} catch (IOException e) {
    throw new RuntimeException(e);
}
Ensure you pass clientTelemetryConfig when creating your CosmosClient:
//  Create async client
client = new CosmosClientBuilder()
    .endpoint(AccountSettings.HOST)
    .key(AccountSettings.MASTER_KEY)
    .clientTelemetryConfig(telemetryConfig)
    .consistencyLevel(ConsistencyLevel.SESSION) //make sure we can read our own writes
    .contentResponseOnWriteEnabled(true)
    .buildAsyncClient();
When adding the endpoint for your application client to prometheus.yml, add the domain name and port to "targets". For example, if prometheus is running on the same server as your app client, you can add localhost:8080 to targets as below:
scrape_configs:
  # The job name is added as a label `job=<job_name>` to any timeseries scraped from this config.
  - job_name: "prometheus"

    # metrics_path defaults to '/metrics'
    # scheme defaults to 'http'.

    static_configs:
      - targets: ["localhost:9090", "localhost:8080"]
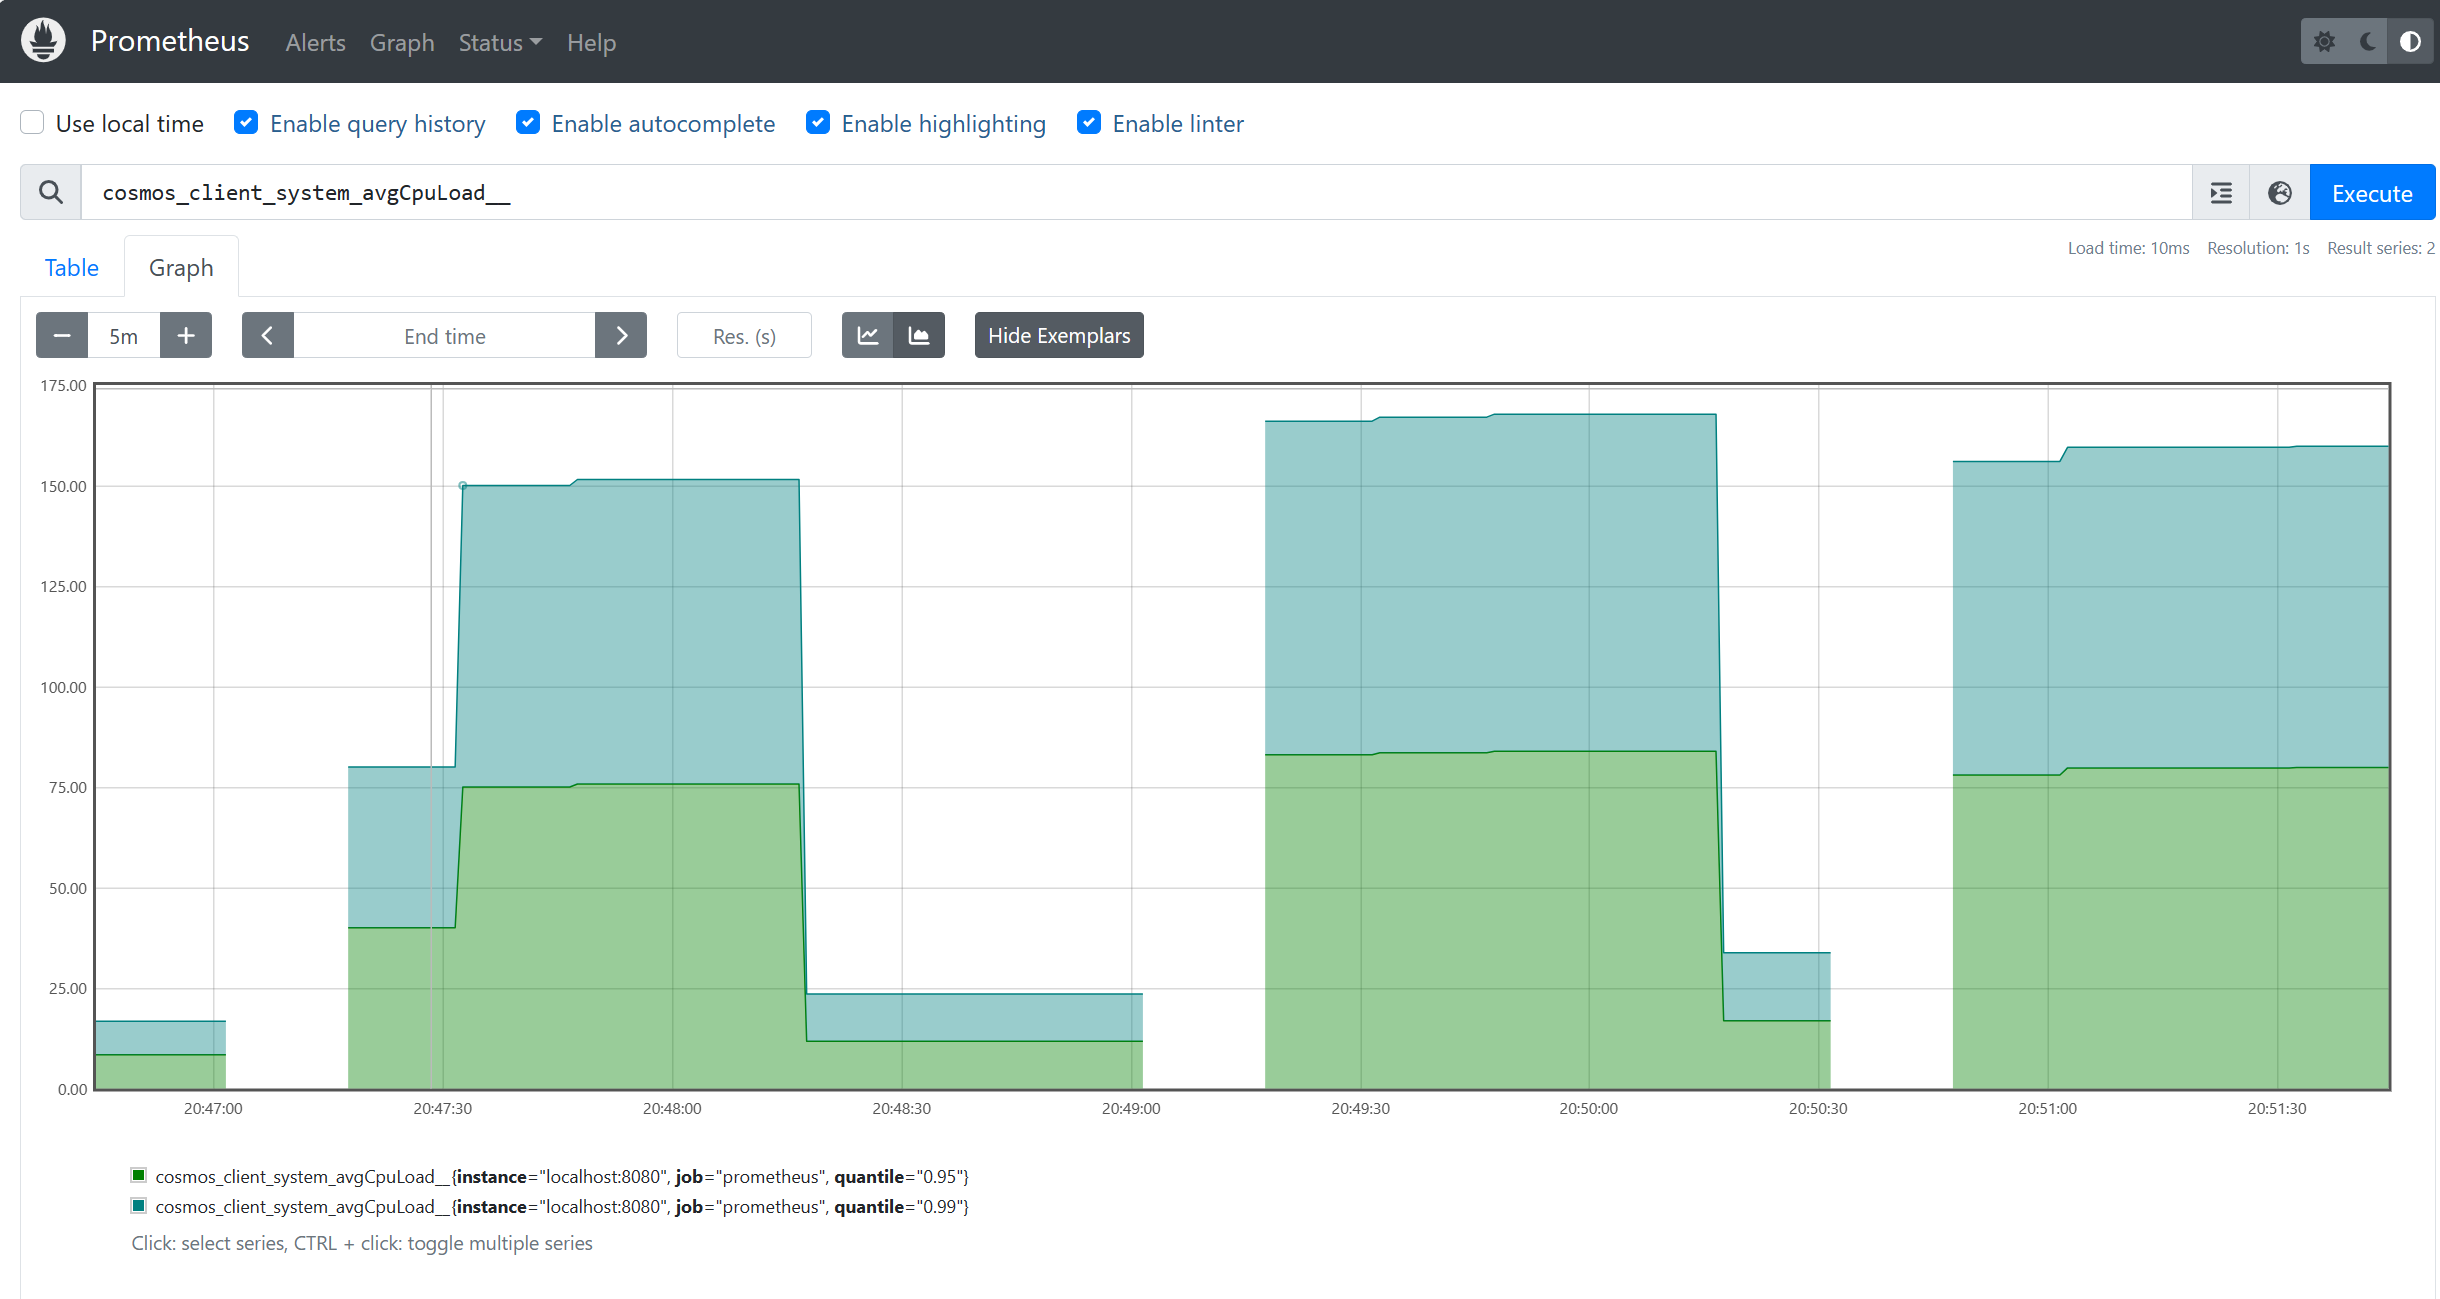
Now you can consume metrics from Prometheus:
