Nota
L-aċċess għal din il-paġna jeħtieġ l-awtorizzazzjoni. Tista’ tipprova tidħol jew tibdel id-direttorji.
L-aċċess għal din il-paġna jeħtieġ l-awtorizzazzjoni. Tista’ tipprova tibdel id-direttorji.
Live monitor can help you debug and diagnose problems, which help you build faster, more reliable model-driven apps. Live monitor provides a deep view into how an app runs by providing a log of all activities in your app as it runs.
Important
Live monitor must be run on the model-driven app and not directly on a custom page.
Start a live monitor session
There are two ways to open a live monitor session.
From Power Apps
Sign in to Power Apps, select Apps.
Select ... next to the model-driven app or on the global command bar, and then select Live monitor.
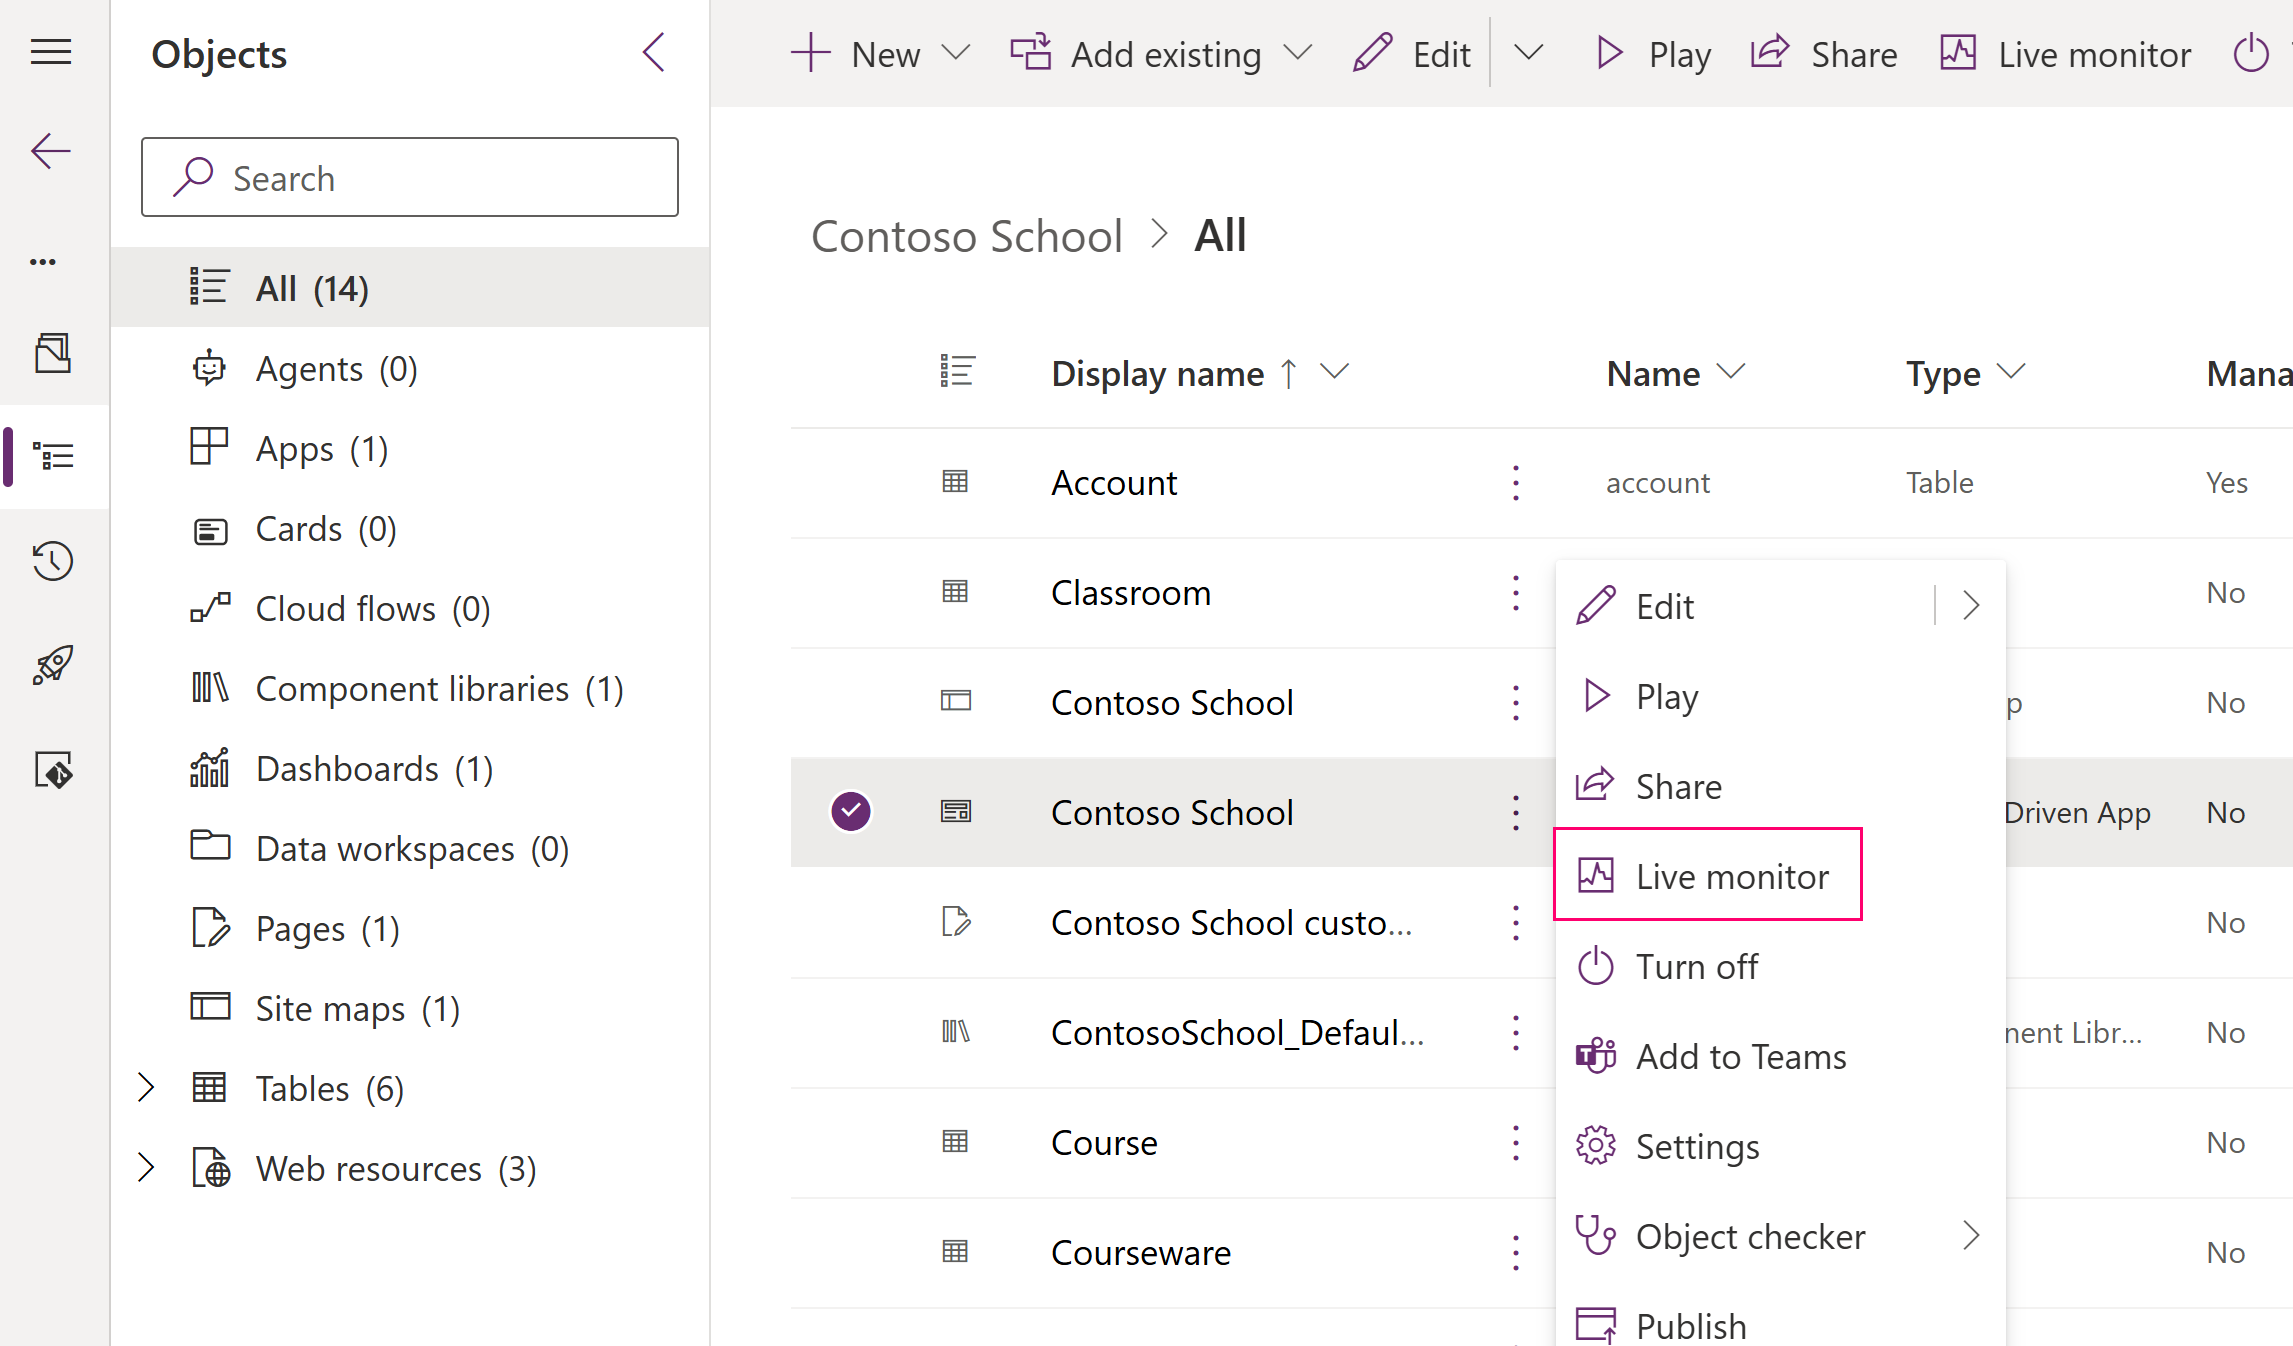
On the Live monitor browser tab that opens, select Play model-driven app on the command bar.
When prompted, select Join.
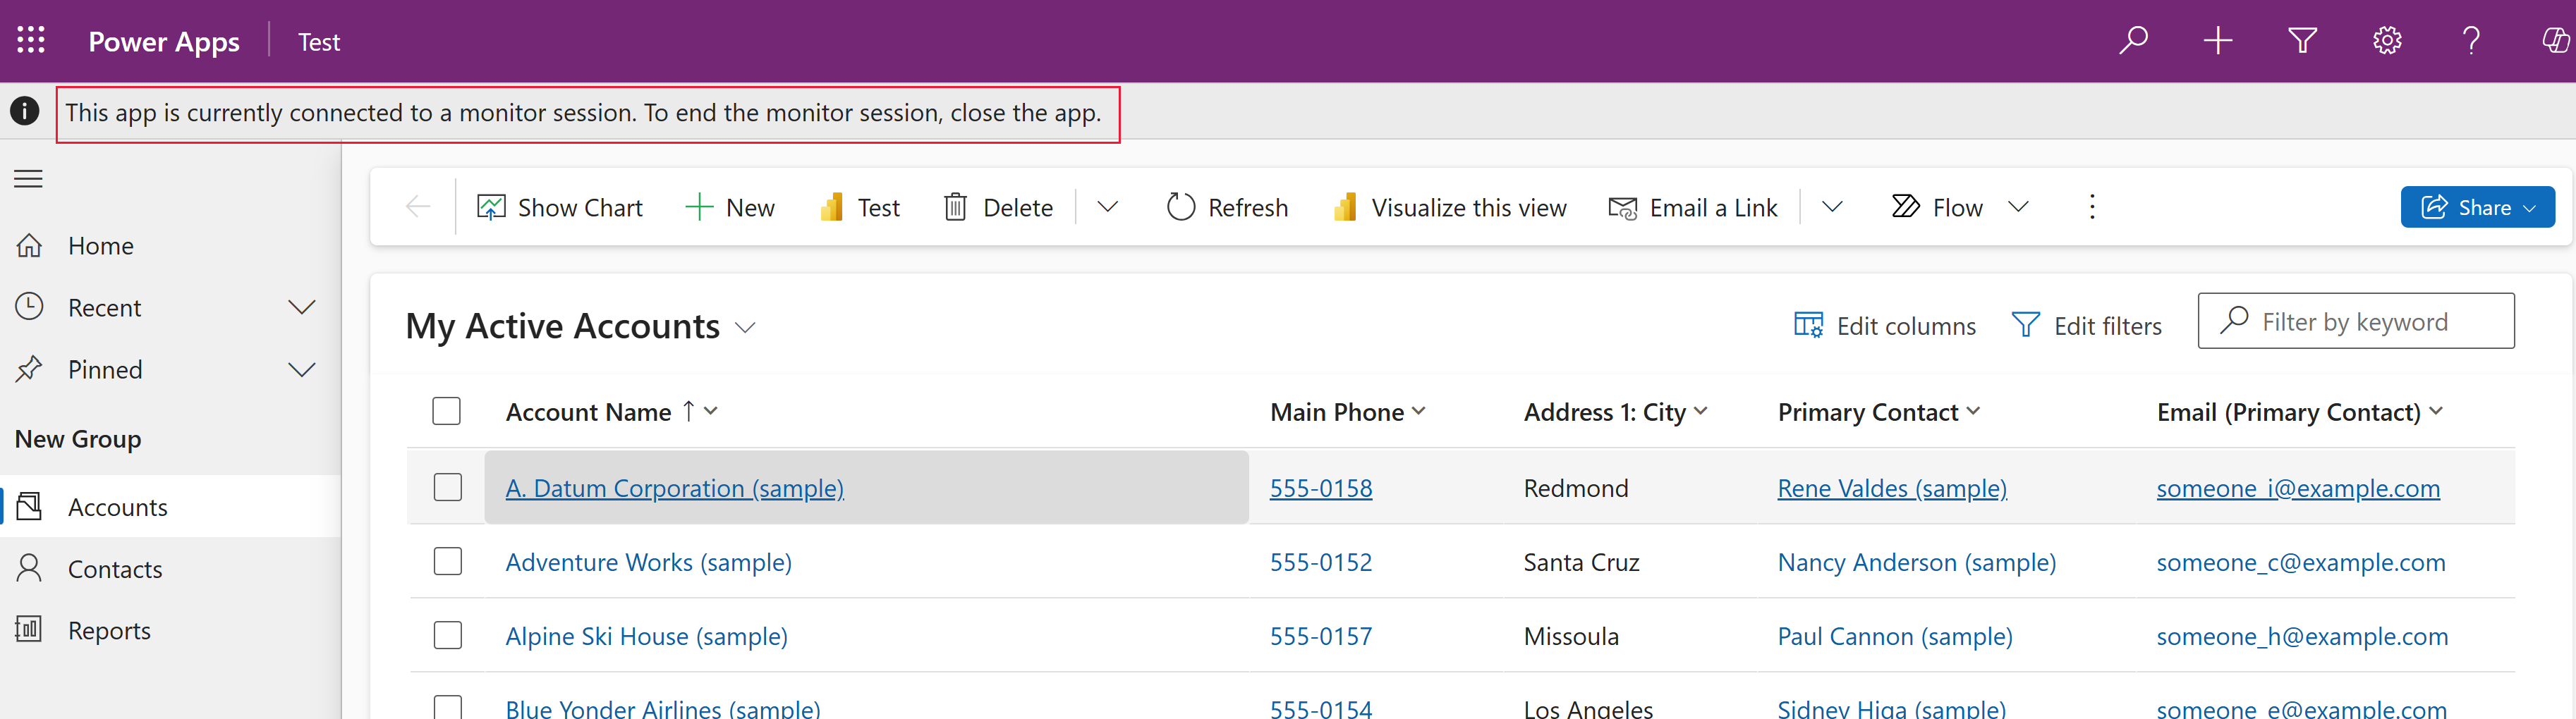
The app loads in a new browser tab with a message indicating the monitoring session. Switch back to the live monitor tab to view activity.

From a model-driven app
Play your model-driven app.
Add
&monitor=trueto the end of the URL in your web browser, and then refresh the page.Select Live monitor on the command bar.

Filter monitored activity
When you filter on a model-driven app custom page-related events in live monitor, you can get information about related tables, tables, controls, and components, such as on a custom page, in live monitor as your app runs.

For example, to filter on the custom page that uses the Gallery1 control, select the Control column header > Filter by, enter Gallery1, and then select Apply.
For more information about model-driven app monitoring, go to Debug a model-driven app with live monitor
Close a live monitor session
To close the monitoring session, close the browser tab where the monitored model-driven app is playing.
Next steps
Use live monitor to troubleshoot model-driven app form behavior