View and use Change Analysis (classic)
Important
Azure Monitor Change Analysis (classic) will be retired on October 31, 2025. The experience will be replaced by the Change Analysis API powered by Azure Resource Graph. Learn more about the future of Change Analysis (classic) and how to migrate to Resource Graph.
Change Analysis (classic) provides data for various management and troubleshooting scenarios to help you understand what changes to your application caused breaking issues.
View change data
View change data in various ways.
Access Change Analysis (classic) screens
You can access the Change Analysis (classic) overview portal under Azure Monitor, where you can view all changes and application dependency or resource insights. You can access these screens through two entry points.
Via the Azure Monitor home page
From the Azure portal home page, on the service menu, select Monitor.

On the Monitor Overview page, select the Change Analysis (classic) card.

Via search
In the Azure portal, search for Change Analysis (classic) to start the experience.

Select one or more subscriptions to view:
- All of the changes for the resources from the past 24 hours.
- Old and new values to provide insights at one glance.

Select a change to view the full Resource Manager snippet and other properties.

Send feedback from the Change Analysis (classic) pane.

Multiple subscription support
The UI supports selecting multiple subscriptions to view resource changes. Use the subscription filter.

View the Activity log change history
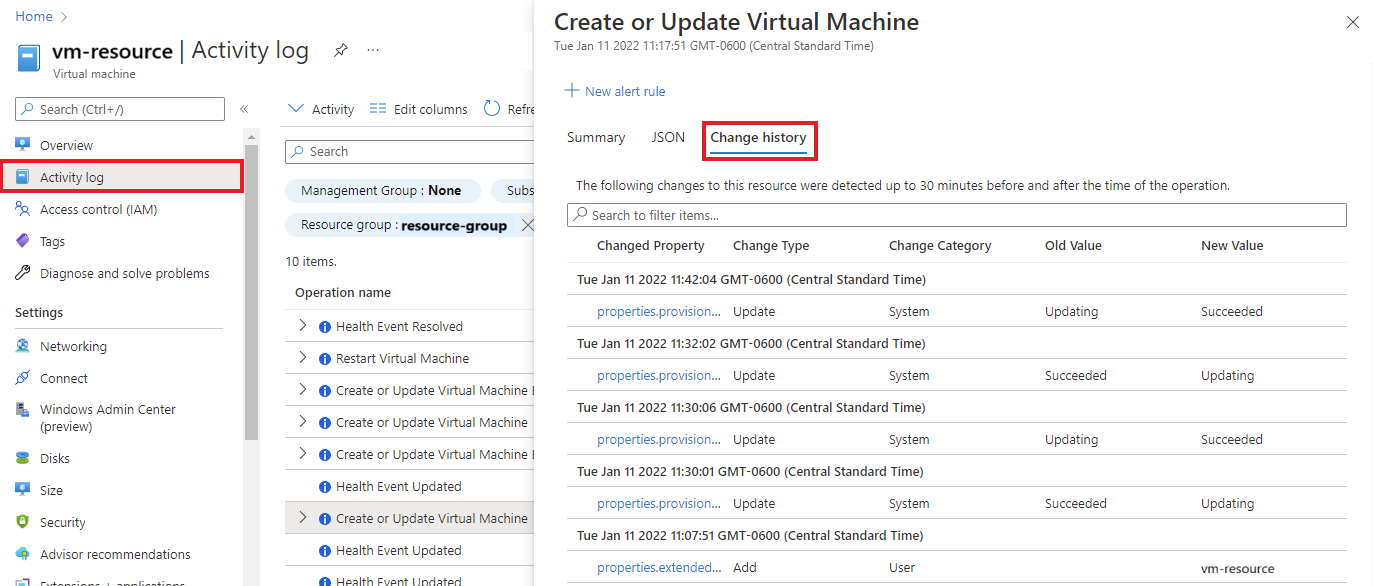
Use the View change history feature to call the Change Analysis (classic) back end to view changes associated with an operation. Changes that are returned include:
- Resource-level changes from Resource Graph.
- Resource properties from Azure Resource Manager.
- In-guest changes from a platform as a service (PaaS) service, such as a web app.
- From within your resource, on the service menu, select Activity log.
- Select a change from the list.
- Select the Change history tab.
- For Change Analysis (classic) to scan for changes in users' subscriptions, a resource provider must be registered. When you select the Change history tab, the tool automatically registers the
Microsoft.ChangeAnalysisresource provider.
After registration, you can immediately view changes from Resource Graph from the past 14 days. Changes from other sources are available approximately four hours after the subscription is activated.

View changes by using the Diagnose and solve problems tool
From the Overview page for your resource in the Azure portal, you can view change data by selecting Diagnose and solve problems on the service menu. As you enter the Diagnose and solve problems tool, the Microsoft.ChangeAnalysis resource provider is automatically registered.
Learn how to use the Diagnose and solve problems tool for:
Diagnose and solve problems tool for web apps
Change Analysis (classic) is:
- A standalone detector in the web app Diagnose and solve problems tool.
- Aggregated in the Application Crashes and Web App Down detectors.
You can view change data via the Web App Down and Application Crashes detectors. The graph summarizes:
- The change types over time.
- Details on those changes.
By default, the graph shows changes from within the past 24 hours to help with immediate problems.
Diagnose and solve problems tool for virtual machines
Change Analysis (classic) appears as an insight card in your virtual machine's Diagnose and solve problems tool. The insight card shows the number of changes or issues that a resource experienced within the past 72 hours.
- Within your virtual machine, on the service menu, select Diagnose and solve problems.
- Go to Troubleshooting tools.
- Scroll to the end of the troubleshooting options and select Analyze recent changes to view changes on the virtual machine.
Diagnose and solve problems tool for Azure SQL Database and other resources
You can view Change Analysis (classic) data for multiple Azure resources, but we highlight Azure SQL Database in these steps.
Within your resource, on the service menu, select Diagnose and solve problems.
Under Common problems, select View change details to view the filtered view from the Change Analysis (classic) standalone UI.

Activities that use Change Analysis (classic)
You have access to various activities with Change Analysis (classic).
Integrate with VM Insights
If you enabled VM Insights, you can view changes in your virtual machines that caused any spikes in a metric chart, such as CPU or memory.
Within your virtual machine, on the service menu, under Monitoring, select Insights.
Select the Performance tab.
Expand the property pane.

Select the Changes tab.
Select Investigate Changes to view change details in the Azure Monitor Change Analysis (classic) standalone UI.

Drill to Change Analysis (classic) logs
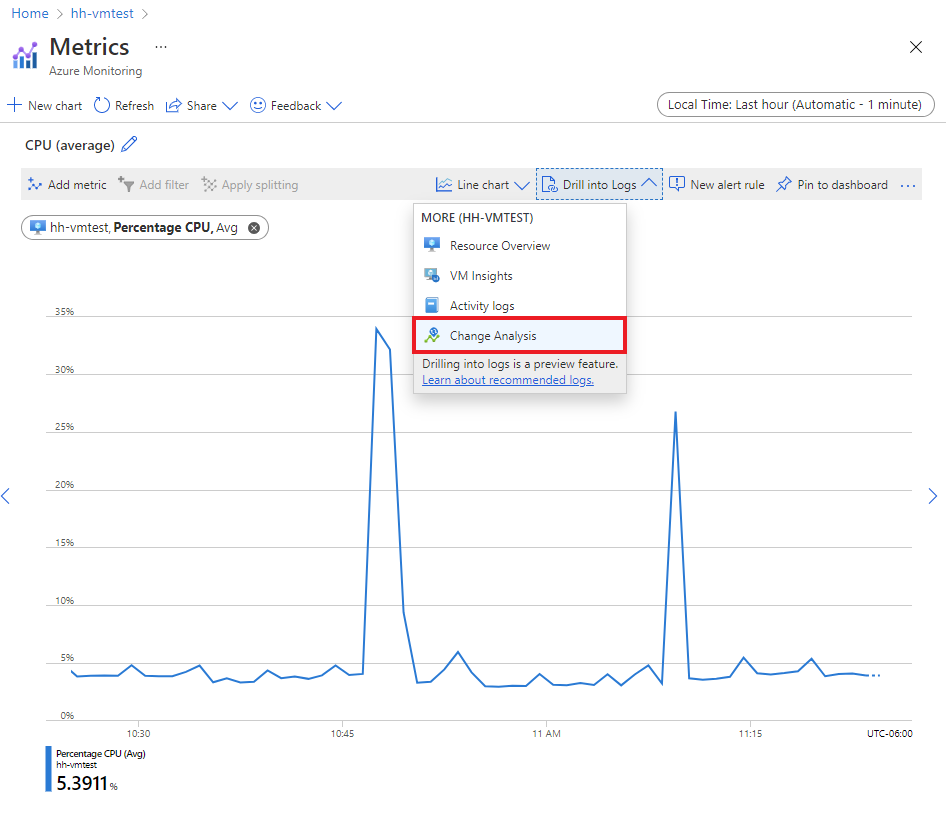
You can also drill to change logs via a chart that you created or pinned to your resource's Monitoring dashboard.
Go to the resource for which you want to view change logs.
On the Overview page for the resource, select the Monitoring tab.
Select a chart on the Key Metrics dashboard.

On the chart, select Drill into Logs and choose Change Analysis from the dropdown list to view it.

Browse by using custom filters and the search bar
Browsing through a long list of changes in the entire subscription is time consuming. With the Change Analysis (classic) custom filters and search capability, you can efficiently go to changes that are relevant to issues for troubleshooting. Then select Add Filter.

Filters
| Filter | Description |
|---|---|
| Subscription | This filter is in sync with the Azure portal subscription selector. It supports selection of multiple subscriptions. |
| Time range | Specifies how far back the UI displays changes, up to 14 days. By default, it's set to the past 24 hours. |
| Resource group | Select the resource group to scope the changes. By default, all resource groups are selected. |
| Change level | Controls which levels of changes to display. Levels include important, normal, and noisy. Important: Related to availability and security. Noisy: Read-only properties that are unlikely to cause any issues. By default, important and normal levels are selected. |
| Resource | Select Add filter to use this filter. Filter the changes to specific resources. It's helpful if you already know which resources to look at for changes. If the filter returns only 1,000 resources, see the corresponding solution in the troubleshooting guide. |
| Resource type | Select Add filter to use this filter. Filter the changes to specific resource types. |
Search bar
The search bar filters the changes according to the input keywords. Search bar results apply only to the changes loaded by the page already. They don't pull in results from the server side.
Pin and share a Change Analysis (classic) query to the Azure dashboard
Let's say you want to curate a change view on specific resources, like all virtual machine changes in your subscription, and include it in a report sent periodically. You can pin the view to an Azure dashboard for monitoring or sharing scenarios. If you want to share a specific change with your team members, you can use the share feature on the Change Details page.
Pin to the Azure dashboard
After you apply filters to the Change Analysis (classic) home page:
On the top menu, select Pin current filters.
Enter a name for the pin.
Select OK to proceed.

A side pane opens to configure the dashboard where you place your pin. You can select one of two dashboard types.
| Dashboard type | Description |
|---|---|
| Private | Only you can access a private dashboard. Choose this option if you're creating the pin for your own easy access to the changes. |
| Shared | A shared dashboard supports role-based access control for view or read access. Shared dashboards are created as a resource in your subscription with a region and resource group to host it. Choose this option if you're creating the pin to share with your team. |
Select an existing dashboard
If you already have a dashboard on which to place the pin:
- Select the Existing tab.
- Select either Private or Shared.
- Select the dashboard you want to use.
- If you selected Shared, select the subscription in which you want to place the dashboard.
- Select Pin.
Create a new dashboard
You can create a new dashboard for this pin.
- Select the Create new tab.
- Select either Private or Shared.
- Enter the name of the new dashboard.
- If you're creating a shared dashboard, enter the resource group and region information.
- Select Create and pin.
After the dashboard and pin are created, go to the Azure dashboard to view them.
- On the Azure portal home menu, select Dashboard.
- On the top menu, select Manage Sharing to handle access or stop sharing.
- Select the pin to go to the curated view of changes.
Share a single change with your team
On the Change Analysis (classic) home page, select a line of change to view details on the change.
- On the Changed properties page, on the top menu, select Share.
- On the Share Change Details pane, copy the deep link of the page and share it with your team in messages, emails, reports, or whichever communication channel your team prefers.
Related content
Learn how to troubleshoot problems in Change Analysis (classic).