Azure IoT Hub monitoring data reference
This article contains all the monitoring reference information for this service.
See Monitor Azure IoT for details on the data you can collect for IoT Hub and how to use it.
Metrics
This section lists all the automatically collected platform metrics for this service. These metrics are also part of the global list of all platform metrics supported in Azure Monitor.
For information on metric retention, see Azure Monitor Metrics overview.
Supported metrics for Microsoft.Devices/IoTHubs
The following table lists the metrics available for the Microsoft.Devices/IoTHubs resource type.
- All columns might not be present in every table.
- Some columns might be beyond the viewing area of the page. Select Expand table to view all available columns.
Table headings
- Category - The metrics group or classification.
- Metric - The metric display name as it appears in the Azure portal.
- Name in REST API - The metric name as referred to in the REST API.
- Unit - Unit of measure.
- Aggregation - The default aggregation type. Valid values: Average (Avg), Minimum (Min), Maximum (Max), Total (Sum), Count.
- Dimensions - Dimensions available for the metric.
- Time Grains - Intervals at which the metric is sampled. For example,
PT1Mindicates that the metric is sampled every minute,PT30Mevery 30 minutes,PT1Hevery hour, and so on. - DS Export- Whether the metric is exportable to Azure Monitor Logs via diagnostic settings. For information on exporting metrics, see Create diagnostic settings in Azure Monitor.
| Metric | Name in REST API | Unit | Aggregation | Dimensions | Time Grains | DS Export |
|---|---|---|---|---|---|---|
| C2D messages abandoned Number of cloud-to-device messages abandoned by the device |
c2d.commands.egress.abandon.success |
Count | Average, Minimum, Maximum, Total | <none> | PT1M | Yes |
| C2D message deliveries completed Number of cloud-to-device message deliveries completed successfully by the device |
c2d.commands.egress.complete.success |
Count | Average, Minimum, Maximum, Total | <none> | PT1M | Yes |
| C2D messages rejected Number of cloud-to-device messages rejected by the device |
c2d.commands.egress.reject.success |
Count | Average, Minimum, Maximum, Total | <none> | PT1M | Yes |
| Failed direct method invocations The count of all failed direct method calls. |
c2d.methods.failure |
Count | Average, Minimum, Maximum, Total | <none> | PT1M | Yes |
| Request size of direct method invocations The average, min, and max of all successful direct method requests. |
c2d.methods.requestSize |
Bytes | Average, Minimum, Maximum, Total | <none> | PT1M | Yes |
| Response size of direct method invocations The average, min, and max of all successful direct method responses. |
c2d.methods.responseSize |
Bytes | Average, Minimum, Maximum, Total | <none> | PT1M | Yes |
| Successful direct method invocations The count of all successful direct method calls. |
c2d.methods.success |
Count | Average, Minimum, Maximum, Total | <none> | PT1M | Yes |
| Failed twin reads from back end The count of all failed back-end-initiated twin reads. |
c2d.twin.read.failure |
Count | Average, Minimum, Maximum, Total | <none> | PT1M | Yes |
| Response size of twin reads from back end The average, min, and max of all successful back-end-initiated twin reads. |
c2d.twin.read.size |
Bytes | Average, Minimum, Maximum, Total | <none> | PT1M | Yes |
| Successful twin reads from back end The count of all successful back-end-initiated twin reads. |
c2d.twin.read.success |
Count | Average, Minimum, Maximum, Total | <none> | PT1M | Yes |
| Failed twin updates from back end The count of all failed back-end-initiated twin updates. |
c2d.twin.update.failure |
Count | Average, Minimum, Maximum, Total | <none> | PT1M | Yes |
| Size of twin updates from back end The average, min, and max size of all successful back-end-initiated twin updates. |
c2d.twin.update.size |
Bytes | Average, Minimum, Maximum, Total | <none> | PT1M | Yes |
| Successful twin updates from back end The count of all successful back-end-initiated twin updates. |
c2d.twin.update.success |
Count | Average, Minimum, Maximum, Total | <none> | PT1M | Yes |
| C2D Messages Expired Number of expired cloud-to-device messages |
C2DMessagesExpired |
Count | Average, Minimum, Maximum, Total | <none> | PT1M | Yes |
| Configuration Metrics Metrics for Configuration Operations |
configurations |
Count | Average, Minimum, Maximum, Total | <none> | PT1M | Yes |
| Connected devices Number of devices connected to your IoT hub |
connectedDeviceCount |
Count | Average, Maximum, Minimum | <none> | PT1M | No |
| Routing: messages delivered to messages/events The number of times IoT Hub routing successfully delivered messages to the built-in endpoint (messages/events). |
d2c.endpoints.egress.builtIn.events |
Count | Average, Minimum, Maximum, Total | <none> | PT1M | Yes |
| Routing: messages delivered to Event Hub The number of times IoT Hub routing successfully delivered messages to Event Hub endpoints. |
d2c.endpoints.egress.eventHubs |
Count | Average, Minimum, Maximum, Total | <none> | PT1M | Yes |
| Routing: messages delivered to Service Bus Queue The number of times IoT Hub routing successfully delivered messages to Service Bus queue endpoints. |
d2c.endpoints.egress.serviceBusQueues |
Count | Average, Minimum, Maximum, Total | <none> | PT1M | Yes |
| Routing: messages delivered to Service Bus Topic The number of times IoT Hub routing successfully delivered messages to Service Bus topic endpoints. |
d2c.endpoints.egress.serviceBusTopics |
Count | Average, Minimum, Maximum, Total | <none> | PT1M | Yes |
| Routing: messages delivered to storage The number of times IoT Hub routing successfully delivered messages to storage endpoints. |
d2c.endpoints.egress.storage |
Count | Average, Minimum, Maximum, Total | <none> | PT1M | Yes |
| Routing: blobs delivered to storage The number of times IoT Hub routing delivered blobs to storage endpoints. |
d2c.endpoints.egress.storage.blobs |
Count | Average, Minimum, Maximum, Total | <none> | PT1M | Yes |
| Routing: data delivered to storage The amount of data (bytes) IoT Hub routing delivered to storage endpoints. |
d2c.endpoints.egress.storage.bytes |
Bytes | Average, Minimum, Maximum, Total | <none> | PT1M | Yes |
| Routing: message latency for messages/events The average latency (milliseconds) between message ingress to IoT Hub and telemetry message ingress into the built-in endpoint (messages/events). |
d2c.endpoints.latency.builtIn.events |
MilliSeconds | Average, Minimum, Maximum | <none> | PT1M | Yes |
| Routing: message latency for Event Hub The average latency (milliseconds) between message ingress to IoT Hub and message ingress into an Event Hub endpoint. |
d2c.endpoints.latency.eventHubs |
MilliSeconds | Average, Minimum, Maximum | <none> | PT1M | Yes |
| Routing: message latency for Service Bus Queue The average latency (milliseconds) between message ingress to IoT Hub and telemetry message ingress into a Service Bus queue endpoint. |
d2c.endpoints.latency.serviceBusQueues |
MilliSeconds | Average, Minimum, Maximum | <none> | PT1M | Yes |
| Routing: message latency for Service Bus Topic The average latency (milliseconds) between message ingress to IoT Hub and telemetry message ingress into a Service Bus topic endpoint. |
d2c.endpoints.latency.serviceBusTopics |
MilliSeconds | Average, Minimum, Maximum | <none> | PT1M | Yes |
| Routing: message latency for storage The average latency (milliseconds) between message ingress to IoT Hub and telemetry message ingress into a storage endpoint. |
d2c.endpoints.latency.storage |
MilliSeconds | Average, Minimum, Maximum | <none> | PT1M | Yes |
| Routing: telemetry messages dropped The number of times messages were dropped by IoT Hub routing due to dead endpoints. This value does not count messages delivered to fallback route as dropped messages are not delivered there. |
d2c.telemetry.egress.dropped |
Count | Average, Minimum, Maximum, Total | <none> | PT1M | Yes |
| Routing: messages delivered to fallback The number of times IoT Hub routing delivered messages to the endpoint associated with the fallback route. |
d2c.telemetry.egress.fallback |
Count | Average, Minimum, Maximum, Total | <none> | PT1M | Yes |
| Routing: telemetry messages incompatible The number of times IoT Hub routing failed to deliver messages due to an incompatibility with the endpoint. This value does not include retries. |
d2c.telemetry.egress.invalid |
Count | Average, Minimum, Maximum, Total | <none> | PT1M | Yes |
| Routing: telemetry messages orphaned The number of times messages were orphaned by IoT Hub routing because they didn't match any routing rules (including the fallback rule). |
d2c.telemetry.egress.orphaned |
Count | Average, Minimum, Maximum, Total | <none> | PT1M | Yes |
| Routing: telemetry messages delivered The number of times messages were successfully delivered to all endpoints using IoT Hub routing. If a message is routed to multiple endpoints, this value increases by one for each successful delivery. If a message is delivered to the same endpoint multiple times, this value increases by one for each successful delivery. |
d2c.telemetry.egress.success |
Count | Average, Minimum, Maximum, Total | <none> | PT1M | Yes |
| Telemetry message send attempts Number of device-to-cloud telemetry messages attempted to be sent to your IoT hub |
d2c.telemetry.ingress.allProtocol |
Count | Average, Minimum, Maximum, Total | <none> | PT1M | Yes |
| Number of throttling errors Number of throttling errors due to device throughput throttles |
d2c.telemetry.ingress.sendThrottle |
Count | Average, Minimum, Maximum, Total | <none> | PT1M | Yes |
| Telemetry messages sent Number of device-to-cloud telemetry messages sent successfully to your IoT hub |
d2c.telemetry.ingress.success |
Count | Average, Minimum, Maximum, Total | <none> | PT1M | Yes |
| Failed twin reads from devices The count of all failed device-initiated twin reads. |
d2c.twin.read.failure |
Count | Average, Minimum, Maximum, Total | <none> | PT1M | Yes |
| Response size of twin reads from devices The average, min, and max of all successful device-initiated twin reads. |
d2c.twin.read.size |
Bytes | Average, Minimum, Maximum, Total | <none> | PT1M | Yes |
| Successful twin reads from devices The count of all successful device-initiated twin reads. |
d2c.twin.read.success |
Count | Average, Minimum, Maximum, Total | <none> | PT1M | Yes |
| Failed twin updates from devices The count of all failed device-initiated twin updates. |
d2c.twin.update.failure |
Count | Average, Minimum, Maximum, Total | <none> | PT1M | Yes |
| Size of twin updates from devices The average, min, and max size of all successful device-initiated twin updates. |
d2c.twin.update.size |
Bytes | Average, Minimum, Maximum, Total | <none> | PT1M | Yes |
| Successful twin updates from devices The count of all successful device-initiated twin updates. |
d2c.twin.update.success |
Count | Average, Minimum, Maximum, Total | <none> | PT1M | Yes |
| Total number of messages used Number of total messages used today |
dailyMessageQuotaUsed |
Count | Average, Minimum, Maximum | <none> | PT1M | Yes |
| Total device data usage Bytes transferred to and from any devices connected to IotHub |
deviceDataUsage |
Bytes | Average, Minimum, Maximum, Total | <none> | PT1M | Yes |
| Total device data usage (preview) Bytes transferred to and from any devices connected to IotHub |
deviceDataUsageV2 |
Bytes | Average, Minimum, Maximum, Total | <none> | PT1M | Yes |
| Connected devices (deprecated) Number of devices connected to your IoT hub |
devices.connectedDevices.allProtocol |
Count | Average, Minimum, Maximum, Total | <none> | PT1M | Yes |
| Total devices (deprecated) Number of devices registered to your IoT hub |
devices.totalDevices |
Count | Average, Minimum, Maximum, Total | <none> | PT1M | Yes |
| Event Grid deliveries The number of IoT Hub events published to Event Grid. Use the Result dimension for the number of successful and failed requests. EventType dimension shows the type of event (https://aka.ms/ioteventgrid). |
EventGridDeliveries |
Count | Average, Minimum, Maximum, Total | Result, EventType |
PT1M | Yes |
| Event Grid latency The average latency (milliseconds) from when the Iot Hub event was generated to when the event was published to Event Grid. This number is an average between all event types. Use the EventType dimension to see latency of a specific type of event. |
EventGridLatency |
MilliSeconds | Average, Minimum, Maximum | EventType |
PT1M | Yes |
| Failed job cancellations The count of all failed calls to cancel a job. |
jobs.cancelJob.failure |
Count | Average, Minimum, Maximum, Total | <none> | PT1M | Yes |
| Successful job cancellations The count of all successful calls to cancel a job. |
jobs.cancelJob.success |
Count | Average, Minimum, Maximum, Total | <none> | PT1M | Yes |
| Completed jobs The count of all completed jobs. |
jobs.completed |
Count | Average, Minimum, Maximum, Total | <none> | PT1M | Yes |
| Failed creations of method invocation jobs The count of all failed creation of direct method invocation jobs. |
jobs.createDirectMethodJob.failure |
Count | Average, Minimum, Maximum, Total | <none> | PT1M | Yes |
| Successful creations of method invocation jobs The count of all successful creation of direct method invocation jobs. |
jobs.createDirectMethodJob.success |
Count | Average, Minimum, Maximum, Total | <none> | PT1M | Yes |
| Failed creations of twin update jobs The count of all failed creation of twin update jobs. |
jobs.createTwinUpdateJob.failure |
Count | Average, Minimum, Maximum, Total | <none> | PT1M | Yes |
| Successful creations of twin update jobs The count of all successful creation of twin update jobs. |
jobs.createTwinUpdateJob.success |
Count | Average, Minimum, Maximum, Total | <none> | PT1M | Yes |
| Failed jobs The count of all failed jobs. |
jobs.failed |
Count | Average, Minimum, Maximum, Total | <none> | PT1M | Yes |
| Failed calls to list jobs The count of all failed calls to list jobs. |
jobs.listJobs.failure |
Count | Average, Minimum, Maximum, Total | <none> | PT1M | Yes |
| Successful calls to list jobs The count of all successful calls to list jobs. |
jobs.listJobs.success |
Count | Average, Minimum, Maximum, Total | <none> | PT1M | Yes |
| Failed job queries The count of all failed calls to query jobs. |
jobs.queryJobs.failure |
Count | Average, Minimum, Maximum, Total | <none> | PT1M | Yes |
| Successful job queries The count of all successful calls to query jobs. |
jobs.queryJobs.success |
Count | Average, Minimum, Maximum, Total | <none> | PT1M | Yes |
| Routing Delivery Message Size in Bytes (preview) The total size in bytes of messages delivered by IoT hub to an endpoint. You can use the EndpointName and EndpointType dimensions to view the size of the messages in bytes delivered to your different endpoints. The metric value increases for every message delivered, including if the message is delivered to multiple endpoints or if the message is delivered to the same endpoint multiple times. |
RoutingDataSizeInBytesDelivered |
Bytes | Average, Minimum, Maximum, Total | EndpointType, EndpointName, RoutingSource |
PT1M | Yes |
| Routing Deliveries (preview) The number of times IoT Hub attempted to deliver messages to all endpoints using routing. To see the number of successful or failed attempts, use the Result dimension. To see the reason of failure, like invalid, dropped, or orphaned, use the FailureReasonCategory dimension. You can also use the EndpointName and EndpointType dimensions to understand how many messages were delivered to your different endpoints. The metric value increases by one for each delivery attempt, including if the message is delivered to multiple endpoints or if the message is delivered to the same endpoint multiple times. |
RoutingDeliveries |
Count | Average, Minimum, Maximum, Total | EndpointType, EndpointName, FailureReasonCategory, Result, RoutingSource |
PT1M | Yes |
| Routing Delivery Latency (preview) The average latency (milliseconds) between message ingress to IoT Hub and telemetry message ingress into an endpoint. You can use the EndpointName and EndpointType dimensions to understand the latency to your different endpoints. |
RoutingDeliveryLatency |
MilliSeconds | Average, Minimum, Maximum | EndpointType, EndpointName, RoutingSource |
PT1M | Yes |
| Total devices Number of devices registered to your IoT hub |
totalDeviceCount |
Count | Average, Maximum, Minimum | <none> | PT1M | No |
| Failed twin queries The count of all failed twin queries. |
twinQueries.failure |
Count | Average, Minimum, Maximum, Total | <none> | PT1M | Yes |
| Twin queries result size The average, min, and max of the result size of all successful twin queries. |
twinQueries.resultSize |
Bytes | Average, Minimum, Maximum, Total | <none> | PT1M | Yes |
| Successful twin queries The count of all successful twin queries. |
twinQueries.success |
Count | Average, Minimum, Maximum, Total | <none> | PT1M | Yes |
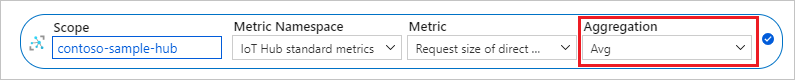
Supported aggregations
The Aggregation Type column in the table corresponds to the default aggregation that is used when the metric is selected for a chart or alert.
For most metrics, all aggregation types are valid. For count metrics with a Unit column value of Count, only some aggregations are valid. Count metrics can be one of two types:
For Single-point count metrics, IoT Hub registers a single data point (essentially a 1) every time the measured operation occurs. Azure Monitor then sums these data points over the specified granularity. Examples of Single-point metrics are Telemetry messages sent and C2D message deliveries completed. For these metrics, the only relevant aggregation type is Total (Sum). The portal allows you to choose minimum, maximum, and average. These values are always 1.
For Snapshot count metrics, IoT Hub registers a total count when the measured operation occurs. Currently, there are three Snapshot metrics emitted by IoT Hub: Total number of messages used, Total devices, and Connected devices. Because these metrics present a "total" quantity every time, summing them over the specified granularity makes no sense. Azure Monitor limits you to selecting average, minimum, and maximum for the aggregation type for these metrics.
Metric dimensions
For information about what metric dimensions are, see Multi-dimensional metrics.
This service has the following dimensions associated with its metrics.
| Dimension Name | Description |
|---|---|
| EndpointName | The endpoint name |
| EndpointType | eventHubs, serviceBusQueues, cosmosDB, serviceBusTopics, builtin, or blobStorage |
| EventType | Microsoft.Devices.DeviceCreated, Microsoft.Devices.DeviceDeleted, Microsoft.Devices.DeviceConnected, Microsoft.Devices.DeviceDisconnected, or Microsoft.Devices.DeviceTelemetry For more information, see Event types. |
| FailureReasonCategory | One of the following values: invalid, dropped, orphaned, or null. |
| Result | Either success or failure |
| RoutingSource | Device Messages, Twin Change Events, Device Lifecycle Events |
Metrics display name and aggregation
The following tables provide more information about the metrics described in the preceding table. They show the IoT Hub platform metrics by general category and list metrics by their display name as assigned in the Azure portal.
Cloud to device command metrics:
| Metric display name | Metric | Unit | Description |
|---|---|---|---|
| C2D Messages Expired | C2DMessagesExpired | Count | Number of expired cloud-to-device messages |
| C2D message deliveries completed | c2d.commands.egress.complete.success | Count | Number of cloud-to-device message deliveries completed successfully by the device |
| C2D messages abandoned | c2d.commands.egress.abandon.success | Count | Number of cloud-to-device messages abandoned by the device |
| C2D messages rejected | c2d.commands.egress.reject.success | Count | Number of cloud-to-device messages rejected by the device |
For metrics with a Unit value of Count, only total (sum) aggregation is valid. Minimum, maximum, and average aggregations always return 1. For more information, see Supported aggregations.
Cloud to device direct methods metrics:
| Metric display name | Metric | Unit | Description |
|---|---|---|---|
| Failed direct method invocations | c2d.methods.failure | Count | The count of all failed direct method calls. |
| Request size of direct method invocations | c2d.methods.requestSize | Bytes | The count of all successful direct method requests. |
| Response size of direct method invocations | c2d.methods.responseSize | Bytes | The count of all successful direct method responses. |
| Successful direct method invocations | c2d.methods.success | Count | The count of all successful direct method calls. |
For metrics with a Unit value of Count only total (sum) aggregation is valid. Minimum, maximum, and average aggregations always return 1. For more information, see Supported aggregations.
Cloud to device twin operations metrics:
| Metric display name | Metric | Unit | Description |
|---|---|---|---|
| Failed twin reads from back end | c2d.twin.read.failure | Count | The count of all failed back-end-initiated twin reads. |
| Failed twin updates from back end | c2d.twin.update.failure | Count | The count of all failed back-end-initiated twin updates. |
| Response size of twin reads from back end | c2d.twin.read.size | Bytes | The count of all successful back-end-initiated twin reads. |
| Size of twin updates from back end | c2d.twin.update.size | Bytes | The total size of all successful back-end-initiated twin updates. |
| Successful twin reads from back end | c2d.twin.read.success | Count | The count of all successful back-end-initiated twin reads. |
| Successful twin updates from back end | c2d.twin.update.success | Count | The count of all successful back-end-initiated twin updates. |
For metrics with a Unit value of Count, only total (sum) aggregation is valid. Minimum, maximum, and average aggregations always return 1. For more information, see Supported aggregations.
Configurations metrics:
| Metric display name | Metric | Unit | Description |
|---|---|---|---|
| Configuration Metrics | configurations | Count | Number of total CRUD operations performed for device configuration and IoT Edge deployment, on a set of target devices. Included are the number of operations that modify the device twin or module twin because of these configurations. |
For metrics with a Unit value of Count, only total (sum) aggregation is valid. Minimum, maximum, and average aggregations always return 1. For more information, see Supported aggregations.
Daily quota metrics:
| Metric display name | Metric | Unit | Description |
|---|---|---|---|
| Total device data usage | deviceDataUsage | Bytes | Bytes transferred to and from any devices connected to IotHub |
| Total device data usage (preview) | deviceDataUsageV2 | Total | Bytes transferred to and from any devices connected to IotHub |
| Total number of messages used | dailyMessageQuotaUsed | Count | Number of total messages used today. A cumulative value that is reset to zero at 00:00 UTC every day. |
For Total number of messages used, only minimum, maximum, and average aggregations are supported. For more information, see Supported aggregations.
Device metrics:
| Metric display name | Metric | Unit | Description |
|---|---|---|---|
| Total devices (deprecated) | devices.totalDevices | Count | Number of devices registered to your IoT hub |
| Connected devices (deprecated) | devices.connectedDevices.allProtocol | Count | Number of devices connected to your IoT hub |
| Total devices | totalDeviceCount | Count | Number of devices registered to your IoT hub |
| Connected devices | connectedDeviceCount | Count | Number of devices connected to your IoT hub |
For Total devices (deprecated) and Connected devices (deprecated), only total (sum) aggregation is valid. Minimum, maximum, and average aggregations always return 1. For more information, see Supported aggregations.
For Total devices and Connected devices, only minimum, maximum, and average aggregations are valid. For more information, see Supported aggregations.
Total devices and Connected devices aren't exportable via diagnostic settings.
Device telemetry metrics:
| Metric display name | Metric | Unit | Description |
|---|---|---|---|
| Number of throttling errors | d2c.telemetry.ingress.sendThrottle | Count | Number of throttling errors due to device throughput throttles |
| Telemetry 'message send' attempts | d2c.telemetry.ingress.allProtocol | Count | Number of device-to-cloud telemetry messages attempted to be sent to your IoT hub |
| Telemetry messages sent | d2c.telemetry.ingress.success | Count | Number of device-to-cloud telemetry messages sent successfully to your IoT hub |
For metrics with a Unit value of Count, only total (sum) aggregation is valid. Minimum, maximum, and average aggregations always return 1. For more information, see Supported aggregations.
Device to cloud twin operations metrics:
| Metric display name | Metric | Unit | Description |
|---|---|---|---|
| Failed twin reads from devices | d2c.twin.read.failure | Count | The count of all failed device-initiated twin reads. |
| Failed twin updates from devices | d2c.twin.update.failure | Count | The count of all failed device-initiated twin updates. |
| Response size of twin reads from devices | d2c.twin.read.size | Bytes | The number of all successful device-initiated twin reads. |
| Size of twin updates from devices | d2c.twin.update.size | Bytes | The total size of all successful device-initiated twin updates. |
| Successful twin reads from devices | d2c.twin.read.success | Count | The count of all successful device-initiated twin reads. |
| Successful twin updates from devices | d2c.twin.update.success | Count | The count of all successful device-initiated twin updates. |
For metrics with a Unit value of Count, only total (sum) aggregation is valid. Minimum, maximum, and average aggregations always return 1. For more information, see Supported aggregations.
Event Grid metrics:
| Metric display name | Metric | Unit | Description |
|---|---|---|---|
| Event Grid deliveries | EventGridDeliveries | Count | The number of IoT Hub events published to Event Grid. Use the Result dimension for the number of successful and failed requests. EventType dimension shows the type of event (https://aka.ms/ioteventgrid). |
| Event Grid latency | EventGridLatency | Milliseconds | The average latency (milliseconds) from when the Iot Hub event was generated to when the event was published to Event Grid. This number is an average between all event types. Use the EventType dimension to see latency of a specific type of event. |
For metrics with a Unit value of Count, only total (sum) aggregation is valid. Minimum, maximum, and average aggregations always return 1. For more information, see Supported aggregations.
Jobs metrics:
| Metric display name | Metric | Unit | Description |
|---|---|---|---|
| Completed jobs | jobs.completed | Count | The count of all completed jobs. |
| Failed calls to list jobs | jobs.listJobs.failure | Count | The count of all failed calls to list jobs. |
| Failed creations of method invocation jobs | jobs.createDirectMethodJob.failure | Count | The count of all failed creation of direct method invocation jobs. |
| Failed creations of twin update jobs | jobs.createTwinUpdateJob.failure | Count | The count of all failed creation of twin update jobs. |
| Failed job cancellations | jobs.cancelJob.failure | Count | The count of all failed calls to cancel a job. |
| Failed job queries | jobs.queryJobs.failure | Count | The count of all failed calls to query jobs. |
| Failed jobs | jobs.failed | Count | The count of all failed jobs. |
| Successful calls to list jobs | jobs.listJobs.success | Count | The count of all successful calls to list jobs. |
| Successful creations of method invocation jobs | jobs.createDirectMethodJob.success | Count | The count of all successful creation of direct method invocation jobs. |
| Successful creations of twin update jobs | jobs.createTwinUpdateJob. success |
Count | The count of all successful creation of twin update jobs. |
| Successful job cancellations | jobs.cancelJob.success | Count | The count of all successful calls to cancel a job. |
| Successful job queries | jobs.queryJobs.success | Count | The count of all successful calls to query jobs. |
For metrics with a Unit value of Count, only total (sum) aggregation is valid. Minimum, maximum, and average aggregations always return 1. For more information, see Supported aggregations.
Routing metrics:
| Metric display name | Metric | Unit | Description |
|---|---|---|---|
| Routing Deliveries (preview) | RoutingDeliveries | Count | The routing delivery metric. Use the dimensions to identify the delivery status for a specific endpoint or for a specific routing source. |
| Routing Delivery Message Size In Bytes (preview) | RoutingDataSizeInBytesDelivered | Bytes | The total number of bytes routed by IoT Hub to custom endpoint and built-in endpoint. Use the dimensions to identify data size routed to a specific endpoint or for a specific routing source. |
| Routing Delivery Latency (preview) | RoutingDeliveryLatency | Milliseconds | The routing delivery latency metric. Use the dimensions to identify the latency for a specific endpoint or for a specific routing source. |
| Routing: blobs delivered to storage | d2c.endpoints.egress.storage.blobs | Count | The number of times IoT Hub routing delivered blobs to storage endpoints. |
| Routing: data delivered to storage | d2c.endpoints.egress.storage.bytes | Bytes | The amount of data (bytes) IoT Hub routing delivered to storage endpoints. |
| Routing: message latency for Event Hubs | d2c.endpoints.latency.eventHubs | Milliseconds | The average latency (milliseconds) between message ingress to IoT Hub and message ingress into custom endpoints of type Event Hubs. Messages routes to built-in endpoint (events) aren't included. |
| Routing: message latency for Service Bus Queue | d2c.endpoints.latency.serviceBusQueues | Milliseconds | The average latency (milliseconds) between message ingress to IoT Hub and message ingress into a Service Bus queue endpoint. |
| Routing: message latency for Service Bus Topic | d2c.endpoints.latency.serviceBusTopics | Milliseconds | The average latency (milliseconds) between message ingress to IoT Hub and message ingress into a Service Bus topic endpoint. |
| Routing: message latency for messages/events | d2c.endpoints.latency.builtIn.events | Milliseconds | The average latency (milliseconds) between message ingress to IoT Hub and message ingress into the built-in endpoint (messages/events) and fallback route. |
| Routing: message latency for storage | d2c.endpoints.latency.storage | Milliseconds | The average latency (milliseconds) between message ingress to IoT Hub and message ingress into a storage endpoint. |
| Routing: messages delivered to Event Hubs | d2c.endpoints.egress.eventHubs | Count | The number of times IoT Hub routing successfully delivered messages to custom endpoints of type Event Hubs. Messages routes to built-in endpoint (events) aren't included. |
| Routing: messages delivered to Service Bus Queue | d2c.endpoints.egress.serviceBusQueues | Count | The number of times IoT Hub routing successfully delivered messages to Service Bus queue endpoints. |
| Routing: messages delivered to Service Bus Topic | d2c.endpoints.egress.serviceBusTopics | Count | The number of times IoT Hub routing successfully delivered messages to Service Bus topic endpoints. |
| Routing: messages delivered to fallback | d2c.telemetry.egress.fallback | Count | The number of times IoT Hub routing delivered messages to the endpoint associated with the fallback route. |
| Routing: messages delivered to messages/events | d2c.endpoints.egress.builtIn.events | Count | The number of times IoT Hub routing successfully delivered messages to the built-in endpoint (messages/events) and fallback route. |
| Routing: messages delivered to storage | d2c.endpoints.egress.storage | Count | The number of times IoT Hub routing successfully delivered messages to storage endpoints. |
| Routing: telemetry messages delivered | d2c.telemetry.egress.success | Count | The number of times messages were successfully delivered to all endpoints using IoT Hub routing. If a message is routed to multiple endpoints, this value increases by one for each successful delivery. If a message is delivered to the same endpoint multiple times, this value increases by one for each successful delivery. |
| Routing: telemetry messages dropped | d2c.telemetry.egress.dropped | Count | The number of times IoT Hub routing drops messages due to dead endpoints. This value doesn't count messages delivered to fallback route as dropped messages aren't delivered there. |
| Routing: telemetry messages incompatible | d2c.telemetry.egress.invalid | Count | The number of times IoT Hub routing failed to deliver messages due to an incompatibility with the endpoint. A message is incompatible with an endpoint when Iot Hub attempts to deliver the message to an endpoint and it fails with a nontransient error. Invalid messages aren't retried. This value doesn't include retries. |
| Routing: telemetry messages orphaned | d2c.telemetry.egress.orphaned | Count | The number of times IoT Hub routing orphans messages because they didn't match any routing query, when fallback route is disabled. |
For metrics with a Unit value of Count, only total (sum) aggregation is valid. Minimum, maximum, and average aggregations always return 1. For more information, see Supported aggregations.
Twin query metrics:
| Metric display name | Metric | Unit | Description |
|---|---|---|---|
| Failed twin queries | twinQueries.failure | Count | The count of all failed twin queries. |
| Successful twin queries | twinQueries.success | Count | The count of all successful twin queries. |
| Twin queries result size | twinQueries.resultSize | Bytes | The total of the result size of all successful twin queries. |
For metrics with a Unit value of Count, only total (sum) aggregation is valid. Minimum, maximum, and average aggregations always return 1. For more information, see Supported aggregations.
Resource logs
This section lists the types of resource logs you can collect for this service. The section pulls from the list of all resource logs category types supported in Azure Monitor.
Supported resource logs for Microsoft.Devices/IotHubs
| Category | Category display name | Log table | Supports basic log plan | Supports ingestion-time transformation | Example queries | Costs to export |
|---|---|---|---|---|---|---|
C2DCommands |
C2D Commands | AzureDiagnostics Logs from multiple Azure resources. |
No | No | Queries | No |
C2DTwinOperations |
C2D Twin Operations | AzureDiagnostics Logs from multiple Azure resources. |
No | No | Queries | No |
Configurations |
Configurations | AzureDiagnostics Logs from multiple Azure resources. |
No | No | Queries | No |
Connections |
Connections | AzureDiagnostics Logs from multiple Azure resources. |
No | No | Queries | No |
D2CTwinOperations |
D2CTwinOperations | AzureDiagnostics Logs from multiple Azure resources. |
No | No | Queries | No |
DeviceIdentityOperations |
Device Identity Operations | AzureDiagnostics Logs from multiple Azure resources. |
No | No | Queries | No |
DeviceStreams |
Device Streams (Preview) | AzureDiagnostics Logs from multiple Azure resources. |
No | No | Queries | No |
DeviceTelemetry |
Device Telemetry | AzureDiagnostics Logs from multiple Azure resources. |
No | No | Queries | No |
DirectMethods |
Direct Methods | AzureDiagnostics Logs from multiple Azure resources. |
No | No | Queries | No |
DistributedTracing |
Distributed Tracing (Preview) | No | No | No | ||
FileUploadOperations |
File Upload Operations | AzureDiagnostics Logs from multiple Azure resources. |
No | No | Queries | No |
JobsOperations |
Jobs Operations | AzureDiagnostics Logs from multiple Azure resources. |
No | No | Queries | No |
Routes |
Routes | AzureDiagnostics Logs from multiple Azure resources. |
No | No | Queries | No |
TwinQueries |
Twin Queries | AzureDiagnostics Logs from multiple Azure resources. |
No | No | Queries | No |
The following sections list the resource log category types and schemas collected for Azure IoT Hub. Events are emitted only for errors in some categories.
Cloud-to-device commands category
The cloud-to-device commands category tracks errors that occur at the IoT hub and are related to the cloud-to-device message pipeline. This category includes errors that occur from:
- Sending cloud-to-device messages (like unauthorized sender errors),
- Receiving cloud-to-device messages (like delivery count exceeded errors), and
- Receiving cloud-to-device message feedback (like feedback expired errors).
This category doesn't catch errors when the cloud-to-device message is delivered successfully but then improperly handled by the device.
{
    "records":
    [
        {
            "time": " UTC timestamp",
            "resourceId": "Resource Id",
            "operationName": "messageExpired",
            "category": "C2DCommands",
            "level": "Error",
            "resultType": "Event status",
            "resultDescription": "MessageDescription",
            "properties": "{\"deviceId\":\"<deviceId>\",\"messageId\":\"<messageId>\",\"messageSizeInBytes\":\"<messageSize>\",\"protocol\":\"Amqp\",\"deliveryAcknowledgement\":\"<None, NegativeOnly, PositiveOnly, Full>\",\"deliveryCount\":\"0\",\"expiryTime\":\"<timestamp>\",\"timeInSystem\":\"<timeInSystem>\",\"ttl\":<ttl>, \"EventProcessedUtcTime\":\"<UTC timestamp>\",\"EventEnqueuedUtcTime\":\"<UTC timestamp>\", \"maskedIpAddress\": \"<maskedIpAddress>\", \"statusCode\": \"4XX\"}",
            "location": "Resource location"
        }
    ]
}
Cloud-to-device twin operations category
The cloud-to-device twin operations category tracks service-initiated events on device twins. These operations can include get twin, update or replace tags, and update or replace desired properties.
{
    "records":
    [
        {
            "time": "UTC timestamp",
            "resourceId": "Resource Id",
            "operationName": "read",
            "category": "C2DTwinOperations",
            "level": "Information",
            "durationMs": "1",
            "properties": "{\"deviceId\":\"<deviceId>\",\"sdkVersion\":\"<sdkVersion>\",\"messageSize\":\"<messageSize>\"}",
            "location": "Resource location"
        }
    ]
}
Device-to-cloud twin operations category
The device-to-cloud twin operations category tracks device-initiated events on device twins. These operations can include get twin, update reported properties, and subscribe to desired properties.
{
    "records":
    [
        {
            "time": "UTC timestamp",
            "resourceId": "Resource Id",
            "operationName": "update",
            "category": "D2CTwinOperations",
            "level": "Information",
            "durationMs": "1",
            "properties": "{\"deviceId\":\"<deviceId>\",\"protocol\":\"<protocol>\",\"authenticationType\":\"{\\\"scope\\\":\\\"device\\\",\\\"type\\\":\\\"sas\\\",\\\"issuer\\\":\\\"iothub\\\",\\\"acceptingIpFilterRule\\\":null}\"}",
            "location": "Resource location"
        }
    ]
}
Configurations category
IoT Hub configuration logs track events and error for the Automatic Device Management feature set.
{
    "records":
    [
         {
             "time": "2019-09-24T17:21:52Z",
             "resourceId": "Resource Id",
             "operationName": "ReadManyConfigurations",
             "category": "Configurations",
             "resultType": "",
             "resultDescription": "",
             "level": "Information",
             "durationMs": "17",
             "properties": "{\"configurationId\":\"\",\"sdkVersion\":\"2018-06-30\",\"messageSize\":\"0\",\"statusCode\":null}",
             "location": "southcentralus"
         }
    ]
}
Connections category
The connections category tracks device connect and disconnect events from an IoT hub and errors. This category is useful for identifying unauthorized connection attempts and or alerting when you lose connection to devices.
For reliable connection status of devices, see Monitor device connection status.
{
   "records":
   [
        {
            "time": " UTC timestamp",
            "resourceId": "Resource Id",
            "operationName": "deviceConnect",
            "category": "Connections",
            "level": "Information",
            "properties": "{\"deviceId\":\"<deviceId>\",\"sdkVersion\":\"<sdkVersion>\",\"protocol\":\"<protocol>\",\"authType\":\"{\\\"scope\\\":\\\"device\\\",\\\"type\\\":\\\"sas\\\",\\\"issuer\\\":\\\"iothub\\\",\\\"acceptingIpFilterRule\\\":null}\",\"maskedIpAddress\":\"<maskedIpAddress>\"}",
            "location": "Resource location"
        }
    ]
}
For detailed information about using connections logs to monitor device connectivity, see Monitor, diagnose, and troubleshoot device connectivity to Azure IoT Hub.
Device identity operations category
The device identity operations category tracks errors that occur when you attempt to create, update, or delete an entry in your IoT hub's identity registry. Tracking this category is useful for provisioning scenarios.
{
    "records":
    [
        {
            "time": "UTC timestamp",
            "resourceId": "Resource Id",
            "operationName": "get",
            "category": "DeviceIdentityOperations",
            "level": "Error",
            "resultType": "Event status",
            "resultDescription": "MessageDescription",
            "properties": "{\"maskedIpAddress\":\"<maskedIpAddress>\",\"deviceId\":\"<deviceId>\", \"statusCode\":\"4XX\"}",
            "location": "Resource location"
        }
    ]
}
Device streams category (preview)
The device streams category tracks request-response interactions sent to individual devices.
{
    "records":
    [
         {
             "time": "2019-09-19T11:12:04Z",
             "resourceId": "Resource Id",
             "operationName": "invoke",
             "category": "DeviceStreams",
             "resultType": "",
             "resultDescription": "",
             "level": "Information",
             "durationMs": "74",
             "properties": "{\"deviceId\":\"myDevice\",\"moduleId\":\"myModule\",\"sdkVersion\":\"2019-05-01-preview\",\"requestSize\":\"3\",\"responseSize\":\"5\",\"statusCode\":null,\"requestName\":\"myRequest\",\"direction\":\"c2d\"}",
             "location": "Central US"
         }
    ]
}
Device telemetry category
The device telemetry category tracks errors that occur at the IoT hub and are related to the telemetry pipeline. This category includes errors that occur when sending telemetry events (such as throttling) and receiving telemetry events (such as unauthorized reader). This category can't catch errors caused by code running on the device itself.
{
    "records":
    [
        {
            "time": "UTC timestamp",
            "resourceId": "Resource Id",
            "operationName": "ingress",
            "category": "DeviceTelemetry",
            "level": "Error",
            "resultType": "Event status",
            "resultDescription": "MessageDescription",
            "properties": "{\"deviceId\":\"<deviceId>\",\"batching\":\"0\",\"messageSizeInBytes\":\"<messageSizeInBytes>\",\"EventProcessedUtcTime\":\"<UTC timestamp>\",\"EventEnqueuedUtcTime\":\"<UTC timestamp>\",\"partitionId\":\"1\"}",
            "location": "Resource location"
        }
    ]
}
Direct methods category
The direct methods category tracks request-response interactions sent to individual devices. These requests are initiated in the cloud.
{
    "records":
    [
        {
            "time": "UTC timestamp",
            "resourceId": "Resource Id",
            "operationName": "send",
            "category": "DirectMethods",
            "level": "Information",
            "durationMs": "1",
            "properties": "{\"deviceId\":<messageSize>, \"RequestSize\": 1, \"ResponseSize\": 1, \"sdkVersion\": \"2017-07-11\"}",
            "location": "Resource location"
        }
    ]
}
Distributed tracing category (preview)
The distributed tracing category tracks the correlation IDs for messages that carry the trace context header. To fully enable these logs, client-side code must be updated by following Analyze and diagnose IoT applications end-to-end with IoT Hub distributed tracing (preview).
The correlationId conforms to the W3C Trace Context proposal, where it contains a trace-id and a span-id.
IoT Hub D2C (device-to-cloud) logs
IoT Hub records this log when a message containing valid trace properties arrives at IoT Hub.
{
    "records":
    [
        {
            "time": "UTC timestamp",
            "resourceId": "Resource Id",
            "operationName": "DiagnosticIoTHubD2C",
            "category": "DistributedTracing",
            "correlationId": "00-8cd869a412459a25f5b4f31311223344-0144d2590aacd909-01",
            "level": "Information",
            "resultType": "Success",
            "resultDescription":"Receive message success",
            "durationMs": "",
            "properties": "{\"messageSize\": 1, \"deviceId\":\"<deviceId>\", \"callerLocalTimeUtc\": : \"2017-02-22T03:27:28.633Z\", \"calleeLocalTimeUtc\": \"2017-02-22T03:27:28.687Z\"}",
            "location": "Resource location"
        }
    ]
}
Here, durationMs isn't calculated as IoT Hub's clock might not be in sync with the device clock, and thus a duration calculation can be misleading. We recommend writing logic using the timestamps in the properties section to capture spikes in device-to-cloud latency.
| Property | Type | Description |
|---|---|---|
| messageSize | Integer | The size of device-to-cloud message in bytes |
| deviceId | String of ASCII 7-bit alphanumeric characters | The identity of the device |
| callerLocalTimeUtc | UTC timestamp | The creation time of the message as reported by the device local clock |
| calleeLocalTimeUtc | UTC timestamp | The time of message arrival at the IoT Hub's gateway as reported by IoT Hub service side clock |
IoT Hub ingress logs
IoT Hub records this log when message containing valid trace properties writes to internal or built-in Event Hubs.
{
    "records":
    [
        {
            "time": "UTC timestamp",
            "resourceId": "Resource Id",
            "operationName": "DiagnosticIoTHubIngress",
            "category": "DistributedTracing",
            "correlationId": "00-8cd869a412459a25f5b4f31311223344-349810a9bbd28730-01",
            "level": "Information",
            "resultType": "Success",
            "resultDescription":"Ingress message success",
            "durationMs": "10",
            "properties": "{\"isRoutingEnabled\": \"true\", \"parentSpanId\":\"0144d2590aacd909\"}",
            "location": "Resource location"
        }
    ]
}
In the properties section, this log contains additional information about message ingress.
| Property | Type | Description |
|---|---|---|
| isRoutingEnabled | String | Either true or false, indicates whether or not message routing is enabled in the IoT Hub |
| parentSpanId | String | The span-id of the parent message, which would be the D2C message trace in this case |
IoT Hub egress logs
IoT Hub records this log when routing is enabled and the message is written to an endpoint. If routing isn't enabled, IoT Hub doesn't record this log.
{
    "records":
    [
        {
            "time": "UTC timestamp",
            "resourceId": "Resource Id",
            "operationName": "DiagnosticIoTHubEgress",
            "category": "DistributedTracing",
            "correlationId": "00-8cd869a412459a25f5b4f31311223344-98ac3578922acd26-01",
            "level": "Information",
            "resultType": "Success",
            "resultDescription":"Egress message success",
            "durationMs": "10",
            "properties": "{\"endpointType\": \"EventHub\", \"endpointName\": \"myEventHub\", \"parentSpanId\":\"349810a9bbd28730\"}",
            "location": "Resource location"
        }
    ]
}
In the properties section, this log contains additional information about message ingress.
| Property | Type | Description |
|---|---|---|
| endpointName | String | The name of the routing endpoint |
| endpointType | String | The type of the routing endpoint |
| parentSpanId | String | The span-id of the parent message, which would be the IoT Hub ingress message trace in this case |
File upload operations category
The file upload category tracks errors that occur at the IoT hub and are related to file upload functionality. This category includes:
- Errors that occur with the SAS URI, such as when it expires before a device notifies the hub of a completed upload.
- Failed uploads reported by the device.
- Errors that occur when a file isn't found in storage during IoT Hub notification message creation.
This category can't catch errors that directly occur while the device is uploading a file to storage.
{
    "records":
    [
        {
            "time": "UTC timestamp",
            "resourceId": "Resource Id",
            "operationName": "ingress",
            "category": "FileUploadOperations",
            "level": "Error",
            "resultType": "Event status",
            "resultDescription": "MessageDescription",
            "durationMs": "1",
            "properties": "{\"deviceId\":\"<deviceId>\",\"protocol\":\"<protocol>\",\"authType\":\"{\\\"scope\\\":\\\"device\\\",\\\"type\\\":\\\"sas\\\",\\\"issuer\\\":\\\"iothub\\\",\\\"acceptingIpFilterRule\\\":null}\",\"blobUri\":\"http//bloburi.com\"}",
            "location": "Resource location"
        }
    ]
}
Jobs operations category
The jobs operations category reports on job requests to update device twins or invoke direct methods on multiple devices. These requests are initiated in the cloud.
{
    "records":
    [
        {
            "time": "UTC timestamp",
            "resourceId": "Resource Id",
            "operationName": "jobCompleted",
            "category": "JobsOperations",
            "level": "Information",
            "durationMs": "1",
            "properties": "{\"jobId\":\"<jobId>\", \"sdkVersion\": \"<sdkVersion>\",\"messageSize\": <messageSize>,\"filter\":\"DeviceId IN ['1414ded9-b445-414d-89b9-e48e8c6285d5']\",\"startTimeUtc\":\"Wednesday, September 13, 2017\",\"duration\":\"0\"}",
            "location": "Resource location"
        }
    ]
}
Routes category
The message routing category tracks errors that occur during message route evaluation and endpoint health as perceived by IoT Hub. This category includes events such as:
- A rule evaluates to "undefined"
- IoT Hub marks an endpoint as dead
- Any errors received from an endpoint
This category doesn't include specific errors about the messages themselves (like device throttling errors), which are reported under the "device telemetry" category.
{
    "records":
    [
        {
            "time":"2019-12-12T03:25:14Z",
            "resourceId":"/SUBSCRIPTIONS/91R34780-3DEC-123A-BE2A-213B5500DFF0/RESOURCEGROUPS/ANON-TEST/PROVIDERS/MICROSOFT.DEVICES/IOTHUBS/ANONHUB1",
            "operationName":"endpointUnhealthy",
            "category":"Routes",
            "level":"Error",
            "resultType":"403004",
            "resultDescription":"DeviceMaximumQueueDepthExceeded",
            "properties":"{\"deviceId\":null,\"endpointName\":\"anon-sb-1\",\"messageId\":null,\"details\":\"DeviceMaximumQueueDepthExceeded\",\"routeName\":null,\"statusCode\":\"403\"}",
            "location":"westus"
        }
    ]
}
Here are more details on routing resource logs:
Twin queries category
The twin queries category reports on query requests for device twins that are initiated in the cloud.
{
    "records":
    [
        {
            "time": "UTC timestamp",
            "resourceId": "Resource Id",
            "operationName": "query",
            "category": "TwinQueries",
            "level": "Information",
            "durationMs": "1",
            "properties": "{\"query\":\"<twin query>\",\"sdkVersion\":\"<sdkVersion>\",\"messageSize\":\"<messageSize>\",\"pageSize\":\"<pageSize>\", \"continuation\":\"<true, false>\", \"resultSize\":\"<resultSize>\"}",
            "location": "Resource location"
        }
    ]
}
Azure Monitor Logs tables
This section lists the Azure Monitor Logs tables relevant to this service, which are available for query by Log Analytics using Kusto queries. The tables contain resource log data and possibly more depending on what is collected and routed to them.
IoT Hub Microsoft.Devices/IotHubs
Activity log
The linked table lists the operations that can be recorded in the activity log for this service. These operations are a subset of all the possible resource provider operations in the activity log.
For more information on the schema of activity log entries, see Activity Log schema.
Related content
- See Monitor Azure IoT Hub for a description of monitoring IoT Hub.
- See Monitor Azure resources with Azure Monitor for details on monitoring Azure resources.
Tilbakemeldinger
Kommer snart: Gjennom 2024 faser vi ut GitHub Issues som tilbakemeldingsmekanisme for innhold, og erstatter det med et nytt system for tilbakemeldinger. Hvis du vil ha mer informasjon, kan du se: https://aka.ms/ContentUserFeedback.
Send inn og vis tilbakemelding for