Collect performance counters with Azure Monitor Agent
Performance counters is one of the data sources used in a data collection rule (DCR). Details for the creation of the DCR are provided in Collect data with Azure Monitor Agent. This article provides more details for the Windows events data source type.
Performance counters provide insight into the performance of hardware components, operating systems, and applications. Azure Monitor Agent can collect performance counters from Windows and Linux machines at frequent intervals for near real time analysis.
Prerequisites
- If you're going to send performance data to a Log Analytics workspace, then you must have one created where you have at least contributor rights.
- Either a new or existing DCR described in Collect data with Azure Monitor Agent.
Configure performance counters data source
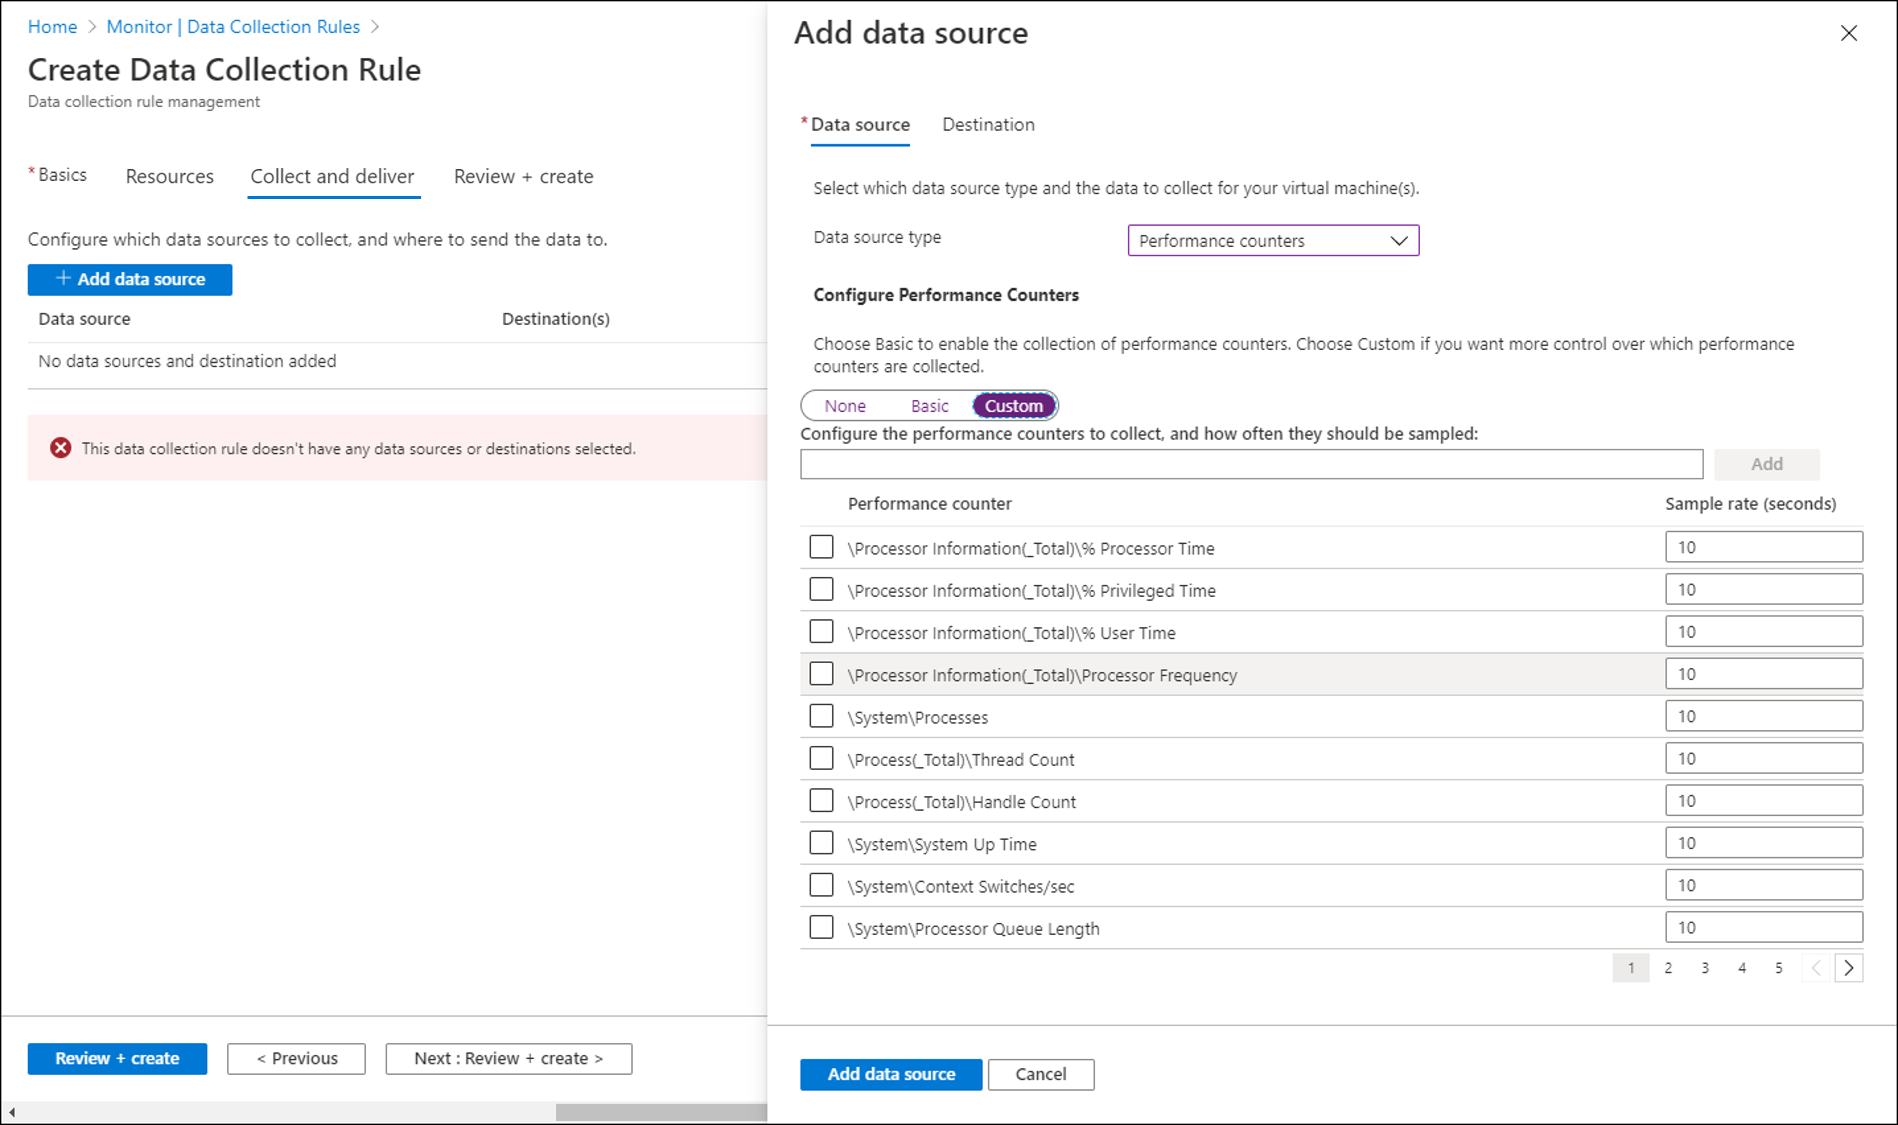
Create a data collection rule, as described in Collect data with Azure Monitor Agent. In the Collect and deliver step, select Performance Counters from the Data source type dropdown.
For performance counters, select from a predefined set of objects and their sampling rate.
Select Custom to specify an XPath to collect any performance counters not available by default. Use the format \PerfObject(ParentInstance/ObjectInstance#InstanceIndex)\Counter. If the counter name contains an ampersand (&), replace it with &. For example, \Memory\Free & Zero Page List Bytes. You can view the default counters for examples.
Note
At this time, Microsoft.HybridCompute (Azure Arc-enabled servers) resources can't be viewed in Metrics Explorer (the Azure portal UX), but they can be acquired via the Metrics REST API (Metric Namespaces - List, Metric Definitions - List, and Metrics - List).
Destinations
Performance counters data can be sent to the following locations.
| Destination | Table / Namespace |
|---|---|
| Log Analytics workspace | Perf (see Azure Monitor Logs reference) |
| Azure Monitor Metrics | Windows: Virtual Machine Guest Linux: azure.vm.linux.guestmetrics |
Note
On Linux, using Azure Monitor Metrics as the only destination is supported in v1.10.9.0 or higher.
Log queries with performance records
The following queries are examples to retrieve performance records.
All performance data from a particular computer
Perf
| where Computer == "MyComputer"
Average CPU utilization across all computers
Perf
| where ObjectName == "Processor" and CounterName == "% Processor Time" and InstanceName == "_Total"
| summarize AVGCPU = avg(CounterValue) by Computer
Hourly average, minimum, maximum, and 75-percentile CPU usage for a specific computer
Perf
| where CounterName == "% Processor Time" and InstanceName == "_Total" and Computer == "MyComputer"
| summarize ["min(CounterValue)"] = min(CounterValue), ["avg(CounterValue)"] = avg(CounterValue), ["percentile75(CounterValue)"] = percentile(CounterValue, 75), ["max(CounterValue)"] = max(CounterValue) by bin(TimeGenerated, 1h), Computer
Note
Additional query examples are available at Queries for the Perf table.
Next steps
- Collect text logs by using Azure Monitor Agent.
- Learn more about Azure Monitor Agent.
- Learn more about data collection rules.


