Performance benchmark test recommendations for Azure NetApp Files
This article provides benchmark testing recommendations for volume performance and metrics using Azure NetApp Files.
Overview
To understand the performance characteristics of an Azure NetApp Files volume, you can use the open-source tool FIO to run a series of benchmarks to simulate various workloads. FIO can be installed on both Linux and Windows-based operating systems. It is an excellent tool to get a quick snapshot of both IOPS and throughput for a volume.
Important
Azure NetApp Files does not recommend using the dd utility as a baseline benchmarking tool. You should use an actual application workload, workload simulation, and benchmarking and analyzing tools (for example, Oracle AWR with Oracle, or the IBM equivalent for DB2) to establish and analyze optimal infrastructure performance. Tools such as FIO, vdbench, and iometer have their places in determining virtual machines to storage limits, matching the parameters of the test to the actual application workload mixtures for most useful results. However, it is always best to test with the real-world application.
VM instance sizing
For best results, ensure that you are using a virtual machine (VM) instance that is appropriately sized to perform the tests. The following examples use a Standard_D32s_v3 instance. For more information about VM instance sizes, see Sizes for Windows virtual machines in Azure for Windows-based VMs, and Sizes for Linux virtual machines in Azure for Linux-based VMs.
Azure NetApp Files volume sizing
Ensure that you choose the correct service level and volume quota size for the expected performance level. For more information, see Service levels for Azure NetApp Files.
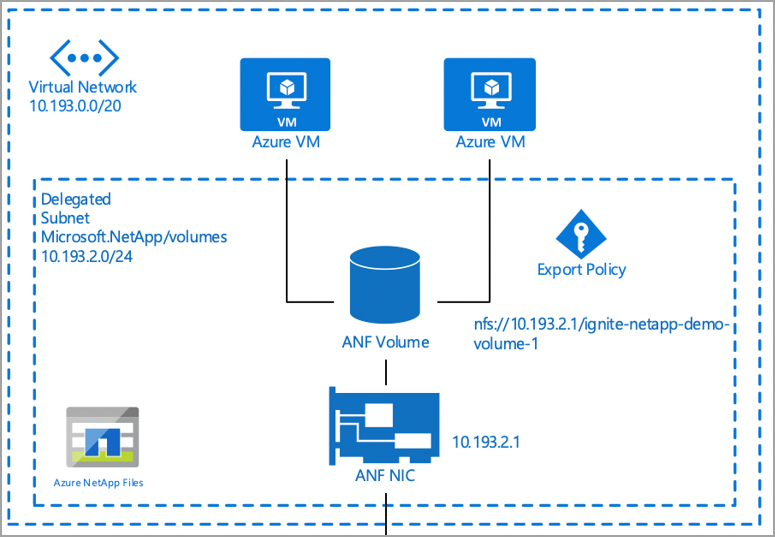
Virtual network (VNet) recommendations
You should perform the benchmark testing in the same VNet as Azure NetApp Files. The example below demonstrates the recommendation:
Performance benchmarking tools
This section provides details about a few benchmarking tools.
SSB
SQL Storage Benchmark (SSB) is an open-source benchmark tool written in Python. It is designed to generate a "real-world" workload that emulates database interaction in such a way to measure the performance of the storage subsystem.
The intent of SSB is to allow organizations and individuals to measure the performance of their storage subsystem under the stress of a SQL database workload.
Installation of SSB
Follow the Getting started section in the SSB README file to install for the platform of your choice.
FIO
Flexible I/O Tester (FIO) is a free and open-source disk I/O tool used both for benchmark and stress/hardware verification.
FIO is available in binary format for both Linux and Windows.
Installation of FIO
Follow the Binary Packages section in the FIO README file to install for the platform of your choice.
FIO examples for IOPS
The FIO examples in this section use the following setup:
- VM instance size: D32s_v3
- Capacity pool service level and size: Premium / 50 TiB
- Volume quota size: 48 TiB
The following examples show the FIO random reads and writes.
FIO: 8k block size 100% random reads
fio --name=8krandomreads --rw=randread --direct=1 --ioengine=libaio --bs=8k --numjobs=4 --iodepth=128 --size=4G --runtime=600 --group_reporting
FIO: 8k block size 100% random writes
fio --name=8krandomwrites --rw=randwrite --direct=1 --ioengine=libaio --bs=8k --numjobs=4 --iodepth=128 --size=4G --runtime=600 --group_reporting
Benchmark results
For official benchmark results for how FIO performs in Azure NetApp Files, see Azure NetApp Files performance benchmarks for Linux.
FIO examples for bandwidth
The examples in this section show the FIO sequential reads and writes.
FIO: 64k block size 100% sequential reads
fio --name=64kseqreads --rw=read --direct=1 --ioengine=libaio --bs=64k --numjobs=4 --iodepth=128 --size=4G --runtime=600 --group_reporting
FIO: 64k block size 100% sequential writes
fio --name=64kseqwrites --rw=write --direct=1 --ioengine=libaio --bs=64k --numjobs=4 --iodepth=128 --size=4G --runtime=600 --group_reporting
Benchmark results
For official benchmark results for how FIO performs in Azure NetApp Files, see Azure NetApp Files performance benchmarks for Linux.
Volume metrics
Azure NetApp Files performance data is available through Azure Monitor counters. The counters are available via the Azure portal and REST API GET requests.
You can view historical data for the following information:
- Average read latency
- Average write latency
- Read IOPS (average)
- Write IOPS (average)
- Volume logical size (average)
- Volume snapshot size (average)
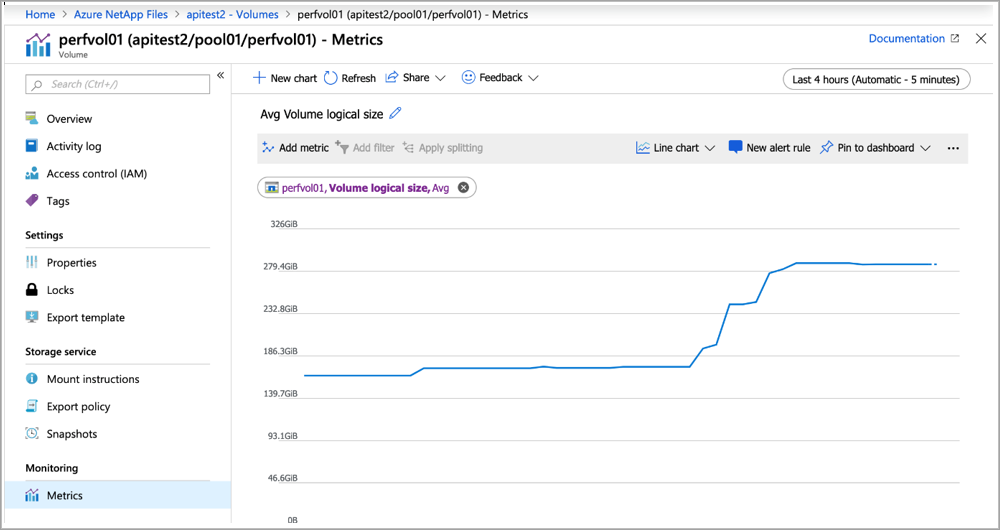
Using Azure Monitor
You can access Azure NetApp Files counters on a per-volume basis from the Metrics page, as shown below:
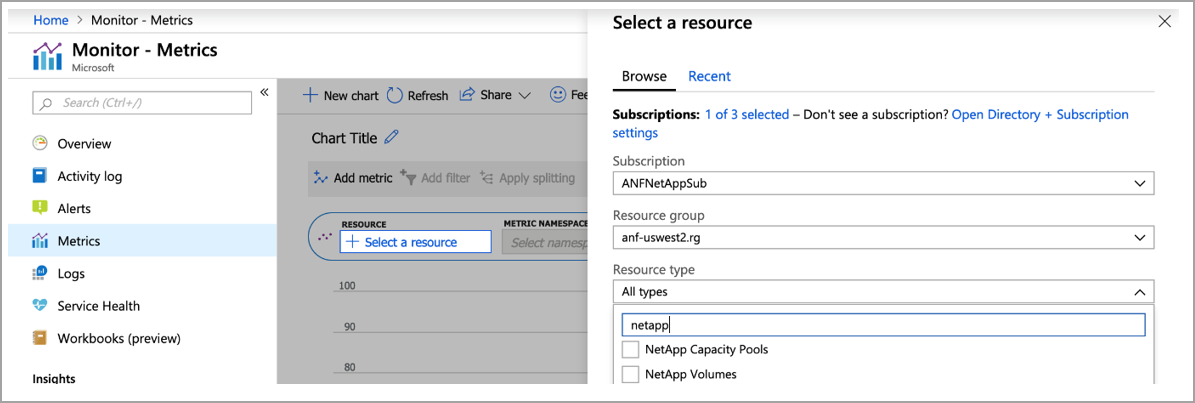
You can also create a dashboard in Azure Monitor for Azure NetApp Files by going to the Metrics page, filtering for NetApp, and specifying the volume counters of interest:
Azure Monitor API access
You can access Azure NetApp Files counters by using REST API calls. See Supported metrics with Azure Monitor: Microsoft.NetApp/netAppAccounts/capacityPools/Volumes for counters for capacity pools and volumes.
The following example shows a GET URL for viewing logical volume size:
#get ANF volume usage
curl -X GET -H "Authorization: Bearer TOKENGOESHERE" -H "Content-Type: application/json" https://management.azure.com/subscriptions/SUBIDGOESHERE/resourceGroups/RESOURCEGROUPGOESHERE/providers/Microsoft.NetApp/netAppAccounts/ANFACCOUNTGOESHERE/capacityPools/ANFPOOLGOESHERE/Volumes/ANFVOLUMEGOESHERE/providers/microsoft.insights/metrics?api-version=2018-01-01&metricnames=VolumeLogicalSize