Monitor Azure SQL Database performance using dynamic management views
Applies to: ![]() Azure SQL Database
Azure SQL Database
You can use dynamic management views (DMVs) to monitor workload performance and diagnose performance problems, which might be caused by blocked or long-running queries, resource bottlenecks, suboptimal query plans, and more.
This article provides information on how to detect common performance problems by querying dynamic management views via T-SQL. You can use any query tool, such as:
Permissions
In Azure SQL Database, depending on the compute size, deployment option, and the data in the DMV, querying a DMV may require either VIEW DATABASE STATE, or VIEW SERVER PERFORMANCE STATE, or VIEW SERVER SECURITY STATE permission. The last two permissions are included in the VIEW SERVER STATE permission. View server state permissions are granted via membership in the corresponding server roles. To determine which permissions are required to query a specific DMV, see Dynamic management views and find the article describing the DMV.
To grant the VIEW DATABASE STATE permission to a database user, run the following query, replacing database_user with the name of the user principal in the database:
GRANT VIEW DATABASE STATE TO [database_user];
To grant membership in the ##MS_ServerStateReader## server role to a login named login_name on a logical server, connect to the master database, then run the following query as an example:
ALTER SERVER ROLE [##MS_ServerStateReader##] ADD MEMBER [login_name];
It might take a few minutes for the permission grant to take effect. For more information, see Limitations of server-level roles.
Monitor resource use
You can monitor resource usage at the database level using the following views. These views are applicable to standalone databases, and databases in an elastic pool.
You can monitor resource usage at the elastic pool level using the following views:
You can monitor resource usage at the query level by using SQL Database Query Performance Insight in the Azure portal, or via Query Store.
sys.dm_db_resource_stats
You can use the sys.dm_db_resource_stats view in every database. The sys.dm_db_resource_stats view shows recent resource use data relative to the limits of the compute size. Percentages of CPU, data I/O, log writes, worker threads, and memory usage toward the limit are recorded for every 15-second interval and are maintained for approximately one hour.
Because this view provides granular resource usage data, use sys.dm_db_resource_stats first for any current-state analysis or troubleshooting. For example, this query shows the average and maximum resource use for the current database over the past hour:
SELECT
    database_name = DB_NAME(),
    AVG(avg_cpu_percent) AS 'Average CPU use in percent',
    MAX(avg_cpu_percent) AS 'Maximum CPU use in percent',
    AVG(avg_data_io_percent) AS 'Average data IO in percent',
    MAX(avg_data_io_percent) AS 'Maximum data IO in percent',
    AVG(avg_log_write_percent) AS 'Average log write use in percent',
    MAX(avg_log_write_percent) AS 'Maximum log write use in percent',
    AVG(avg_memory_usage_percent) AS 'Average memory use in percent',
    MAX(avg_memory_usage_percent) AS 'Maximum memory use in percent',
    MAX(max_worker_percent) AS 'Maximum worker use in percent'
FROM sys.dm_db_resource_stats
For other queries, see the examples in sys.dm_db_resource_stats.
sys.resource_stats
The sys.resource_stats view in the master database has additional information that can help you monitor the performance of your database at its specific service tier and compute size. The data is collected every 5 minutes and is maintained for approximately 14 days. This view is useful for a longer-term historical analysis of how your database uses resources.
The following graph shows the CPU resource use for a Premium database with the P2 compute size for each hour in a week. This graph starts on a Monday, shows five work days, and then shows a weekend, when much less happens in the application.
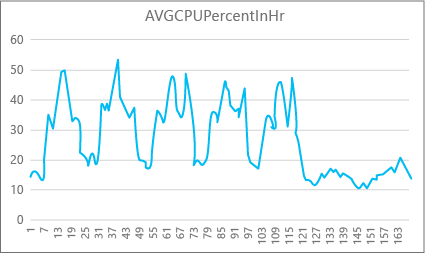
From the data, this database currently has a peak CPU load of just over 50 percent CPU use relative to the P2 compute size (midday on Tuesday). If CPU is the dominant factor in the application's resource profile, then you might decide that P2 is the right compute size to guarantee that the workload always fits. If you expect an application to grow over time, it's a good idea to have an extra resource buffer so that the application doesn't ever reach the performance-level limit. If you increase the compute size, you can help avoid customer-visible errors that might occur when a database doesn't have enough power to process requests effectively, especially in latency-sensitive environments.
For other application types, you might interpret the same graph differently. For example, if an application tries to process payroll data each day and has the same chart, this kind of "batch job" model might do fine at a P1 compute size. The P1 compute size has 100 DTUs compared to 200 DTUs at the P2 compute size. The P1 compute size provides half the performance of the P2 compute size. So, 50 percent of CPU use in P2 equals 100 percent CPU use in P1. If the application does not have timeouts, it might not matter if a job takes 2 hours or 2.5 hours to finish, if it gets done today. An application in this category probably can use a P1 compute size. You can take advantage of the fact that there are periods of time during the day when resource use is lower, so that any "big peak" might spill over into one of the troughs later in the day. The P1 compute size might be good for that kind of application (and save money), as long as the jobs can finish on time each day.
The database engine exposes consumed resource information for each active database in the sys.resource_stats view of the master database on each logical server. The data in the view is aggregated by 5-minute intervals. It can take several minutes for this data to appear in the table, so sys.resource_stats is more useful for historical analysis rather than near-real-time analysis. Query the sys.resource_stats view to see the recent history of a database and validate whether the compute size you chose delivered the performance you want when needed.
Note
You must be connected to the master database to query sys.resource_stats in the following examples.
This example shows you the data in sys.resource_stats:
SELECT TOP 10 *
FROM sys.resource_stats
WHERE database_name = 'userdb1'
ORDER BY start_time DESC;
The next example shows you different ways that you can use the sys.resource_stats catalog view to get information about how your database uses resources:
To look at the past week's resource use for the user database
userdb1, you can run this query, substituting your own database name:SELECT * FROM sys.resource_stats WHERE database_name = 'userdb1' AND start_time > DATEADD(day, -7, GETDATE()) ORDER BY start_time DESC;To evaluate how well your workload fits the compute size, you need to drill down into each aspect of the resource metrics: CPU, data I/O, log write, number of workers, and number of sessions. Here's a revised query using
sys.resource_statsto report the average and maximum values of these resource metrics, for each compute size the database has been provisioned for:SELECT rs.database_name , rs.sku , storage_mb = MAX(rs.storage_in_megabytes) , 'Average CPU Utilization In %' = AVG(rs.avg_cpu_percent) , 'Maximum CPU Utilization In %' = MAX(rs.avg_cpu_percent) , 'Average Data IO In %' = AVG(rs.avg_data_io_percent) , 'Maximum Data IO In %' = MAX(rs.avg_data_io_percent) , 'Average Log Write Utilization In %' = AVG(rs.avg_log_write_percent) , 'Maximum Log Write Utilization In %' = MAX(rs.avg_log_write_percent) , 'Maximum Requests In %' = MAX(rs.max_worker_percent) , 'Maximum Sessions In %' = MAX(rs.max_session_percent) FROM sys.resource_stats AS rs WHERE rs.database_name = 'userdb1' AND rs.start_time > DATEADD(day, -7, GETDATE()) GROUP BY rs.database_name, rs.sku;With this information about the average and maximum values of each resource metric, you can assess how well your workload fits into the compute size you chose. Usually, average values from
sys.resource_statsgive you a good baseline to use against the target size.For DTU purchasing model databases:
For an example, you might be using the Standard service tier with S2 compute size. The average use percentages for CPU and I/O reads and writes are below 40 percent, the average number of workers is below 50, and the average number of sessions is below 200. Your workload might fit into the S1 compute size. It's easy to see whether your database fits in the worker and session limits. To see whether a database fits into a lower compute size, divide the DTU number of the lower compute size by the DTU number of your current compute size, and then multiply the result by 100:
S1 DTU / S2 DTU * 100 = 20 / 50 * 100 = 40The result is the relative performance difference between the two compute sizes in percentage. If your resource use doesn't exceed this percentage, your workload might fit into the lower compute size. However, you need to look at all ranges of resource use values, and determine, by percentage, how often your database workload would fit into the lower compute size. The following query outputs the fit percentage per resource dimension, based on the threshold of 40 percent that we calculated in this example:
 SELECT database_name,
     100*((COUNT(database_name) - SUM(CASE WHEN avg_cpu_percent >= 40 THEN 1 ELSE 0 END) * 1.0) / COUNT(database_name)) AS 'CPU Fit Percent',
     100*((COUNT(database_name) - SUM(CASE WHEN avg_log_write_percent >= 40 THEN 1 ELSE 0 END) * 1.0) / COUNT(database_name)) AS 'Log Write Fit Percent',
     100*((COUNT(database_name) - SUM(CASE WHEN avg_data_io_percent >= 40 THEN 1 ELSE 0 END) * 1.0) / COUNT(database_name)) AS 'Physical Data IO Fit Percent'
 FROM sys.resource_stats
 WHERE start_time > DATEADD(day, -7, GETDATE())
 AND database_name = 'sample' --remove to see all databases
 GROUP BY database_name;
Based on your database service tier, you can decide whether your workload fits into the lower compute size. If your database workload objective is 99.9 percent and the preceding query returns values greater than 99.9 percent for all three resource dimensions, your workload likely fits into the lower compute size.
Looking at the fit percentage also gives you insight into whether you should move to the next higher compute size to meet your objective. For example, the CPU usage for a sample database over the past week:
Average CPU percent Maximum CPU percent 24.5 100.00 The average CPU is about a quarter of the limit of the compute size, which would fit well into the compute size of the database.
For DTU purchasing model and vCore purchasing model databases:
The maximum value shows that the database reaches the limit of the compute size. Do you need to move to the next higher compute size? Look at how many times your workload reaches 100 percent, and then compare it to your database workload objective.
 SELECT database_name,
     100*((COUNT(database_name) - SUM(CASE WHEN avg_cpu_percent >= 100 THEN 1 ELSE 0 END) * 1.0) / COUNT(database_name)) AS 'CPU Fit Percent',
     100*((COUNT(database_name) - SUM(CASE WHEN avg_log_write_percent >= 100 THEN 1 ELSE 0 END) * 1.0) / COUNT(database_name)) AS 'Log Write Fit Percent',
     100*((COUNT(database_name) - SUM(CASE WHEN avg_data_io_percent >= 100 THEN 1 ELSE 0 END) * 1.0) / COUNT(database_name)) AS 'Physical Data IO Fit Percent'
 FROM sys.resource_stats
 WHERE start_time > DATEADD(day, -7, GETDATE())
 AND database_name = 'sample'  --remove to see all databases
 GROUP BY database_name;
These percentages are the number of samples your workload fit under the current compute size. If this query returns a value less than 99.9 percent for any of the three resource dimensions, your sampled average workload exceeded the limits. Consider either moving to the next higher compute size or use application-tuning techniques to reduce the load on the database.
sys.dm_elastic_pool_resource_stats
Similarly to sys.dm_db_resource_stats, sys.dm_elastic_pool_resource_stats provides recent and granular resource usage data for an elastic pool. The view can be queried in any database in an elastic pool to provide resource usage data for an entire pool, rather than any specific database. The percentage values reported by this DMV are toward the limits of the elastic pool, which might be higher than the limits for a database in the pool.
This example shows the summarized resource usage data for the current elastic pool in the last 15 minutes:
SELECT dso.elastic_pool_name,
       AVG(eprs.avg_cpu_percent) AS avg_cpu_percent,
       MAX(eprs.avg_cpu_percent) AS max_cpu_percent,
       AVG(eprs.avg_data_io_percent) AS avg_data_io_percent,
       MAX(eprs.avg_data_io_percent) AS max_data_io_percent,
       AVG(eprs.avg_log_write_percent) AS avg_log_write_percent,
       MAX(eprs.avg_log_write_percent) AS max_log_write_percent,
       MAX(eprs.max_worker_percent) AS max_worker_percent,
       MAX(eprs.used_storage_percent) AS max_used_storage_percent,
       MAX(eprs.allocated_storage_percent) AS max_allocated_storage_percent
FROM sys.dm_elastic_pool_resource_stats AS eprs
CROSS JOIN sys.database_service_objectives AS dso
WHERE eprs.end_time >= DATEADD(minute, -15, GETUTCDATE())
GROUP BY dso.elastic_pool_name;
If you find that any resource usage approaches 100% for a significant period of time, you might need to review resource usage for individual databases in the same elastic pool to determine how much each database contributes to the pool-level resource usage.
sys.elastic_pool_resource_stats
Similarly to sys.resource_stats, sys.elastic_pool_resource_stats in the master database provides historical resource usage data for all elastic pools on the logical server. You can use sys.elastic_pool_resource_stats for historical monitoring over the last 14 days, including usage trend analysis.
This example shows the summarized resource usage data in the last seven days for all elastic pools on the current logical server. Execute the query in the master database.
SELECT elastic_pool_name,
       AVG(avg_cpu_percent) AS avg_cpu_percent,
       MAX(avg_cpu_percent) AS max_cpu_percent,
       AVG(avg_data_io_percent) AS avg_data_io_percent,
       MAX(avg_data_io_percent) AS max_data_io_percent,
       AVG(avg_log_write_percent) AS avg_log_write_percent,
       MAX(avg_log_write_percent) AS max_log_write_percent,
       MAX(max_worker_percent) AS max_worker_percent,
       AVG(avg_storage_percent) AS avg_used_storage_percent,
       MAX(avg_storage_percent) AS max_used_storage_percent,
       AVG(avg_allocated_storage_percent) AS avg_allocated_storage_percent,
       MAX(avg_allocated_storage_percent) AS max_allocated_storage_percent
FROM sys.elastic_pool_resource_stats
WHERE start_time >= DATEADD(day, -7, GETUTCDATE())
GROUP BY elastic_pool_name
ORDER BY elastic_pool_name ASC;
Concurrent requests
To see the current number of concurrent requests, run this query in your user database:
SELECT COUNT(*) AS [Concurrent_Requests]
FROM sys.dm_exec_requests;
This is just a snapshot at a single point in time. To get a better understanding of your workload and concurrent request requirements, you'll need to collect many samples over time.
Average request rate
This example shows how to find the average request rate for a database, or for databases in an elastic pool, over a time period. In this example, the time period is set to 30 seconds. You can adjust it by modifying the WAITFOR DELAY statement. Execute this query in your user database. If the database is in an elastic pool and if you have sufficient permissions, the results include other databases in the elastic pool.
DECLARE @DbRequestSnapshot TABLE (
                                 database_name sysname PRIMARY KEY,
                                 total_request_count bigint NOT NULL,
                                 snapshot_time datetime2 NOT NULL DEFAULT (SYSDATETIME())
                                 );

INSERT INTO @DbRequestSnapshot
(
database_name,
total_request_count
)
SELECT rg.database_name,
       wg.total_request_count
FROM sys.dm_resource_governor_workload_groups AS wg
INNER JOIN sys.dm_user_db_resource_governance AS rg
ON wg.name = CONCAT('UserPrimaryGroup.DBId', rg.database_id);

WAITFOR DELAY '00:00:30';

SELECT rg.database_name,
       (wg.total_request_count - drs.total_request_count) / DATEDIFF(second, drs.snapshot_time, SYSDATETIME()) AS requests_per_second
FROM sys.dm_resource_governor_workload_groups AS wg
INNER JOIN sys.dm_user_db_resource_governance AS rg
ON wg.name = CONCAT('UserPrimaryGroup.DBId', rg.database_id)
INNER JOIN @DbRequestSnapshot AS drs
ON rg.database_name = drs.database_name;
Current sessions
To see the number of current active sessions, run this query on your database:
SELECT COUNT(*) AS [Sessions]
FROM sys.dm_exec_sessions
WHERE is_user_process = 1;
This query returns a point-in-time count. If you collect multiple samples over time, you'll have the best understanding of your session use.
Recent history of requests, sessions, and workers
This example returns the recent historical usage of requests, sessions, and worker threads for a database, or for databases in an elastic pool. Each row represents a snapshot of resource usage at a point in time for a database. The requests_per_second column is the average request rate during the time interval that ends at snapshot_time. If the database is in an elastic pool and if you have sufficient permissions, the results include other databases in the elastic pool.
SELECT rg.database_name,
       wg.snapshot_time,
       wg.active_request_count,
       wg.active_worker_count,
       wg.active_session_count,
       CAST(wg.delta_request_count AS decimal) / duration_ms * 1000 AS requests_per_second
FROM sys.dm_resource_governor_workload_groups_history_ex AS wg
INNER JOIN sys.dm_user_db_resource_governance AS rg
ON wg.name = CONCAT('UserPrimaryGroup.DBId', rg.database_id)
ORDER BY snapshot_time DESC;
Calculate database and objects sizes
The following query returns the data size in your database (in megabytes):
-- Calculates the size of the database.
SELECT SUM(CAST(FILEPROPERTY(name, 'SpaceUsed') AS bigint) * 8192.) / 1024 / 1024 AS size_mb
FROM sys.database_files
WHERE type_desc = 'ROWS';
The following query returns the size of individual objects (in megabytes) in your database:
-- Calculates the size of individual database objects.
SELECT o.name, SUM(ps.reserved_page_count) * 8.0 / 1024 AS size_mb
FROM sys.dm_db_partition_stats AS ps
    INNER JOIN sys.objects AS o
        ON ps.object_id = o.object_id
GROUP BY o.name
ORDER BY size_mb DESC;
Identify CPU performance issues
This section helps you identify individual queries that are top CPU consumers.
If CPU consumption is above 80% for extended periods of time, consider the following troubleshooting steps whether the CPU issue is occurring now or has occurred in the past. You can also follow the steps in this section to proactively identify top CPU consuming queries and tune them. In some cases, reducing CPU consumption might let you scale down your databases and elastic pools and save costs.
The troubleshooting steps are the same for standalone databases and databases in an elastic pool. Execute all queries in the user database.
The CPU issue is occurring now
If issue is occurring right now, there are two possible scenarios:
Many individual queries that cumulatively consume high CPU
Use the following query to identify top queries by query hash:
PRINT '-- top 10 Active CPU Consuming Queries (aggregated)--';
SELECT TOP 10 GETDATE() runtime, *
FROM (SELECT query_stats.query_hash, SUM(query_stats.cpu_time) 'Total_Request_Cpu_Time_Ms', SUM(logical_reads) 'Total_Request_Logical_Reads', MIN(start_time) 'Earliest_Request_start_Time', COUNT(*) 'Number_Of_Requests', SUBSTRING(REPLACE(REPLACE(MIN(query_stats.statement_text), CHAR(10), ' '), CHAR(13), ' '), 1, 256) AS "Statement_Text"
    FROM (SELECT req.*, SUBSTRING(ST.text, (req.statement_start_offset / 2)+1, ((CASE statement_end_offset WHEN -1 THEN DATALENGTH(ST.text)ELSE req.statement_end_offset END-req.statement_start_offset)/ 2)+1) AS statement_text
            FROM sys.dm_exec_requests AS req
                CROSS APPLY sys.dm_exec_sql_text(req.sql_handle) AS ST ) AS query_stats
    GROUP BY query_hash) AS t
ORDER BY Total_Request_Cpu_Time_Ms DESC;
Long running queries that consume CPU are still running
Use the following query to identify these queries:
PRINT '--top 10 Active CPU Consuming Queries by sessions--';
SELECT TOP 10 req.session_id, req.start_time, cpu_time 'cpu_time_ms', OBJECT_NAME(ST.objectid, ST.dbid) 'ObjectName', SUBSTRING(REPLACE(REPLACE(SUBSTRING(ST.text, (req.statement_start_offset / 2)+1, ((CASE statement_end_offset WHEN -1 THEN DATALENGTH(ST.text)ELSE req.statement_end_offset END-req.statement_start_offset)/ 2)+1), CHAR(10), ' '), CHAR(13), ' '), 1, 512) AS statement_text
FROM sys.dm_exec_requests AS req
    CROSS APPLY sys.dm_exec_sql_text(req.sql_handle) AS ST
ORDER BY cpu_time DESC;
GO
The CPU issue occurred in the past
If the issue occurred in the past and you want to do root cause analysis, use Query Store. Users with database access can use T-SQL to query Query Store data. By default, Query Store captures aggregate query statistics for one-hour intervals.
Use the following query to look at activity for high CPU consuming queries. This query returns the top 15 CPU consuming queries. Remember to change
rsi.start_time >= DATEADD(hour, -2, GETUTCDATE()to look at a time period other than the last two hours:-- Top 15 CPU consuming queries by query hash -- Note that a query hash can have many query ids if not parameterized or not parameterized properly WITH AggregatedCPU AS ( SELECT q.query_hash ,SUM(count_executions * avg_cpu_time / 1000.0) AS total_cpu_ms ,SUM(count_executions * avg_cpu_time / 1000.0) / SUM(count_executions) AS avg_cpu_ms ,MAX(rs.max_cpu_time / 1000.00) AS max_cpu_ms ,MAX(max_logical_io_reads) max_logical_reads ,COUNT(DISTINCT p.plan_id) AS number_of_distinct_plans ,COUNT(DISTINCT p.query_id) AS number_of_distinct_query_ids ,SUM(CASE WHEN rs.execution_type_desc = 'Aborted' THEN count_executions ELSE 0 END) AS Aborted_Execution_Count ,SUM(CASE WHEN rs.execution_type_desc = 'Regular' THEN count_executions ELSE 0 END) AS Regular_Execution_Count ,SUM(CASE WHEN rs.execution_type_desc = 'Exception' THEN count_executions ELSE 0 END) AS Exception_Execution_Count ,SUM(count_executions) AS total_executions ,MIN(qt.query_sql_text) AS sampled_query_text FROM sys.query_store_query_text AS qt INNER JOIN sys.query_store_query AS q ON qt.query_text_id = q.query_text_id INNER JOIN sys.query_store_plan AS p ON q.query_id = p.query_id INNER JOIN sys.query_store_runtime_stats AS rs ON rs.plan_id = p.plan_id INNER JOIN sys.query_store_runtime_stats_interval AS rsi ON rsi.runtime_stats_interval_id = rs.runtime_stats_interval_id WHERE rs.execution_type_desc IN ('Regular','Aborted','Exception') AND rsi.start_time >= DATEADD(HOUR, - 2, GETUTCDATE()) GROUP BY q.query_hash ) ,OrderedCPU AS ( SELECT query_hash ,total_cpu_ms ,avg_cpu_ms ,max_cpu_ms ,max_logical_reads ,number_of_distinct_plans ,number_of_distinct_query_ids ,total_executions ,Aborted_Execution_Count ,Regular_Execution_Count ,Exception_Execution_Count ,sampled_query_text ,ROW_NUMBER() OVER ( ORDER BY total_cpu_ms DESC ,query_hash ASC ) AS query_hash_row_number FROM AggregatedCPU ) SELECT OD.query_hash ,OD.total_cpu_ms ,OD.avg_cpu_ms ,OD.max_cpu_ms ,OD.max_logical_reads ,OD.number_of_distinct_plans ,OD.number_of_distinct_query_ids ,OD.total_executions ,OD.Aborted_Execution_Count ,OD.Regular_Execution_Count ,OD.Exception_Execution_Count ,OD.sampled_query_text ,OD.query_hash_row_number FROM OrderedCPU AS OD WHERE OD.query_hash_row_number <= 15 --get top 15 rows by total_cpu_ms ORDER BY total_cpu_ms DESC;Once you identify the problematic queries, it's time to tune those queries to reduce CPU utilization. Alternatively, you can choose to increase the compute size of the database or elastic pool to work around the issue.
For more information about handling CPU performance problems in Azure SQL Database, see Diagnose and troubleshoot high CPU on Azure SQL Database.
Identify I/O performance issues
When identifying storage input/output (I/O) performance issues, the top wait types are:
PAGEIOLATCH_*For data file I/O issues (including
PAGEIOLATCH_SH,PAGEIOLATCH_EX,PAGEIOLATCH_UP). If the wait type name has IO in it, it points to an I/O issue. If there is no IO in the page latch wait name, it points to a different type of problem that is not related to storage performance (for example,tempdbcontention).WRITE_LOGFor transaction log I/O issues.
If the I/O issue is occurring right now
Use the sys.dm_exec_requests or sys.dm_os_waiting_tasks to see the wait_type and wait_time.
Identify data and log I/O usage
Use the following query to identify data and log I/O usage.
SELECT
    database_name = DB_NAME()
,   UTC_time = end_time
,   'Data IO In % of Limit'                   = rs.avg_data_io_percent
,   'Log Write Utilization In % of Limit'     = rs.avg_log_write_percent
FROM sys.dm_db_resource_stats AS rs  --past hour only
ORDER BY  rs.end_time DESC;
For more examples using sys.dm_db_resource_stats, see the Monitor resource use section later in this article.
If the I/O limit has been reached, you have two options:
- Upgrade the compute size or service tier
- Identify and tune the queries consuming the most I/O.
View buffer-related I/O using the Query Store
To identify top queries by I/O related waits, you can use the following Query Store query to view the last two hours of tracked activity:
-- Top queries that waited on buffer
-- Note these are finished queries
WITH Aggregated AS (SELECT q.query_hash, SUM(total_query_wait_time_ms) total_wait_time_ms, SUM(total_query_wait_time_ms / avg_query_wait_time_ms) AS total_executions, MIN(qt.query_sql_text) AS sampled_query_text, MIN(wait_category_desc) AS wait_category_desc
                    FROM sys.query_store_query_text AS qt
                         INNER JOIN sys.query_store_query AS q ON qt.query_text_id=q.query_text_id
                         INNER JOIN sys.query_store_plan AS p ON q.query_id=p.query_id
                         INNER JOIN sys.query_store_wait_stats AS waits ON waits.plan_id=p.plan_id
                         INNER JOIN sys.query_store_runtime_stats_interval AS rsi ON rsi.runtime_stats_interval_id=waits.runtime_stats_interval_id
                    WHERE wait_category_desc='Buffer IO' AND rsi.start_time>=DATEADD(HOUR, -2, GETUTCDATE())
                    GROUP BY q.query_hash), Ordered AS (SELECT query_hash, total_executions, total_wait_time_ms, sampled_query_text, wait_category_desc, ROW_NUMBER() OVER (ORDER BY total_wait_time_ms DESC, query_hash ASC) AS query_hash_row_number
                                                        FROM Aggregated)
SELECT OD.query_hash, OD.total_executions, OD.total_wait_time_ms, OD.sampled_query_text, OD.wait_category_desc, OD.query_hash_row_number
FROM Ordered AS OD
WHERE OD.query_hash_row_number <= 15 -- get top 15 rows by total_wait_time_ms
ORDER BY total_wait_time_ms DESC;
GO
You can also use the sys.query_store_runtime_stats view, focusing on the queries with large values in the avg_physical_io_reads and avg_num_physical_io_reads columns.
View total log I/O for WRITELOG waits
If the wait type is WRITELOG, use the following query to view total log I/O by statement:
-- Top transaction log consumers
-- Adjust the time window by changing
-- rsi.start_time >= DATEADD(hour, -2, GETUTCDATE())
WITH AggregatedLogUsed
AS (SELECT q.query_hash,
           SUM(count_executions * avg_cpu_time / 1000.0) AS total_cpu_ms,
           SUM(count_executions * avg_cpu_time / 1000.0) / SUM(count_executions) AS avg_cpu_ms,
           SUM(count_executions * avg_log_bytes_used) AS total_log_bytes_used,
           MAX(rs.max_cpu_time / 1000.00) AS max_cpu_ms,
           MAX(max_logical_io_reads) max_logical_reads,
           COUNT(DISTINCT p.plan_id) AS number_of_distinct_plans,
           COUNT(DISTINCT p.query_id) AS number_of_distinct_query_ids,
           SUM(   CASE
                      WHEN rs.execution_type_desc = 'Aborted' THEN
                          count_executions
                      ELSE 0
                  END
              ) AS Aborted_Execution_Count,
           SUM(   CASE
                      WHEN rs.execution_type_desc = 'Regular' THEN
                          count_executions
                      ELSE 0
                  END
              ) AS Regular_Execution_Count,
           SUM(   CASE
                      WHEN rs.execution_type_desc = 'Exception' THEN
                          count_executions
                      ELSE 0
                  END
              ) AS Exception_Execution_Count,
           SUM(count_executions) AS total_executions,
           MIN(qt.query_sql_text) AS sampled_query_text
    FROM sys.query_store_query_text AS qt
        INNER JOIN sys.query_store_query AS q ON qt.query_text_id = q.query_text_id
        INNER JOIN sys.query_store_plan AS p ON q.query_id = p.query_id
        INNER JOIN sys.query_store_runtime_stats AS rs ON rs.plan_id = p.plan_id
        INNER JOIN sys.query_store_runtime_stats_interval AS rsi ON rsi.runtime_stats_interval_id = rs.runtime_stats_interval_id
    WHERE rs.execution_type_desc IN ( 'Regular', 'Aborted', 'Exception' )
          AND rsi.start_time >= DATEADD(HOUR, -2, GETUTCDATE())
    GROUP BY q.query_hash),
     OrderedLogUsed
AS (SELECT query_hash,
           total_log_bytes_used,
           number_of_distinct_plans,
           number_of_distinct_query_ids,
           total_executions,
           Aborted_Execution_Count,
           Regular_Execution_Count,
           Exception_Execution_Count,
           sampled_query_text,
           ROW_NUMBER() OVER (ORDER BY total_log_bytes_used DESC, query_hash ASC) AS query_hash_row_number
    FROM AggregatedLogUsed)
SELECT OD.total_log_bytes_used,
       OD.number_of_distinct_plans,
       OD.number_of_distinct_query_ids,
       OD.total_executions,
       OD.Aborted_Execution_Count,
       OD.Regular_Execution_Count,
       OD.Exception_Execution_Count,
       OD.sampled_query_text,
       OD.query_hash_row_number
FROM OrderedLogUsed AS OD
WHERE OD.query_hash_row_number <= 15 -- get top 15 rows by total_log_bytes_used
ORDER BY total_log_bytes_used DESC;
GO
Identify tempdb performance issues
The common wait types associated with tempdb issues is PAGELATCH_* (not PAGEIOLATCH_*). However, PAGELATCH_* waits do not always mean you have tempdb contention. This wait may also mean that you have user-object data page contention due to concurrent requests targeting the same data page. To further confirm tempdb contention, use sys.dm_exec_requests to confirm that the wait_resource value begins with 2:x:y where 2 is tempdb is the database ID, x is the file ID, and y is the page ID.
For tempdb contention, a common method is to reduce or rewrite application code that relies on tempdb. Common tempdb usage areas include:
- Temp tables
- Table variables
- Table-valued parameters
- Queries that have query plans that use sorts, hash joins, and spools
For more information, see tempdb in Azure SQL.
All databases in an elastic pool share the same tempdb database. A high tempdb space utilization by one database might affect other databases in the same elastic pool.
Top queries that use table variables and temporary tables
Use the following query to identify top queries that use table variables and temporary tables:
SELECT plan_handle, execution_count, query_plan
INTO #tmpPlan
FROM sys.dm_exec_query_stats
     CROSS APPLY sys.dm_exec_query_plan(plan_handle);
GO

WITH XMLNAMESPACES('http://schemas.microsoft.com/sqlserver/2004/07/showplan' AS sp)
SELECT plan_handle, stmt.stmt_details.value('@Database', 'varchar(max)') AS 'Database'
, stmt.stmt_details.value('@Schema', 'varchar(max)') AS 'Schema'
, stmt.stmt_details.value('@Table', 'varchar(max)') AS 'table'
INTO #tmp2
FROM
    (SELECT CAST(query_plan AS XML) sqlplan, plan_handle FROM #tmpPlan) AS p
        CROSS APPLY sqlplan.nodes('//sp:Object') AS stmt(stmt_details);
GO

SELECT t.plan_handle, [Database], [Schema], [table], execution_count
FROM
    (SELECT DISTINCT plan_handle, [Database], [Schema], [table]
     FROM #tmp2
     WHERE [table] LIKE '%@%' OR [table] LIKE '%#%') AS t
        INNER JOIN #tmpPlan AS t2 ON t.plan_handle=t2.plan_handle;
GO
DROP TABLE #tmpPlan
DROP TABLE #tmp2
Identify long running transactions
Use the following query to identify long running transactions. Long running transactions prevent persistent version store (PVS) cleanup. For more information, see Troubleshoot accelerated database recovery.
SELECT DB_NAME(dtr.database_id) 'database_name',
       sess.session_id,
       atr.name AS 'tran_name',
       atr.transaction_id,
       transaction_type,
       transaction_begin_time,
       database_transaction_begin_time,
       transaction_state,
       is_user_transaction,
       sess.open_transaction_count,
       TRIM(REPLACE(
                REPLACE(
                            SUBSTRING(
                                        SUBSTRING(
                                                    txt.text,
                                                    (req.statement_start_offset / 2) + 1,
                                                    ((CASE req.statement_end_offset
                                                            WHEN -1 THEN
                                                                DATALENGTH(txt.text)
                                                            ELSE
                                                                req.statement_end_offset
                                                        END - req.statement_start_offset
                                                    ) / 2
                                                    ) + 1
                                                ),
                                        1,
                                        1000
                                    ),
                            CHAR(10),
                            ' '
                        ),
                CHAR(13),
                ' '
            )
            ) Running_stmt_text,
       recenttxt.text 'MostRecentSQLText'
FROM sys.dm_tran_active_transactions AS atr
    INNER JOIN sys.dm_tran_database_transactions AS dtr
        ON dtr.transaction_id = atr.transaction_id
    LEFT JOIN sys.dm_tran_session_transactions AS sess
        ON sess.transaction_id = atr.transaction_id
    LEFT JOIN sys.dm_exec_requests AS req
        ON req.session_id = sess.session_id
           AND req.transaction_id = sess.transaction_id
    LEFT JOIN sys.dm_exec_connections AS conn
        ON sess.session_id = conn.session_id
    OUTER APPLY sys.dm_exec_sql_text(req.sql_handle) AS txt
    OUTER APPLY sys.dm_exec_sql_text(conn.most_recent_sql_handle) AS recenttxt
WHERE atr.transaction_type != 2
      AND sess.session_id != @@spid
ORDER BY start_time ASC;
Identify memory grant wait performance issues
If your top wait type is RESOURCE_SEMAPHORE, you may have a memory grant waiting issue where queries cannot start executing until they get a sufficiently large memory grant.
Determine if a RESOURCE_SEMAPHORE wait is a top wait
Use the following query to determine if a RESOURCE_SEMAPHORE wait is a top wait. Also indicative would be a rising wait time rank of RESOURCE_SEMAPHORE in recent history. For more information on troubleshooting memory grant waiting issues, see Troubleshoot slow performance or low memory issues caused by memory grants in SQL Server.
SELECT wait_type,
       SUM(wait_time) AS total_wait_time_ms
FROM sys.dm_exec_requests AS req
    INNER JOIN sys.dm_exec_sessions AS sess
        ON req.session_id = sess.session_id
WHERE is_user_process = 1
GROUP BY wait_type
ORDER BY SUM(wait_time) DESC;
Identify high memory-consuming statements
If you encounter out of memory errors in Azure SQL Database, review sys.dm_os_out_of_memory_events. For more information, see Troubleshoot out of memory errors with Azure SQL Database.
First, modify the following script to update relevant values of start_time and end_time. Then, run the following query to identify high memory-consuming statements:
SELECT IDENTITY(INT, 1, 1) rowId,
    CAST(query_plan AS XML) query_plan,
    p.query_id
INTO #tmp
FROM sys.query_store_plan AS p
    INNER JOIN sys.query_store_runtime_stats AS r
        ON p.plan_id = r.plan_id
    INNER JOIN sys.query_store_runtime_stats_interval AS i
        ON r.runtime_stats_interval_id = i.runtime_stats_interval_id
WHERE start_time > '2018-10-11 14:00:00.0000000'
      AND end_time < '2018-10-17 20:00:00.0000000';

WITH cte
AS (SELECT query_id,
        query_plan,
        m.c.value('@SerialDesiredMemory', 'INT') AS SerialDesiredMemory
    FROM #tmp AS t
        CROSS APPLY t.query_plan.nodes('//*:MemoryGrantInfo[@SerialDesiredMemory[. > 0]]') AS m(c) )
SELECT TOP 50
    cte.query_id,
    t.query_sql_text,
    cte.query_plan,
    CAST(SerialDesiredMemory / 1024. AS DECIMAL(10, 2)) SerialDesiredMemory_MB
FROM cte
    INNER JOIN sys.query_store_query AS q
        ON cte.query_id = q.query_id
    INNER JOIN sys.query_store_query_text AS t
        ON q.query_text_id = t.query_text_id
ORDER BY SerialDesiredMemory DESC;
Identify the top 10 active memory grants
Use the following query to identify the top 10 active memory grants:
SELECT TOP 10
    CONVERT(VARCHAR(30), GETDATE(), 121) AS runtime,
       r.session_id,
       r.blocking_session_id,
       r.cpu_time,
       r.total_elapsed_time,
       r.reads,
       r.writes,
       r.logical_reads,
       r.row_count,
       wait_time,
       wait_type,
       r.command,
       OBJECT_NAME(txt.objectid, txt.dbid) 'Object_Name',
       TRIM(REPLACE(REPLACE(SUBSTRING(SUBSTRING(TEXT, (r.statement_start_offset / 2) + 1,
        (  (
            CASE r.statement_end_offset
                WHEN - 1
                    THEN DATALENGTH(TEXT)
                ELSE r.statement_end_offset
                END - r.statement_start_offset
            ) / 2
        ) + 1), 1, 1000), CHAR(10), ' '), CHAR(13), ' ')) AS stmt_text,
       mg.dop,                                               --Degree of parallelism
       mg.request_time,                                      --Date and time when this query requested the memory grant.
       mg.grant_time,                                        --NULL means memory has not been granted
       mg.requested_memory_kb / 1024.0 requested_memory_mb,  --Total requested amount of memory in megabytes
       mg.granted_memory_kb / 1024.0 AS granted_memory_mb,   --Total amount of memory actually granted in megabytes. NULL if not granted
       mg.required_memory_kb / 1024.0 AS required_memory_mb, --Minimum memory required to run this query in megabytes.
       max_used_memory_kb / 1024.0 AS max_used_memory_mb,
       mg.query_cost,                                        --Estimated query cost.
       mg.timeout_sec,                                       --Time-out in seconds before this query gives up the memory grant request.
       mg.resource_semaphore_id,                             --Non-unique ID of the resource semaphore on which this query is waiting.
       mg.wait_time_ms,                                      --Wait time in milliseconds. NULL if the memory is already granted.
       CASE mg.is_next_candidate --Is this process the next candidate for a memory grant
           WHEN 1 THEN
               'Yes'
           WHEN 0 THEN
               'No'
           ELSE
               'Memory has been granted'
       END AS 'Next Candidate for Memory Grant',
       qp.query_plan
FROM sys.dm_exec_requests AS r
    INNER JOIN sys.dm_exec_query_memory_grants AS mg
        ON r.session_id = mg.session_id
           AND r.request_id = mg.request_id
    CROSS APPLY sys.dm_exec_sql_text(mg.sql_handle) AS txt
    CROSS APPLY sys.dm_exec_query_plan(r.plan_handle) AS qp
ORDER BY mg.granted_memory_kb DESC;
Monitor connections
You can use the sys.dm_exec_connections view to retrieve information about the connections established to a specific database and the details of each connection. If a database is in an elastic pool and you have sufficient permissions, the view returns the set of connections for all databases in the elastic pool. In addition, the sys.dm_exec_sessions view is helpful when retrieving information about all active user connections and internal tasks.
View current sessions
The following query retrieves information for your current connection and session. To view all connections and sessions, remove the WHERE clause.
You see all executing sessions on the database only if you have VIEW DATABASE STATE permission on the database when executing the sys.dm_exec_requests and sys.dm_exec_sessions views. Otherwise, you see only the current session.
SELECT
    c.session_id, c.net_transport, c.encrypt_option,
    c.auth_scheme, s.host_name, s.program_name,
    s.client_interface_name, s.login_name, s.nt_domain,
    s.nt_user_name, s.original_login_name, c.connect_time,
    s.login_time
FROM sys.dm_exec_connections AS c
    INNER JOIN sys.dm_exec_sessions AS s
        ON c.session_id = s.session_id
WHERE c.session_id = @@SPID; --Remove to view all sessions, if permissions allow
Monitor query performance
Slow or long running queries can consume significant system resources. This section demonstrates how to use dynamic management views to detect a few common query performance problems using the sys.dm_exec_query_stats dynamic management view. The view contains one row per query statement within the cached plan, and the lifetime of the rows are tied to the plan itself. When a plan is removed from the cache, the corresponding rows are eliminated from this view. If a query does not have a cached plan, for example because OPTION (RECOMPILE) is used, it is not present in the results from this view.
Find top queries by CPU time
The following example returns information about the top 15 queries ranked by average CPU time per execution. This example aggregates the queries according to their query hash, so that logically equivalent queries are grouped by their cumulative resource consumption.
SELECT TOP 15 query_stats.query_hash AS Query_Hash,
    SUM(query_stats.total_worker_time) / SUM(query_stats.execution_count) AS Avg_CPU_Time,
     MIN(query_stats.statement_text) AS Statement_Text
FROM
    (SELECT QS.*,
        SUBSTRING(ST.text, (QS.statement_start_offset/2) + 1,
            ((CASE statement_end_offset
                WHEN -1 THEN DATALENGTH(ST.text)
                ELSE QS.statement_end_offset END
            - QS.statement_start_offset)/2) + 1) AS statement_text
FROM sys.dm_exec_query_stats AS QS
    CROSS APPLY sys.dm_exec_sql_text(QS.sql_handle) AS ST
    ) AS query_stats
GROUP BY query_stats.query_hash
ORDER BY Avg_CPU_Time DESC;
Monitor query plans for cumulative CPU time
An inefficient query plan also may increase CPU consumption. The following example determines which query uses the most cumulative CPU in recent history.
SELECT
    highest_cpu_queries.plan_handle,
    highest_cpu_queries.total_worker_time,
    q.dbid,
    q.objectid,
    q.number,
    q.encrypted,
    q.[text]
FROM
    (SELECT TOP 15
            qs.plan_handle,
            qs.total_worker_time
        FROM
            sys.dm_exec_query_stats AS qs
        ORDER BY qs.total_worker_time desc
    ) AS highest_cpu_queries
CROSS APPLY sys.dm_exec_sql_text(plan_handle) AS q
ORDER BY highest_cpu_queries.total_worker_time DESC;
Monitor blocked queries
Slow or long-running queries can contribute to excessive resource consumption and be the consequence of blocked queries. The cause of the blocking can be poor application design, bad query plans, the lack of useful indexes, and so on.
You can use the sys.dm_tran_locks view to get information about the current locking activity in database. For code examples, see sys.dm_tran_locks. For more information on troubleshooting blocking, see Understand and resolve Azure SQL blocking problems.
Monitor deadlocks
In some cases, two or more queries might block one another, resulting in a deadlock.
You can create an Extended Events trace to capture deadlock events, then find related queries and their execution plans in Query Store. Learn more in Analyze and prevent deadlocks in Azure SQL Database, including a lab to Cause a deadlock in AdventureWorksLT. Learn more about the types of resources that can deadlock.
Related content
- Introduction to Azure SQL Database and Azure SQL Managed Instance
- Diagnose and troubleshoot high CPU on Azure SQL Database
- Tune applications and databases for performance in Azure SQL Database
- Understand and resolve Azure SQL Database blocking problems
- Analyze and prevent deadlocks in Azure SQL Database
- Monitor Azure SQL workloads with database watcher (preview)