Inventory and visibility in Azure
Inventory and visibility is the first of three disciplines in a cloud management baseline.
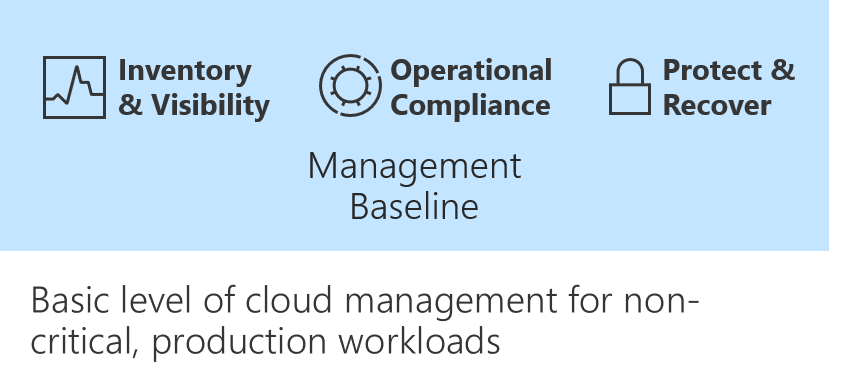
This discipline comes first because collecting proper operational data is vital when you make decisions about operations. Cloud management teams must understand what is managed and how well those assets are operated. This article describes the different tools that provide both an inventory and visibility into the inventory's run state.
For any enterprise-grade environment, the following table outlines the suggested minimum for a management baseline.
| Process | Tool | Purpose |
|---|---|---|
| Monitor health of Azure services | Azure Service Health | Health, performance, and diagnostics for services running in Azure |
| Log centralization | Log Analytics | Central logging for all visibility purposes |
| Monitoring centralization | Azure Monitor | Central monitoring of operational data and trends |
| Virtual machine inventory and change tracking | Change Tracking and Inventory in Azure Automation | Inventory VMs and monitor changes for guest OS level |
| Subscription monitoring | Azure activity log | Monitoring change at the subscription level |
| Guest OS monitoring | Azure Monitor for VMs | Monitoring changes and performance of VMs |
| Network monitoring | Azure Network Watcher | Monitoring network changes and performance |
| DNS monitoring | DNS Analytics | Security, performance, and operations of DNS |
Azure Service Health
Azure Service Health provides a personalized view of the health of your Azure services and regions. Information about active issues is posted to Azure Service Health to help you understand the effect on your resources. Regular updates keep you informed as issues are resolved.
We also publish planned maintenance events to Azure Service Health so you'll know about changes that can affect resource availability. Set up Service Health alerts to notify you when service issues, planned maintenance, or other changes might affect your Azure services and regions.
Azure Service Health includes:
- Azure status: A global view of the health of Azure services.
- Service health: A personalized view of the health of your Azure services.
- Resource health: A deeper view of the health of your individual resources.
Action
To set up a Service Health alert:
- Go to Service Health.
- Select Health alerts.
- Create a Service Health alert.
To set up Service Health alerts, go to the Azure portal.
Learn more
For more information, see Azure Service Health.
Log Analytics
A Log Analytics workspace is a unique environment for storing Azure Monitor log data. Each workspace has its own data repository and configuration. Data sources and solutions are configured to store their data in particular workspaces. Azure monitoring solutions require all servers to be connected to a workspace, so that their log data can be stored and accessed.
Azure Monitor provides a single unified hub for all monitoring and diagnostics data in Azure and gives you visibility across your resources. With Azure Monitor, you can find and fix problems and optimize performance. You can also understand customer behavior.
Monitor and visualize metrics. Metrics are numerical values available from Azure resources. They help you understand the health of your systems. Customize charts for your dashboards, and use workbooks for reporting.
Query and analyze logs. Logs include activity logs and diagnostic logs from Azure. Collect additional logs from other monitoring and management solutions for your cloud or on-premises resources. Log Analytics provides a central repository to aggregate all of this data. From there, you can run queries to help troubleshoot issues or to visualize data.
Set up alerts and actions. Alerts notify you of critical conditions. Corrective actions can be taken based on triggers from metrics, logs, or service-health issues. You can set up different notifications and actions and can also send data to your IT service management tools.
Start monitoring your:
To monitor other resources, find additional solutions in Azure Marketplace.
To explore Azure Monitor, go to the Azure portal.
Learn more
To learn more, see Azure Monitor documentation.
Onboard solutions
To enable solutions, you need to configure the Log Analytics workspace. Onboarded Azure VMs and on-premises servers get the solutions from the Log Analytics workspaces they're connected to.
There are two approaches to onboarding:
Each article guides you through a series of steps to onboard these solutions:
- Update Management in Azure Automation
- Change Tracking and Inventory in Azure Automation
- Azure activity log
- Azure Log Analytics Agent Health
- Antimalware assessment
- Azure Monitor for VMs
- Microsoft Defender for Cloud
Each of the previous steps helps establish inventory and visibility.
Microsoft Cloud for Sovereignty transparency logs
If you're using Microsoft Cloud for Sovereignty, you can use transparency logs to understand when Microsoft engineers access your resources. These logs help with sovereignty compliance and other regulatory requirements.
Tilbakemeldinger
Kommer snart: Gjennom 2024 faser vi ut GitHub Issues som tilbakemeldingsmekanisme for innhold, og erstatter det med et nytt system for tilbakemeldinger. Hvis du vil ha mer informasjon, kan du se: https://aka.ms/ContentUserFeedback.
Send inn og vis tilbakemelding for