Merk
Tilgang til denne siden krever autorisasjon. Du kan prøve å logge på eller endre kataloger.
Tilgang til denne siden krever autorisasjon. Du kan prøve å endre kataloger.
Note
The Basic, Standard, and Enterprise plans entered a retirement period on March 17, 2025. For more information, see the Azure Spring Apps retirement announcement.
This article applies to: ✅ Basic/Standard ✅ Enterprise
This article explains how to generate and collect structured application log data in Azure Spring Apps. With proper configuration, Azure Spring Apps provides useful application log query and analysis through Log Analytics.
Log schema requirements
To improve log query experience, an application log is required to be in JSON format and conform to a schema. Azure Spring Apps uses this schema to parse your application and stream to Log Analytics.
Note
Enabling the JSON log format makes it difficult to read the log streaming output from console. To get human readable output, append the --format-json argument to the az spring app logs CLI command. See Format JSON structured logs.
JSON schema requirements:
| JSON Key | JSON value Type | Required | Column in Log Analytics | Description |
|---|---|---|---|---|
| timestamp | string | Yes | AppTimestamp | timestamp in UTC format |
| logger | string | No | Logger | logger |
| level | string | No | CustomLevel | log level |
| thread | string | No | Thread | thread |
| message | string | No | Message | log message |
| stackTrace | string | No | StackTrace | exception stack trace |
| exceptionClass | string | No | ExceptionClass | exception class name |
| mdc | nested JSON | No | mapped diagnostic context | |
| mdc.traceId | string | No | TraceId | trace ID for distributed tracing |
| mdc.spanId | string | No | SpanId | span ID for distributed tracing |
- The "timestamp" field is required, and should be in UTC format, all other fields are optional.
- "traceId" and "spanId" in "mdc" field are used for tracing purpose.
- Log each JSON record in one line.
Log record sample
{"timestamp":"2021-01-08T09:23:51.280Z","logger":"com.example.demo.HelloController","level":"ERROR","thread":"http-nio-1456-exec-4","mdc":{"traceId":"c84f8a897041f634","spanId":"c84f8a897041f634"},"stackTrace":"java.lang.RuntimeException: get an exception\r\n\tat com.example.demo.HelloController.throwEx(HelloController.java:54)\r\n\","message":"Got an exception","exceptionClass":"RuntimeException"}
Limitations
Each line of the JSON logs has at most 16 K bytes. If the JSON output of a single log record exceeds this limit, it's broken into multiple lines, and each raw line is collected into the Log column without being parsed structurally.
Generally, this situation happens on exception logging with deep stacktrace, especially when the AppInsights In-Process Agent is enabled. Apply limit settings to the stacktrace output (see the below configuration samples) to ensure the final output gets parsed properly.
Generate schema-compliant JSON log
For Spring applications, you can generate expected JSON log format using common logging frameworks, such as Logback and Log4j2.
Log with logback
When using Spring Boot starters, Logback is used by default. For Logback apps, use logstash-encoder to generate JSON formatted log. This method is supported in Spring Boot version 2.1 or later.
The procedure:
Add logstash dependency in your pom.xml file.
<dependency>
    <groupId>net.logstash.logback</groupId>
    <artifactId>logstash-logback-encoder</artifactId>
    <version>6.5</version>
</dependency>
Update your
logback-spring.xmlconfig file to set the JSON format.<configuration> <appender name="stdout" class="ch.qos.logback.core.ConsoleAppender"> <encoder class="net.logstash.logback.encoder.LoggingEventCompositeJsonEncoder"> <providers> <timestamp> <fieldName>timestamp</fieldName> <timeZone>UTC</timeZone> </timestamp> <loggerName> <fieldName>logger</fieldName> </loggerName> <logLevel> <fieldName>level</fieldName> </logLevel> <threadName> <fieldName>thread</fieldName> </threadName> <nestedField> <fieldName>mdc</fieldName> <providers> <mdc /> </providers> </nestedField> <stackTrace> <fieldName>stackTrace</fieldName> <!-- maxLength - limit the length of the stack trace --> <throwableConverter class="net.logstash.logback.stacktrace.ShortenedThrowableConverter"> <maxDepthPerThrowable>200</maxDepthPerThrowable> <maxLength>14000</maxLength> <rootCauseFirst>true</rootCauseFirst> </throwableConverter> </stackTrace> <message /> <throwableClassName> <fieldName>exceptionClass</fieldName> </throwableClassName> </providers> </encoder> </appender> <root level="info"> <appender-ref ref="stdout" /> </root> </configuration>When using the logging configuration file with
-springsuffix likelogback-spring.xml, you can set the logging configuration based on the Spring active profile.<configuration> <springProfile name="dev"> <!-- JSON appender definitions for local development, in human readable format --> <include resource="org/springframework/boot/logging/logback/defaults.xml" /> <include resource="org/springframework/boot/logging/logback/console-appender.xml" /> <root level="info"> <appender-ref ref="CONSOLE" /> </root> </springProfile> <springProfile name="!dev"> <!-- JSON appender configuration from previous step, used for staging / production --> ... </springProfile> </configuration>For local development, run the Spring application with JVM argument
-Dspring.profiles.active=dev, then you can see human readable logs instead of JSON formatted lines.
Log with log4j2
For log4j2 apps, use json-template-layout to generate JSON formatted log. This method is supported in Spring Boot version 2.1+.
The procedure:
Exclude
spring-boot-starter-loggingfromspring-boot-starter, add dependenciesspring-boot-starter-log4j2,log4j-layout-template-jsonin your pom.xml file.<dependency> <groupId>org.springframework.boot</groupId> <artifactId>spring-boot-starter-web</artifactId> <exclusions> <exclusion> <groupId>org.springframework.boot</groupId> <artifactId>spring-boot-starter-logging</artifactId> </exclusion> </exclusions> </dependency> <dependency> <groupId>org.springframework.boot</groupId> <artifactId>spring-boot-starter-log4j2</artifactId> </dependency> <dependency> <groupId>org.apache.logging.log4j</groupId> <artifactId>log4j-layout-template-json</artifactId> <version>2.14.0</version> </dependency>Prepare a JSON layout template file
jsonTemplate.jsonin your class path.{ "mdc": { "$resolver": "mdc" }, "exceptionClass": { "$resolver": "exception", "field": "className" }, "stackTrace": { "$resolver": "exception", "field": "stackTrace", "stringified": true }, "message": { "$resolver": "message", "stringified": true }, "thread": { "$resolver": "thread", "field": "name" }, "timestamp": { "$resolver": "timestamp", "pattern": { "format": "yyyy-MM-dd'T'HH:mm:ss.SSS'Z'", "timeZone": "UTC" } }, "level": { "$resolver": "level", "field": "name" }, "logger": { "$resolver": "logger", "field": "name" } }Use this JSON layout template in your
log4j2-spring.xmlconfig file.<configuration> <appenders> <console name="Console" target="SYSTEM_OUT"> <!-- maxStringLength - limit the length of the stack trace --> <JsonTemplateLayout eventTemplateUri="classpath:jsonTemplate.json" maxStringLength="14000" /> </console> </appenders> <loggers> <root level="info"> <appender-ref ref="Console" /> </root> </loggers> </configuration>
Analyze the logs in Log Analytics
After your application is properly set up, your application console log is streamed to Log Analytics. The structure enables efficient query in Log Analytics.
Check log structure in Log Analytics
Use the following procedure:
Go to service overview page of your service instance.
Select the Logs entry in the Monitoring section.
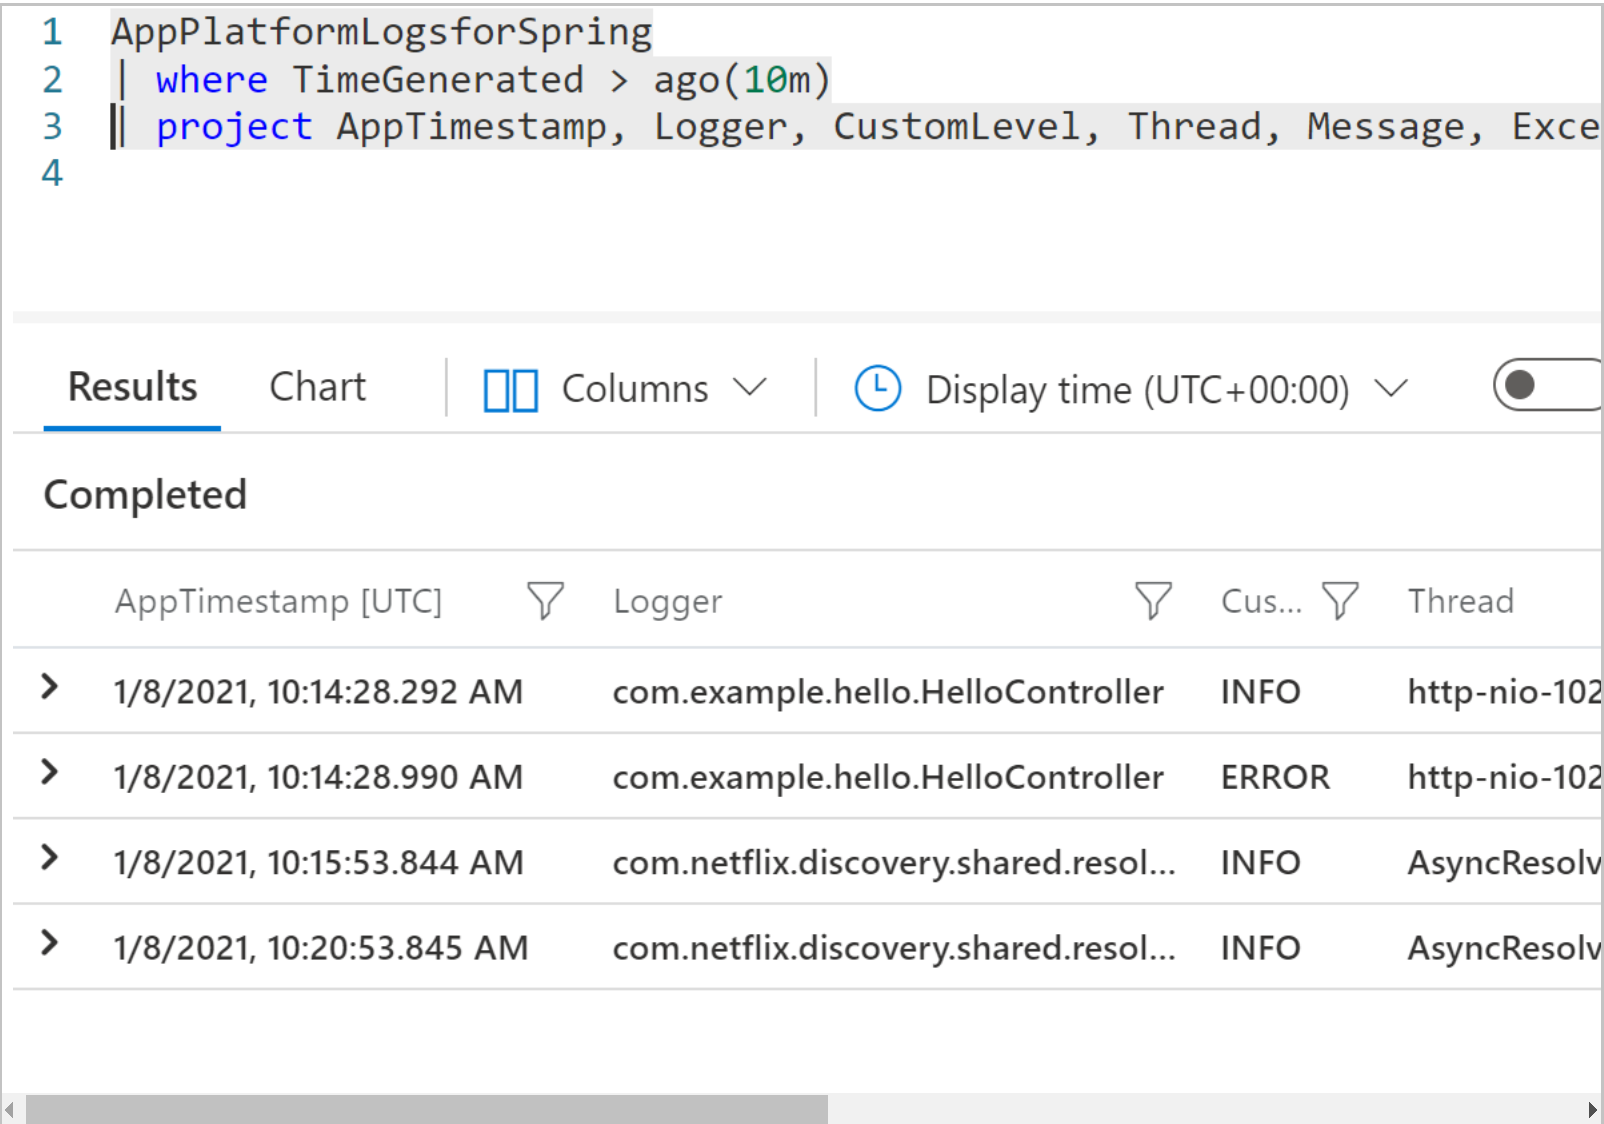
Run this query.
AppPlatformLogsforSpring
| where TimeGenerated > ago(1h)
| project AppTimestamp, Logger, CustomLevel, Thread, Message, ExceptionClass, StackTrace, TraceId, SpanId
Application logs return as shown in the following image:

Show log entries containing errors
To review log entries that have an error, run the following query:
AppPlatformLogsforSpring
| where TimeGenerated > ago(1h) and CustomLevel == "ERROR"
| project AppTimestamp, Logger, ExceptionClass, StackTrace, Message, AppName
| sort by AppTimestamp
Use this query to find errors, or modify the query terms to find specific exception class or error code.
Show log entries for a specific traceId
To review log entries for a specific tracing ID "trace_id", run the following query:
AppPlatformLogsforSpring
| where TimeGenerated > ago(1h)
| where TraceId == "trace_id"
| project AppTimestamp, Logger, TraceId, SpanId, StackTrace, Message, AppName
| sort by AppTimestamp
Next steps
- To learn more about the Log Query, see Get started with log queries in Azure Monitor