Monitor Autoscale operations with Insights in Azure Virtual Desktop
Autoscale lets you scale your session host virtual machines (VMs) in a host pool up or down according to schedule to optimize deployment costs. Autoscale diagnostic data, integrated with Insights in Azure Virtual Desktop, enables you to monitor scaling operations, identify issues that need to be fixed, and recognize opportunities to optimize your scaling plan configuration to save cost.
To learn more about autoscale, see Autoscale scaling plans and example scenarios, and for Insights in Azure Virtual Desktop, see Enable Insights to monitor Azure Virtual Desktop.
Note
You can only monitor Autoscale operations with Insights with pooled host pools. For personal host pools, see Set up diagnostics for Autoscale in Azure Virtual Desktop.
Prerequisites
Before you can monitor Autoscale operations with Insights, you need:
A pooled host pool with a scaling plan assigned. Personal host pools aren't supported.
Insights configured for your host pool and its related workspace. To learn how to configure Insights, see Enable Insights to monitor Azure Virtual Desktop.
An Azure account that is assigned the following role-based access control (RBAC) roles, depending on your scenario:
Scenario RBAC roles Scope Configure diagnostic settings Desktop Virtualization Contributor Assigned on the resource group or subscription for your host pools, workspaces, and session hosts. View and query data Desktop Virtualization Reader
Log Analytics Reader- Desktop Virtualization Reader assigned on the resource group or subscription where the host pools, workspaces, and session hosts are.
- Log Analytics Reader assigned on any Log Analytics workspace used for Azure Virtual Desktop Insights.11. You can also create a custom role to reduce the scope of assignment on the Log Analytics workspace. For more information, see Manage access to Log Analytics workspaces.
Configure diagnostic settings and verify Insights workbook configuration
First, you need to make sure that diagnostic settings are configured to send the necessary logs from your host pool and workspace to your Log Analytics workspace.
Enable Autoscale logs for a host pool
In addition to existing host pool logs that you're already sending to a Log Analytics workspace, you also need to send Autoscale logs for a host pool:
Sign in to the Azure portal.
In the search bar, type Azure Virtual Desktop and select the matching service entry.
From the Azure Virtual Desktop overview page, select Host pools, then select the pooled host pool for which you want to enable Autoscale logs.
From the host pool overview page, select Diagnostic settings.
Select Add diagnostic setting, or select an existing diagnostic setting to edit.
Select the following categories as a minimum. If you already have some of these categories selected for this host pool as part of this diagnostic setting or an existing one, don't select them again, otherwise you get an error when you save the diagnostic setting.
- Checkpoint
- Error
- Management
- Connection
- HostRegistration
- AgentHealthStatus
- Autoscale logs for pooled host pools
For Destination details, select Send to Log Analytics workspace.
Select Save.
Verify workspace logs
Verify that you're already sending the required logs for a workspace to a Log Analytics workspace:
From the Azure Virtual Desktop overview page, select Workspaces, then select the related workspace for the host pool you're monitoring.
From the workspace overview page, select Diagnostic settings.
Select Edit setting.
Make sure the following categories are enabled.
- Checkpoint
- Error
- Management
- Feed
For Destination details, ensure you're sending data to the same Log Analytics workspace as the host pool.
If you made changes, select Save.
Verify Insights workbook configuration
You need to verify that your Insights workbook is configured correctly for your host pool:
From the Azure Virtual Desktop overview page, select Host pools, then select the pooled host pool you're monitoring.
From the host pool overview page, select Insights if you're using the Azure Monitor Agent on your session hosts, or Insights (Legacy) if you're using the Log Analytics Agent on your session hosts.
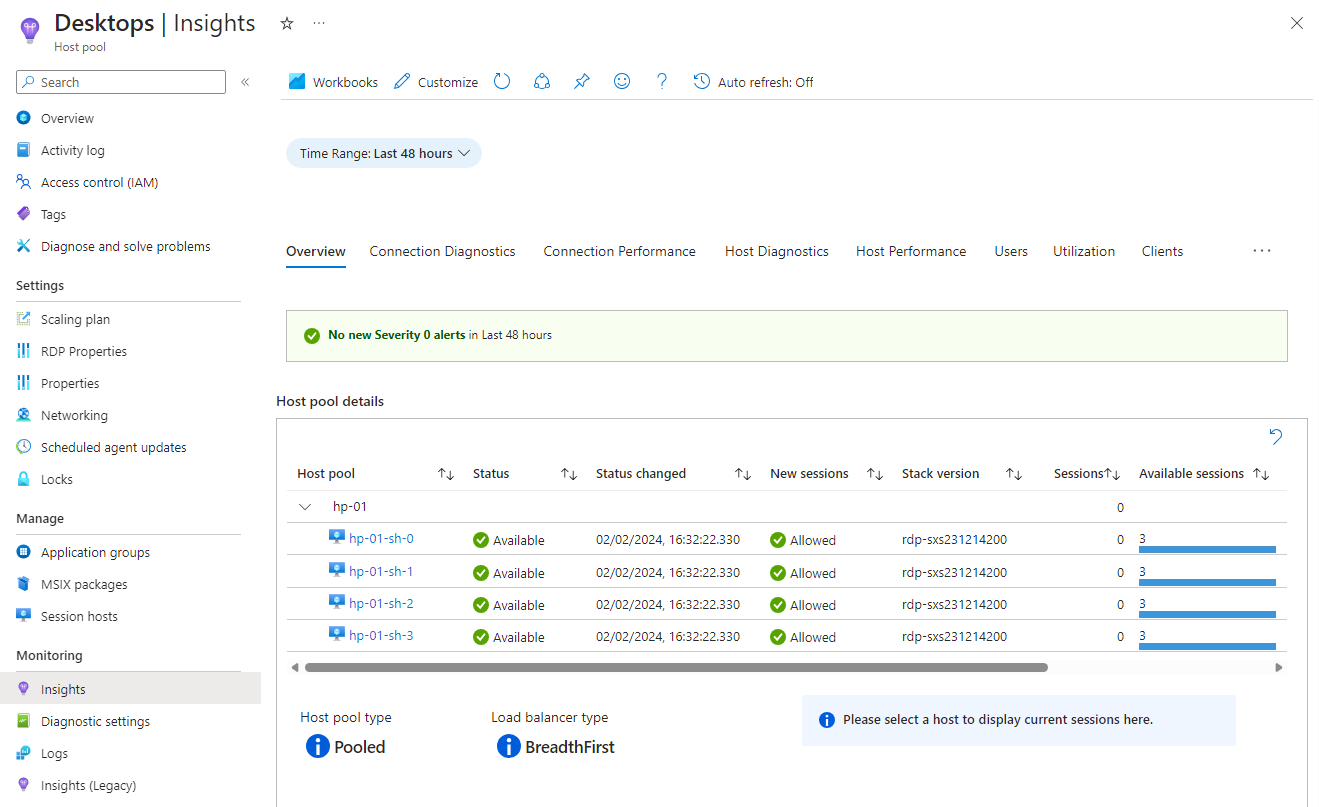
Ensure there aren't outstanding configuration issues. If there are, you see messages such as:
- Azure Monitor is not configured for session hosts.
- Azure Monitor is not configured for the selected AVD host pool.
- There are session hosts not sending data to the expected Log Analytics workspace.
You need to complete the configuration in the relevant workbook to resolve these issues. For more information, see Enable Insights to monitor Azure Virtual Desktop. When there are no configuration issues, Insights should look similar to the following image:
View Autoscale insights
After you configured your diagnostic settings and verified your Insights workbook configuration, you can view Autoscale insights:
From the Azure Virtual Desktop overview page, select Host pools, then select the pooled host pool for which you want to view Autoscale insights.
From the host pool overview page, select Insights if you're using the Azure Monitor Agent on your session hosts, or Insights (Legacy) if you're using the Log Analytics Agent on your session hosts.
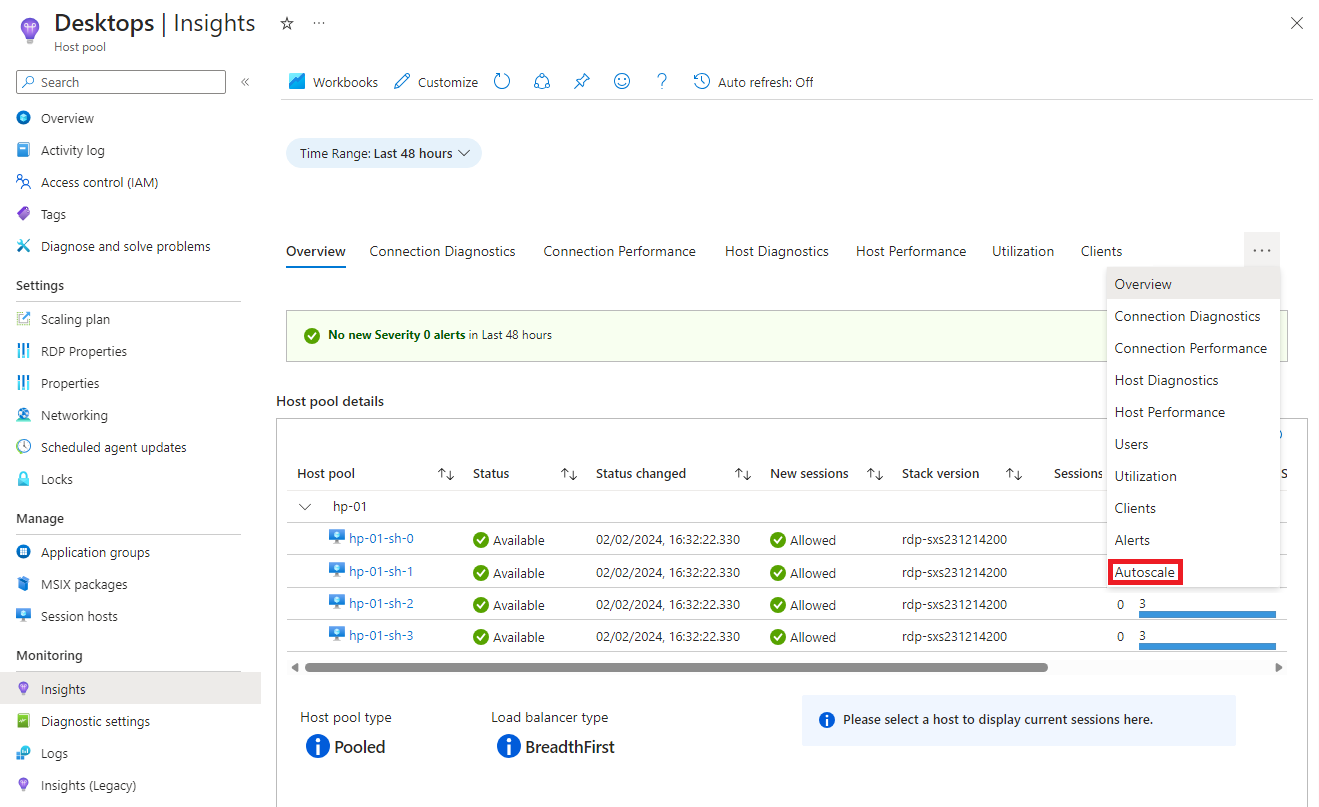
Select Autoscale from the row of tabs. Depending on your display's width, you might need to select the ellipses ... button to show the full list with Autoscale.
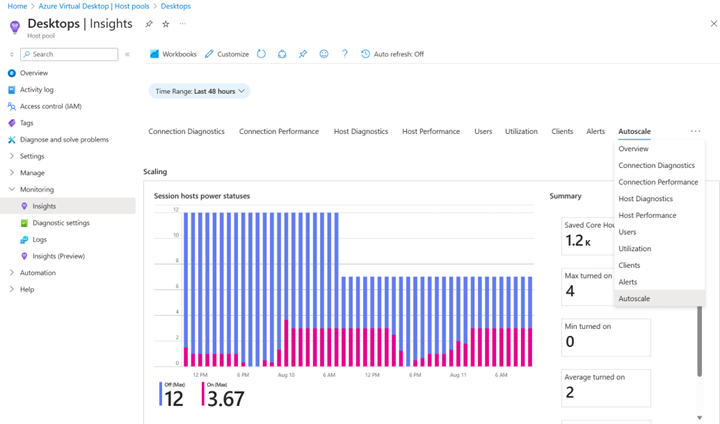
Insights shows information about the Autoscale operations for your host pool, such as a graph of the change in power state of your session hosts in the host pool over time, and summary information.
Queries for Autoscale data in Log Analytics
For additional information about Autoscale operations, you can use run queries against the data in Log Analytics. The data is written to the WVDAutoscaleEvaluationPooled table. The following sections contain the schema and some example queries. To learn how to run queries in Log Analytics, see Log Analytics tutorial.
WVDAutoscaleEvaluationPooled Schema
The following table details the schema for the WVDAutoscaleEvaluationPooled table, which contains the results of an Autoscale scaling plan evaluation on a host pool. The information includes the actions Autoscale took on the session hosts, such as starting or deallocating them, and why it took those actions. The entries that start with Config contain the scaling plan configuration values for an Autoscale schedule phase. If the ResultType value is Failed, join to the WVDErrors table using the CorrelationId to get more details.
| Name | Type | Description |
|---|---|---|
ActiveSessionHostCount |
Int | Number of session hosts accepting user connections. |
ActiveSessionHostsPercent |
Double | Percent of session hosts in the host pool considered active by Autoscale. |
ConfigCapacityThresholdPercent |
Double | Capacity threshold percent. |
ConfigMinActiveSessionHostsPercent |
Double | Minimum percent of session hosts that should be active. |
ConfigScheduleName |
String | Name of schedule used in the evaluation. |
ConfigSchedulePhase |
String | Schedule phase at the time of evaluation. |
CorrelationId |
String | A GUID generated for this Autoscale evaluation. |
ExcludedSessionHostCount |
Int | Number of session hosts excluded from Autoscale management. |
MaxSessionLimitPerSessionHost |
Int | The MaxSessionLimit value defined on the host pool. This value is the maximum number of user sessions allowed per session host. |
Properties |
Dynamic | Additional information. |
ResultType |
String | Status of this evaluation event. |
ScalingEvaluationStartTime |
DateTime | The timestamp (UTC) when the Autoscale evaluation started. |
ScalingPlanResourceId |
String | Resource ID of the Autoscale scaling plan. |
ScalingReasonMessage |
String | The actions Autoscale decided to perform and why it took those actions. |
SessionCount |
Int | Number of user sessions; only the user sessions from session hosts that are considered active by Autoscale are included. |
SessionOccupancyPercent |
Double | Percent of session host capacity occupied by user sessions. |
TimeGenerated |
DateTime | The timestamp (UTC) this event was generated. |
TotalSessionHostCount |
Int | Number of session hosts in the host pool. |
UnhealthySessionHostCount |
Int | Number of session hosts in a faulty state. |
Sample of data
The following query returns the 10 most recent rows of data for Autoscale:
WVDAutoscaleEvaluationPooled
| take 10
Failed evaluations with WVDErrors
The following query correlates the tables WVDAutoscaleEvaluationPooled and WVDErrors and returns entries where the ServiceError column in WVDErrors is false:
The following query returns Autoscale evaluations that failed, including those that partially failed. The query also joins to WVDErrors to provide more failure details where available. The corresponding entries in WVDErrors only contain results where ServiceError is false:
WVDAutoscaleEvaluationPooled
| where ResultType != "Succeeded"
| join kind=leftouter WVDErrors
    on CorrelationId
| order by _ResourceId asc, TimeGenerated asc, CorrelationId, TimeGenerated1 asc
Start, deallocate, and force logoff operations
The following query returns the number of attempted operations of session host start, session host deallocate, and user session force logoff per host pool, schedule name, schedule phase, and day:
WVDAutoscaleEvaluationPooled
| where ResultType == "Succeeded"
| extend properties = parse_json(Properties)
| extend BeganStartVmCount = toint(properties.BeganStartVmCount)
| extend BeganDeallocateVmCount = toint(properties.BeganDeallocateVmCount)
| extend BeganForceLogoffOnSessionHostCount = toint(properties.BeganForceLogoffOnSessionHostCount)
| summarize sum(BeganStartVmCount), sum(BeganDeallocateVmCount), sum(BeganForceLogoffOnSessionHostCount) by _ResourceId, bin(TimeGenerated, 1d), ConfigScheduleName, ConfigSchedulePhase
| order by _ResourceId asc, TimeGenerated asc, ConfigScheduleName, ConfigSchedulePhase asc
Maximum session occupancy and active session hosts
The following query returns the maximum session occupancy percent, session count, active session hosts percent, and active session host count per host pool, schedule name, schedule phase, and day:
WVDAutoscaleEvaluationPooled
| where ResultType == "Succeeded"
| summarize max(SessionOccupancyPercent), max(SessionCount), max(ActiveSessionHostsPercent), max(ActiveSessionHostCount) by _ResourceId, bin(TimeGenerated, 1d), ConfigScheduleName, ConfigSchedulePhase
| order by _ResourceId asc, TimeGenerated asc, ConfigScheduleName, ConfigSchedulePhase asc
Related content
For more information about the time for log data to become available after collection, see Log data ingestion time in Azure Monitor.
Tilbakemeldinger
Kommer snart: Gjennom 2024 faser vi ut GitHub Issues som tilbakemeldingsmekanisme for innhold, og erstatter det med et nytt system for tilbakemeldinger. Hvis du vil ha mer informasjon, kan du se: https://aka.ms/ContentUserFeedback.
Send inn og vis tilbakemelding for