Merk
Tilgang til denne siden krever autorisasjon. Du kan prøve å logge på eller endre kataloger.
Tilgang til denne siden krever autorisasjon. Du kan prøve å endre kataloger.
This tutorial introduces the debugging tools available in Visual Studio.
Important
All of the keyboard shortcuts are based on the defaults from Visual Studio. Your keyboard shortcuts may vary, for more information see Keyboard shortcuts in Visual Studio.
This tutorial introduces the debugging tools available in Visual Studio Code for working with .NET apps.
This tutorial introduces the debugging tools available in GitHub Codespaces for working with .NET apps.
Prerequisites
This tutorial works with the console app that you create in Create a .NET console application.
Use Debug build configuration
Debug and Release are Visual Studio's built-in build configurations. You use the Debug build configuration for debugging and the Release configuration for the final release distribution.
In the Debug configuration, a program compiles with full symbolic debug information and no optimization. Optimization complicates debugging, because the relationship between source code and generated instructions is more complex. The release configuration of a program has no symbolic debug information and is fully optimized.
By default, Visual Studio uses the Debug build configuration, so you don't need to change it before debugging.
Start Visual Studio.
Open the project that you created in Create a .NET console application.
The current build configuration is shown on the toolbar. The following toolbar image shows that Visual Studio is configured to compile the Debug version of the app:

Set a breakpoint
A breakpoint temporarily interrupts the execution of the application before the line with the breakpoint is run.
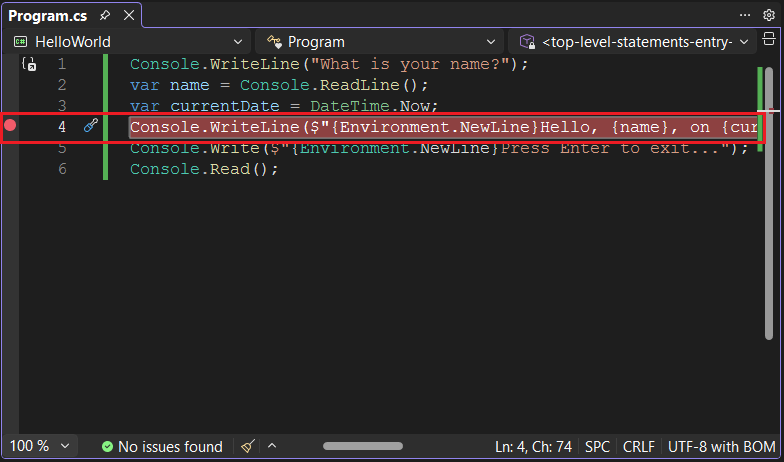
Set a breakpoint on the line that displays the name, date, and time, by clicking in the left margin of the code window on that line. The left margin is to the left of the line numbers. Other ways to set a breakpoint are by placing the cursor in the line of code and then pressing F9 or choosing Debug > Toggle Breakpoint from the menu bar.
As the following image shows, Visual Studio indicates the line on which the breakpoint is set by highlighting it and displaying a red dot in the left margin.
Press F5 to run the program in Debug mode. Another way to start debugging is by choosing Debug > Start Debugging from the menu.
Enter a string in the console window when the program prompts for a name, and then press Enter.
Program execution stops when it reaches the breakpoint and before the
Console.WriteLinemethod executes. The Locals window displays the values of variables that are defined in the currently executing method.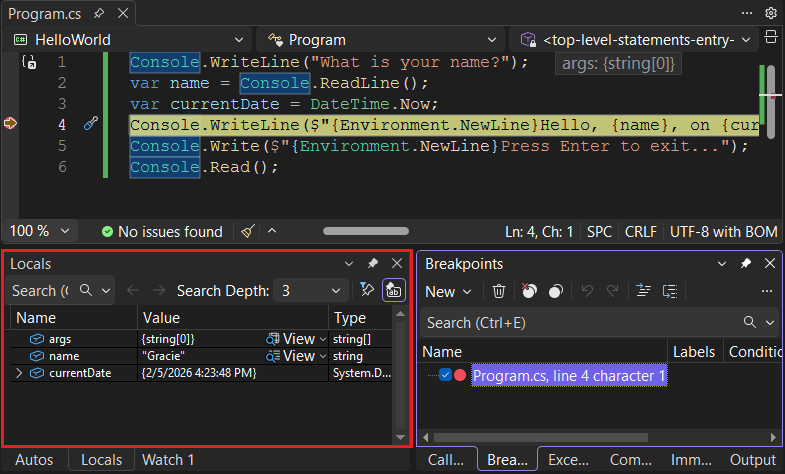
Start Visual Studio Code.
Open the folder of the project that you created in Create a .NET console application.
Open the Program.cs file.
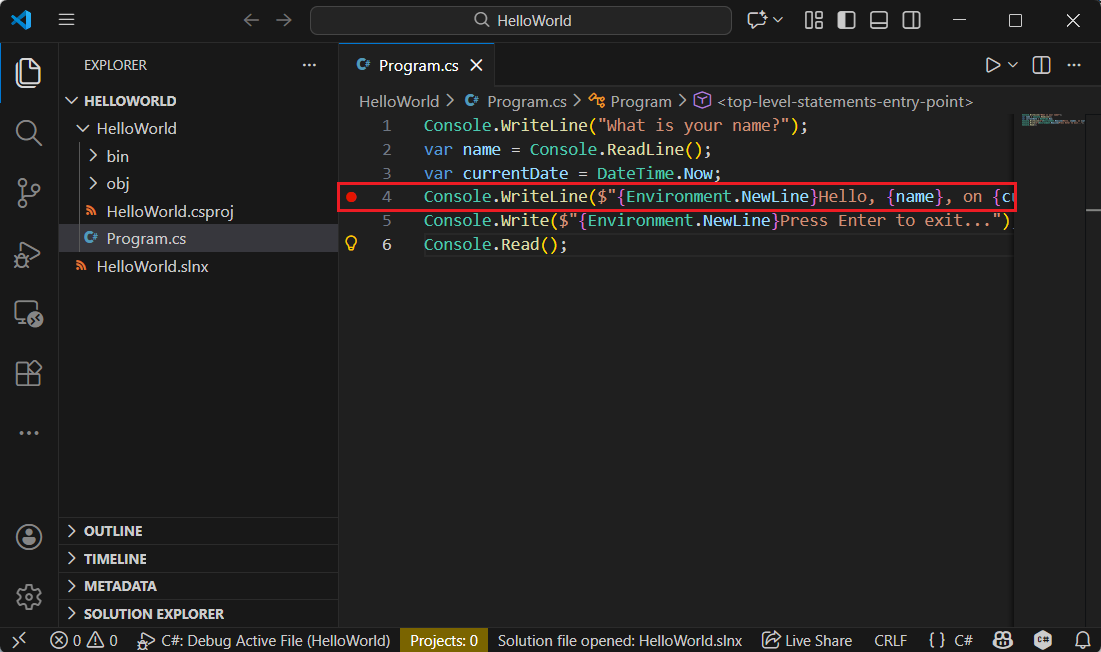
Set a breakpoint on the line that displays the name, date, and time, by clicking in the left margin of the code window. The left margin is to the left of the line numbers. Other ways to set a breakpoint are by pressing F9 or choosing Run > Toggle Breakpoint from the menu while the line of code is selected.
Visual Studio Code indicates the line on which the breakpoint is set by displaying a red dot in the left margin.
Open your GitHub Codespace that you created in Create a .NET console application.
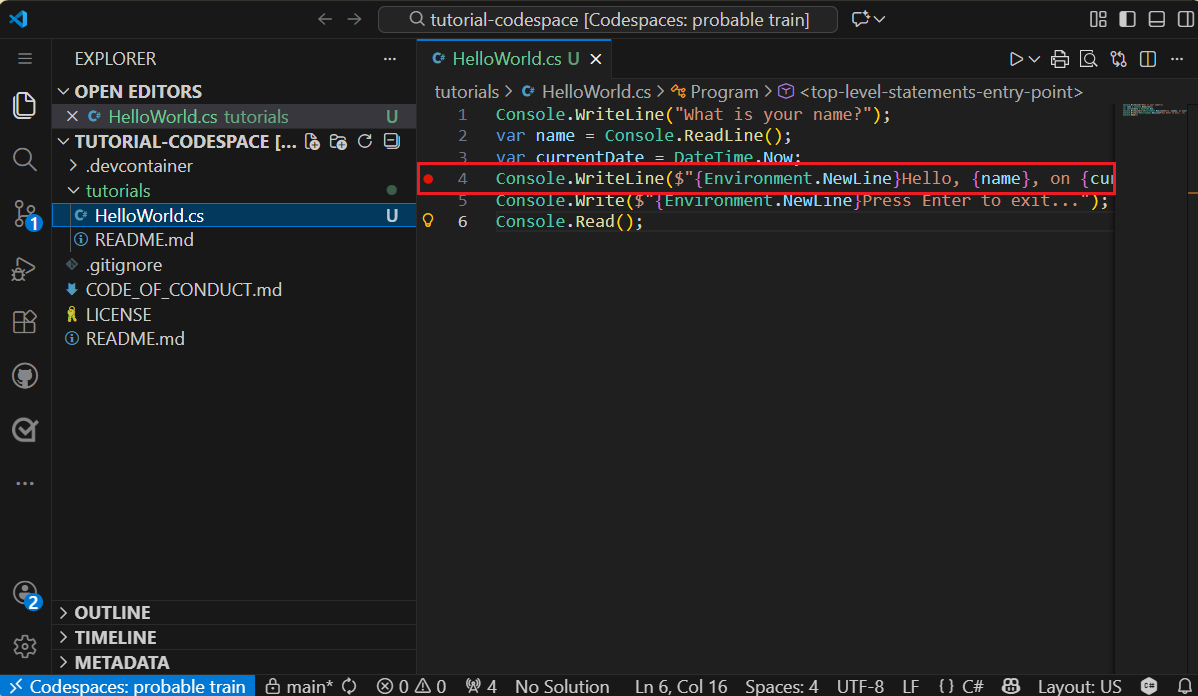
Open the HelloWorld.cs file.
Set a breakpoint on the line that displays the name, date, and time, by clicking in the left margin of the code window. The left margin is to the left of the line numbers. You can also set a breakpoint are by pressing F9 while the line of code is selected.
Start debugging
Program execution stops when it reaches the breakpoint, as described in the previous section. The Locals window displays the values of variables that are defined in the currently executing method.
Debug and Release are .NET's built-in build configurations. You use the Debug build configuration for debugging and the Release configuration for the final release distribution.
By default, Visual Studio Code launch settings use the Debug build configuration, so you don't need to change it before debugging.
Open the Debug view by selecting the Debugging icon on the left side menu.
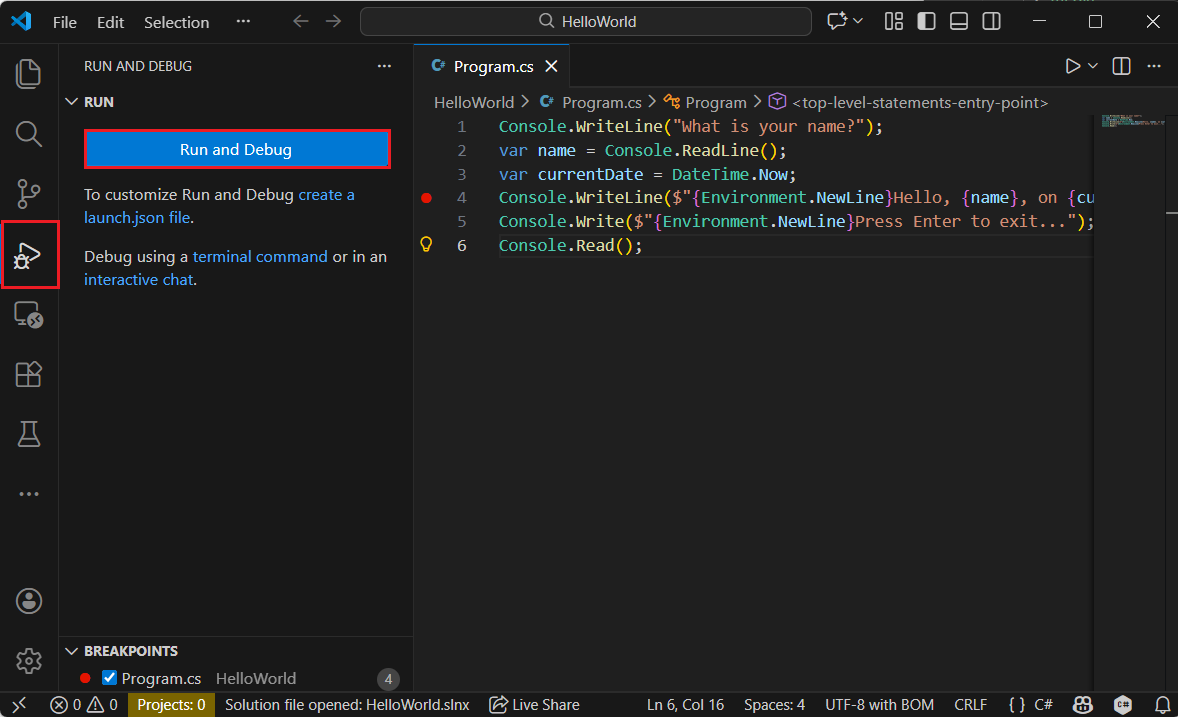
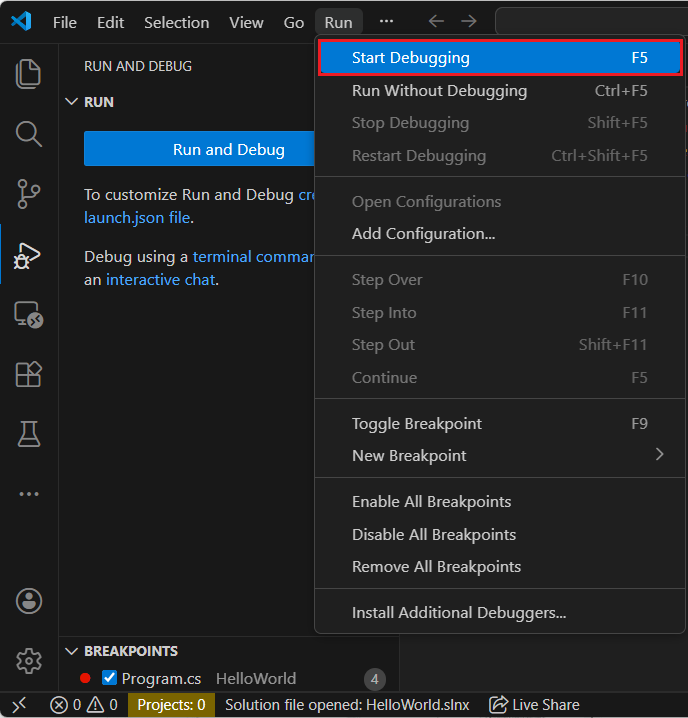
Select Run and Debug. If asked, select C# and then select C#: Launch startup project. Other ways to start the program in debugging mode are by pressing F5 or choosing Run > Start Debugging from the menu.
If asked to Select Launch Configuration, select C#: Debug Active File.
Select the Debug Console tab to see the "What is your name?" prompt that the program displays before waiting for a response.
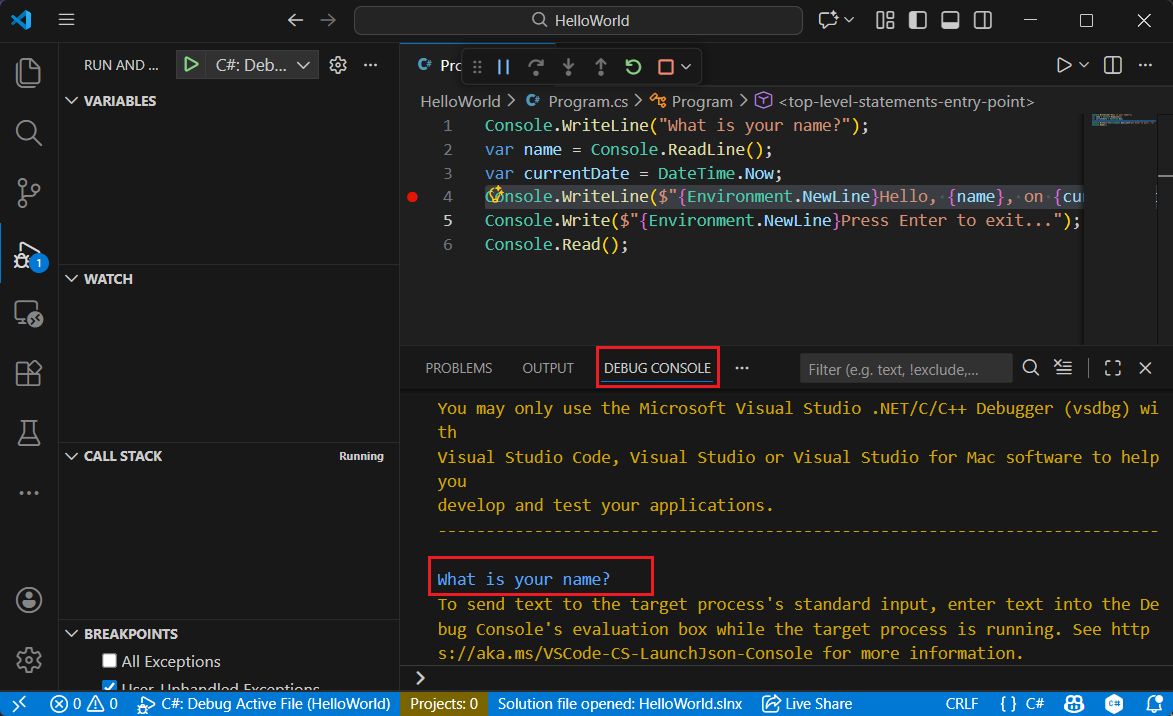
Enter a string in the Debug Console window in response to the prompt for a name, and then press Enter.
Program execution stops when it reaches the breakpoint and before the
Console.WriteLinemethod runs. The Locals section of the Variables window displays the values of variables that are defined in the currently running method.
By default, GitHub Codespaces uses the Debug build configuration, so you don't need to change it before debugging.
Open the Debug view by selecting the Debugging icon on the left side menu.
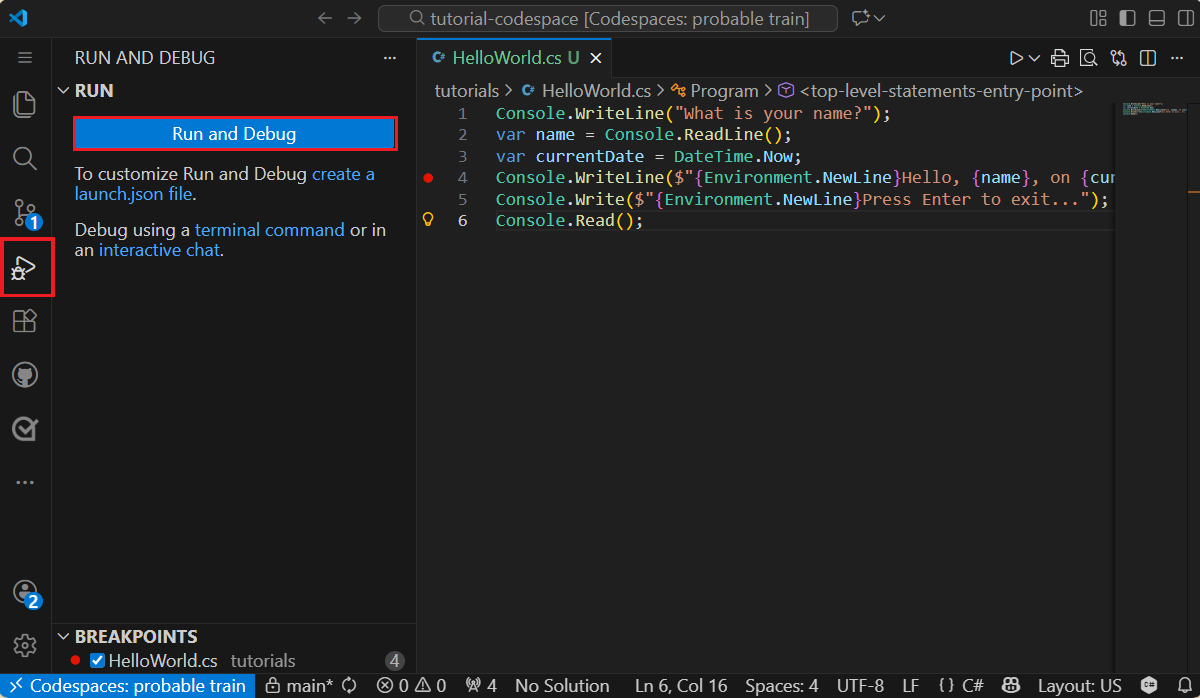
Select Run and Debug. If asked, select C# as the debugger and then select C#: Debug Active File as the Launch Configuration.
Select the Debug Console tab to see the "What is your name?" prompt that the program displays before waiting for a response.
Enter a string in the Debug Console window in response to the prompt for a name, and then press Enter.
Program execution stops when it reaches the breakpoint and before the
Console.WriteLinemethod runs. The Locals section of the Variables window displays the values of variables that are defined in the currently running method.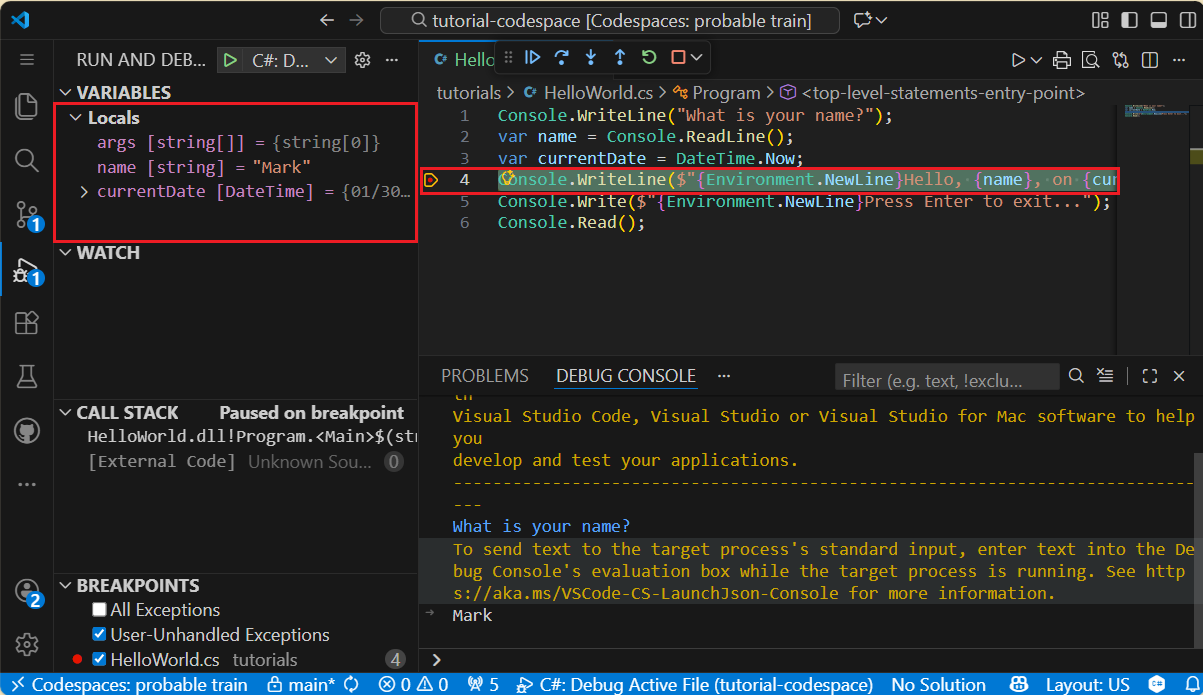
Use the Immediate window
The Immediate window lets you interact with the application you're debugging. You can interactively change the value of variables to see how it affects your program.
If the Immediate window is not visible, display it by choosing Debug > Windows > Immediate.
Enter
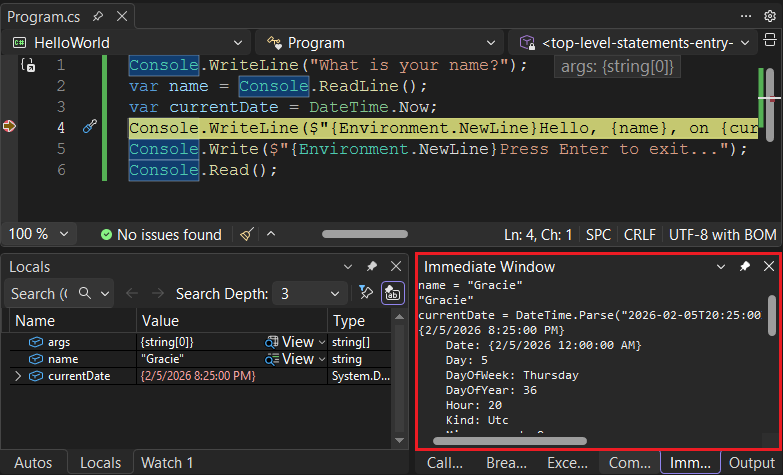
name = "Gracie"in the Immediate window and press the Enter key.Enter
currentDate = DateTime.Parse("2026-02-05T20:25:00Z").ToUniversalTime()in the Immediate window and press the Enter key.The Immediate window displays the value of the string variable and the properties of the DateTime value. In addition, the values of the variables are updated in the Locals window.
Press F5 to continue program execution. Another way to continue is by choosing Debug > Continue from the menu.
The values displayed in the console window correspond to the changes you made in the Immediate window.
Press any key to exit the application and stop debugging.
Use the Debug Console
The Debug Console window lets you interact with the application you're debugging. You can change the value of variables to see how it affects your program.
Select the Debug Console tab.
Enter
name = "Gracie"at the prompt at the bottom of the Debug Console window and press Enter.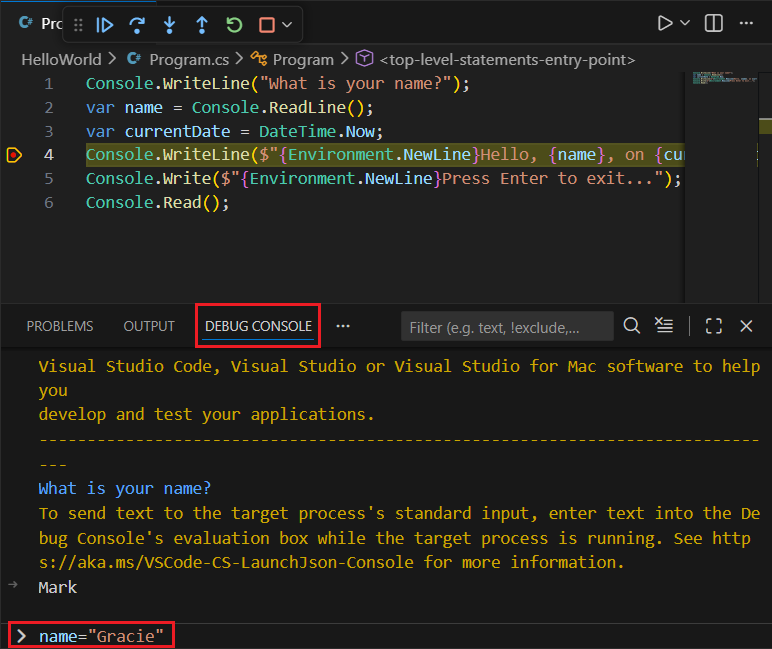
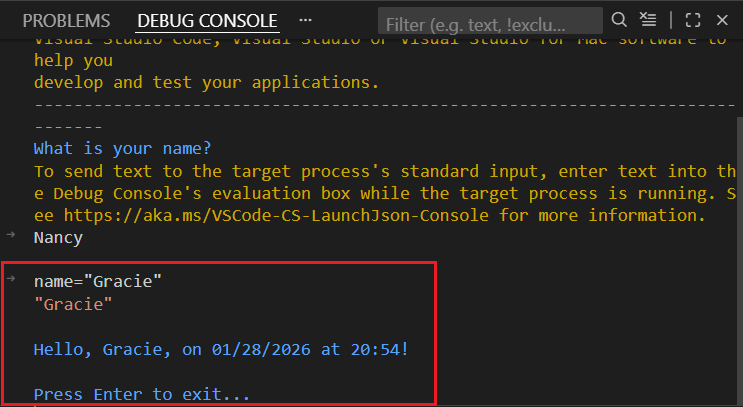
Enter
currentDate = DateTime.Parse("2026-01-28T20:54:00Z").ToUniversalTime()at the bottom of the Debug Console window and press Enter.The Variables window displays the new values of the
nameandcurrentDatevariables.Continue program execution by selecting the Continue button in the toolbar. Another way to continue is by pressing F5.

The values displayed in the console window correspond to the changes you made in the Debug Console.
Press Enter to exit the application and stop debugging.
Set a conditional breakpoint
The program displays the string that the user enters. What happens if the user doesn't enter anything? You can test this with a useful debugging feature called a conditional breakpoint.
Right-click on the red dot that represents the breakpoint. In the context menu, select Conditions to open the Breakpoint Settings dialog. Select the box for Conditions if it's not already selected.
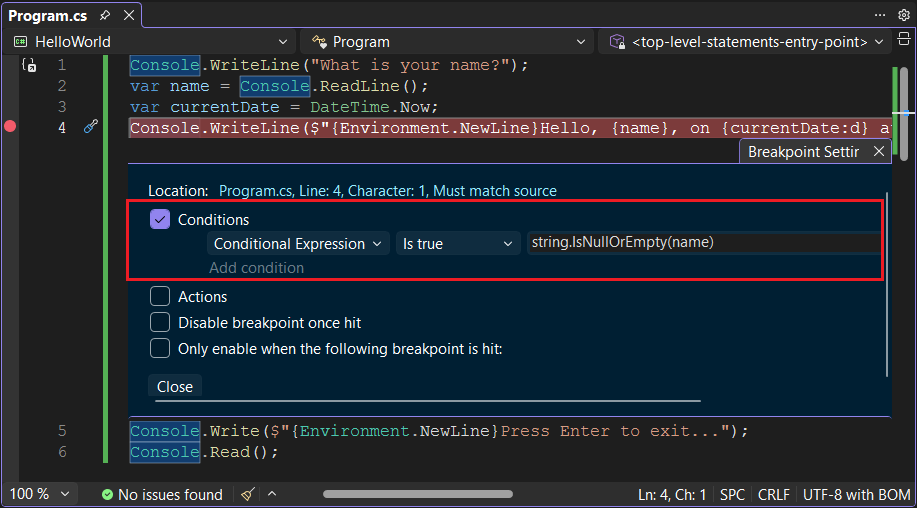
For the Conditional Expression, enter the following code in the text field.
string.IsNullOrEmpty(name)String.IsNullOrEmpty(name)Each time the breakpoint is hit, the debugger calls the
String.IsNullOrWhiteSpace(name)method, and it breaks on this line only if the method call returnstrue.Instead of a conditional expression, you can specify a hit count, which interrupts program execution before a statement is executed a specified number of times. Another option is to specify a filter condition, which interrupts program execution based on such attributes as a thread identifier, process name, or thread name.
Select Close to close the dialog.
Start the program with debugging by pressing F5.
In the console window, press the Enter key when prompted to enter your name.
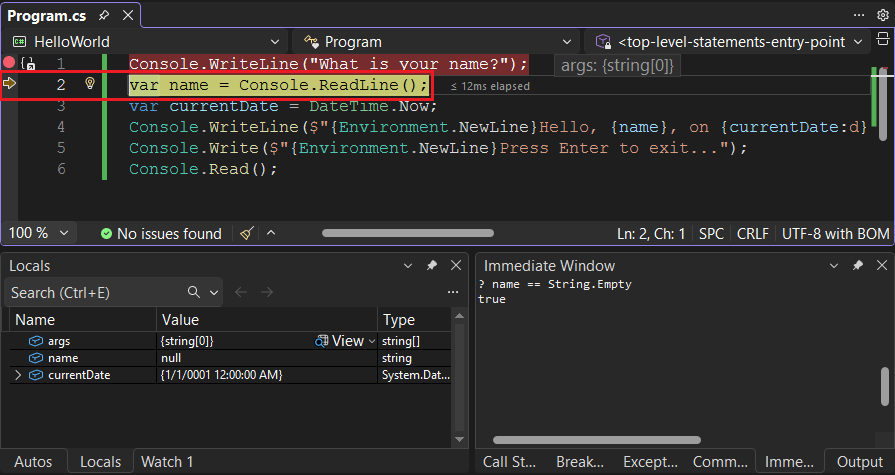
Because the condition you specified (
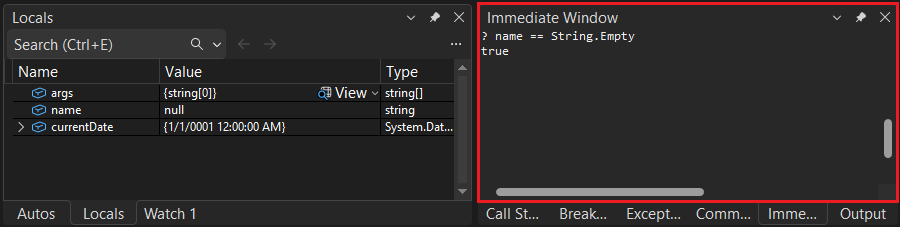
nameis eithernullor String.Empty) has been satisfied, program execution stops when it reaches the breakpoint and before theConsole.WriteLinemethod executes.Select the Locals window, which shows the values of variables that are local to the currently executing method. In this case,
Mainis the currently executing method. Observe that the value of thenamevariable is"", or String.Empty.Confirm the value is an empty string by entering the following statement in the Immediate window and pressing Enter. The result is
true.? name == String.Empty? String.IsNullOrEmpty(name)The question mark directs the immediate window to evaluate an expression.
Press F5 to continue program execution.
Press any key to close the console window and stop debugging.
Clear the breakpoint by clicking on the dot in the left margin of the code window. Other ways to clear a breakpoint are by pressing F9 or choosing Debug > Toggle Breakpoint while the line of code is selected.
Right-click (Ctrl-click on macOS) on the red dot that represents the breakpoint. In the context menu, select Edit Breakpoint to open a dialog that lets you enter a conditional expression.
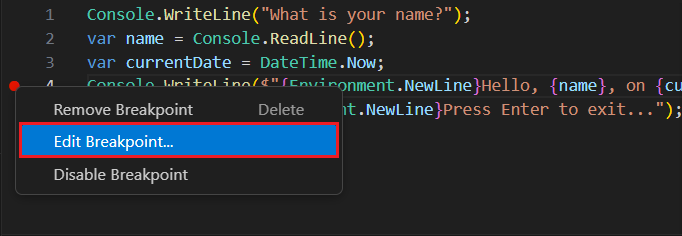
Select
Expressionin the drop-down, enter the following conditional expression, and press Enter.String.IsNullOrEmpty(name)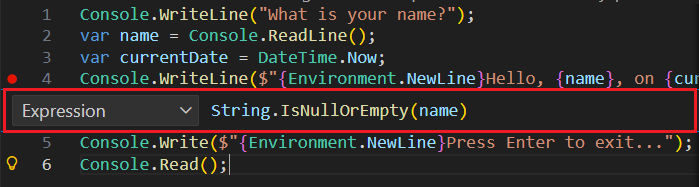
Each time the breakpoint is hit, the debugger calls the
String.IsNullOrEmpty(name)method, and it breaks on this line only if the method call returnstrue.Instead of a conditional expression, you can specify a hit count, which interrupts program execution before a statement is run a specified number of times. Another option is to specify a filter condition, which interrupts program execution based on such attributes as a thread identifier, process name, or thread name.
Start the program with debugging by pressing F5.
In the Debug Console tab, press Enter when prompted to enter your name.
Because the condition you specified (
nameis eithernullor String.Empty) has been satisfied, program execution stops when it reaches the breakpoint and before theConsole.WriteLinemethod runs.The Variables window shows that the value of the
namevariable is"", or String.Empty.Confirm the value is an empty string by entering the following statement at the Debug Console prompt and pressing Enter. The result is
true.name == String.EmptySelect the Continue button on the toolbar to continue program execution.
Press Enter to exit the program and stop debugging.
Clear the breakpoint by clicking on the dot in the left margin of the code window. Other ways to clear a breakpoint are by pressing F9 or choosing Run > Toggle Breakpoint from the menu while the line of code is selected.
If you get a warning that the breakpoint condition will be lost, select Remove Breakpoint.
Step through a program
Visual Studio also allows you to step line by line through a program and monitor its execution. Ordinarily, you'd set a breakpoint and follow program flow through a small part of your program code. Since this program is small, you can step through the entire program.
Set a breakpoint on the line of code that displays the "What is your name?" prompt.
Choose Debug > Step Into. Another way to debug one statement at a time is by pressing F11.
Visual Studio highlights and displays an arrow beside the next line of execution.
At this point, the Locals window shows that the
argsarray is empty, andnameandcurrentDatehave default values. In addition, Visual Studio has opened a blank console window.Press F11. Visual Studio highlights the statement that includes the
namevariable assignment. The Locals window shows thatnameisnull, and the console window displays the string "What is your name?".Respond to the prompt by entering a string in the console window and pressing Enter. The console is unresponsive, and the string you entered isn't displayed in the console window, but the Console.ReadLine method will nevertheless capture your input.
Press F11. Visual Studio highlights the statement that includes the
currentDatevariable assignment. The Locals window shows the value returned by the call to the Console.ReadLine method. The console window also displays the string you entered at the prompt.Press F11. The Locals window shows the value of the
currentDatevariable after the assignment from the DateTime.Now property. The console window is unchanged.Press F11. Visual Studio calls the Console.WriteLine(String, Object, Object) method. The console window displays the formatted string.
Choose Debug > Step Out. Another way to stop step-by-step execution is by pressing Shift+F11.
The console window displays a message and waits for you to press a key.
Press any key to close the console window and stop debugging.
Visual Studio Code also allows you to step line by line through a program and monitor its execution. Ordinarily, you'd set a breakpoint and follow program flow through a small part of your program code. Since this program is small, you can step through the entire program.
Set a breakpoint on the line of code that displays the "What is your name?" prompt.
Press F5 to start debugging.
Visual Studio Code highlights the breakpoint line.
At this point, the Variables window shows that the
argsarray is empty, andnameandcurrentDatehave default values.Select Step Into from the Debug toolbar or press F11.

Visual Studio Code highlights the next line.
Visual Studio Code runs the
Console.WriteLinefor the name prompt and highlights the next line of execution. The next line is theConsole.ReadLinefor thename. The Variables window is unchanged, and the Terminal tab shows the "What is your name?" prompt.Select Step Into or press F11.
Visual Studio Code highlights the
namevariable assignment. The Variables window shows thatnameis stillnull.Respond to the prompt by entering a string in the Terminal tab and pressing Enter.
The Debug Console tab might not display the string you enter while you're entering it, but the Console.ReadLine method will capture your input.
Select Step Into or press F11.
Visual Studio Code highlights the
currentDatevariable assignment. The Variables window shows the value returned by the call to the Console.ReadLine method. The Terminal tab displays the string you entered at the prompt.Select Step Into or press F11.
The Variables window shows the value of the
currentDatevariable after the assignment from the DateTime.Now property.Select Step Into or press F11.
Visual Studio Code calls the Console.WriteLine(String, Object, Object) method. The console window displays the formatted string.
Select Step Out or press Shift+F11.

The terminal displays "Press any key to exit..."
Press any key to exit the program.
Use Release build configuration
Once you've tested the Debug version of your application, you should also compile and test the Release version. The Release version incorporates compiler optimizations that can sometimes negatively affect the behavior of an application. For example, compiler optimizations that are designed to improve performance can create race conditions in multithreaded applications.
To build and test the Release version of your console application, change the build configuration on the toolbar from Debug to Release.

When you press F5 or choose Build Solution from the Build menu, Visual Studio compiles the Release version of the application. You can test it as you did the Debug version.
To build and test the Release version of your console application, open the Terminal and run the following command:
dotnet run --configuration Release
To build and test the Release version of your console application, run the following command in the terminal:
dotnet run --configuration Release HelloWorld.cs
Next steps
In this tutorial, you used debugging tools. In the next tutorial, you publish a deployable version of the app.
Samarbeid med oss på GitHub
Du finner kilden for dette innholdet på GitHub. Der du også kan opprette og se gjennom problemer og pull-forespørsler. Hvis du vil ha mer informasjon, kan du se vår bidragsyterveiledning.