More Options - Smart Store Analytics
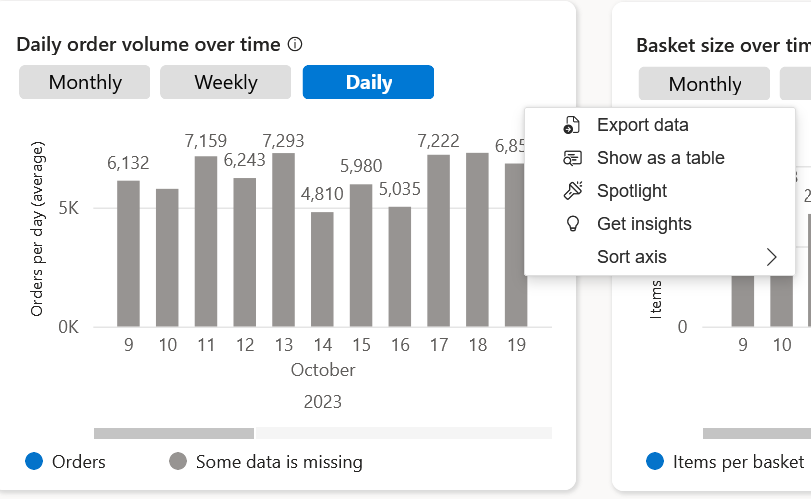
A More Options control, available for most Smart Store Analytics data widgets, enables you to export data, show data as a table, shine a spotlight on the widget, and more.
You can access the More Options control by hovering over the right-hand side of a data widget, a which point an ellipsis (“…”) should appear.
Note
The More Options feature is accessible only on data widgets where a tabular representation of data is applicable. Certain immersive visualizations, such as the store heatmap, may not support this feature.
The following options are available within the More Options control of a data widget:
Export data
With this menu, you have the ability to export data in a format that aligns with your preferences. This functionality proves valuable in scenarios where you intend to share Smart Store Analytics reports with peers, examine data through immersive visualizations in a more tabular format, and for various other purposes.
There are two options offered to export data:
Data with current layout
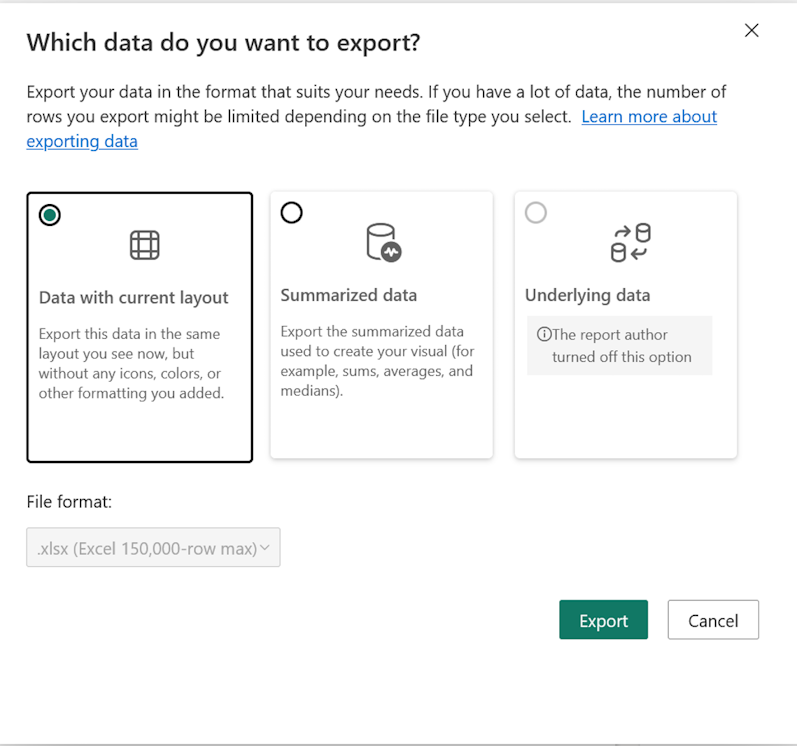
This option enables you to export data in a format mirroring the layout visible on the web page, excluding icons, colors, or custom formatting. Opt for this choice if you wish to replicate the on-screen content for offline use, with the data being downloaded as an .xls file.
Summarized data format
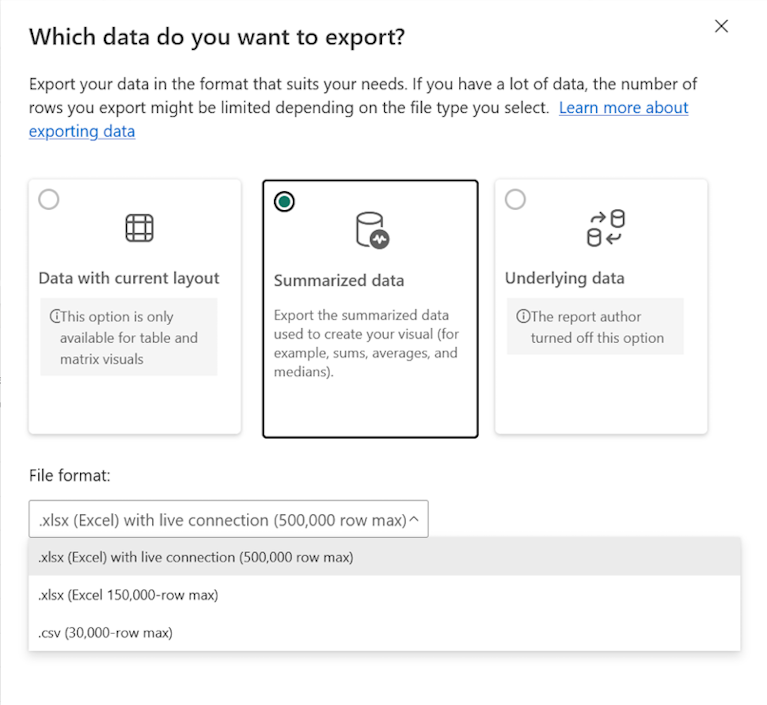
This option enables the export of summarized data utilized in generating visuals, such as sums, averages, etc. The exported data is available in both .xls and .csv formats.
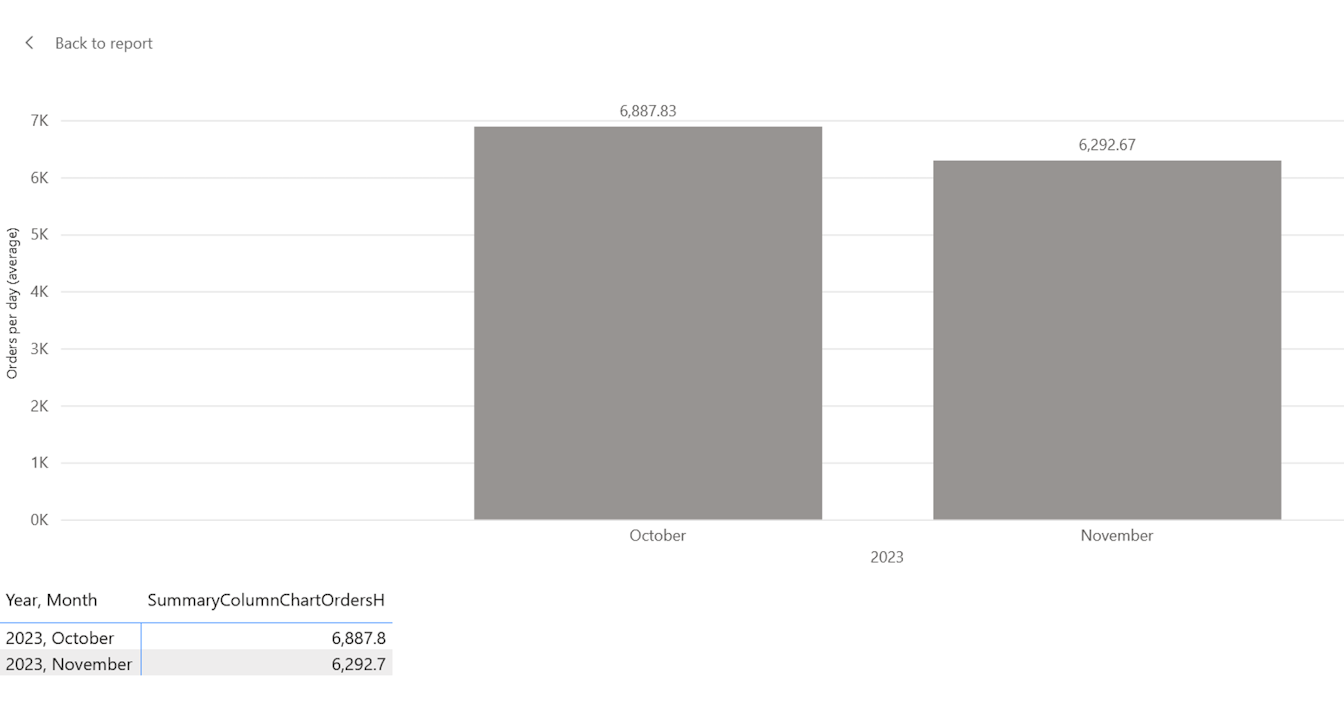
Show as a table
With this menu, you can display the underlying data in a tabular format for in-depth examination. You're directed to a separate page containing the data, with a user control to navigate back to the original report.
Spotlight
The Spotlight menu grays out the rest of the page highlighting the chosen data widget.
Get insights
The Get insights option depends on the settings in the PowerBI Admin Portal.
Sort axis
The Sort axis option allows you to choose sorting according to either x-axis (default) or y-axis for time series charts or according to a chosen column for tables.