Merk
Tilgang til denne siden krever autorisasjon. Du kan prøve å logge på eller endre kataloger.
Tilgang til denne siden krever autorisasjon. Du kan prøve å endre kataloger.
Before deploying your app to an app store, it's important to identify and fix any performance bottlenecks, excessive memory usage issues, or inefficient use of network resources. Two profiler tools are available to serve this purpose:
- Xamarin Profiler
- Android Profiler in Android Studio
This guide introduces the Xamarin Profiler and provides detailed information for getting started with using the Android Profiler.
Xamarin Profiler
The Xamarin Profiler is a standalone application that is integrated with Visual Studio and Visual Studio for Mac for profiling Xamarin apps from within the IDE. For more information about using the Xamarin Profiler, see Xamarin Profiler.
Note
You must be a Visual Studio Enterprise subscriber to unlock the Xamarin Profiler feature in either Visual Studio Enterprise on Windows or Visual Studio for Mac.
Android Studio Profiler
Android Studio 3.0 and later includes an Android Profiler tool. You can use the Android Profiler to measure the performance of a Xamarin Android app built with Visual Studio – without the need for a Visual Studio Enterprise license. However, unlike the Xamarin Profiler, the Android Profiler is not integrated with Visual Studio and can only be used to profile an Android application package (APK) that has been built in advance and imported into the Android Profiler.
Launching a Xamarin Android app in Android Profiler
The following steps explain how to launch an Xamarin Android application in Android Studio's Android Profiler tool. In the example screenshots below, a Xamarin Forms sample app is built and profiled using Android Profiler:
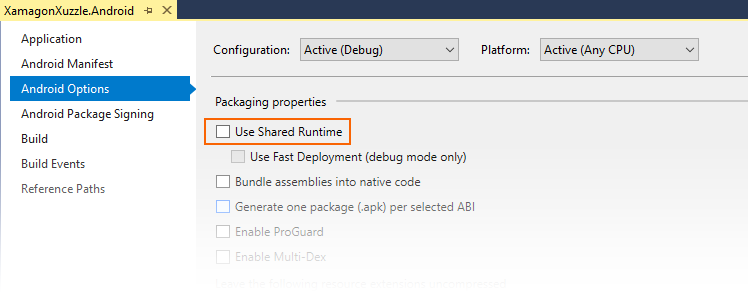
In the Android project build options, disable Use Shared Runtime. This ensures that the Android application package (APK) is built without a dependency on the shared development-time Mono runtime.
Build the app for Debug and deploy it to a physical device or emulator. This causes a signed Debug version of the APK to be built. For the XamagonXuzzle example, the resulting APK is named com.companyname.XamagonXuzzle-Signed.apk.
Open the project folder and navigate to bin/Debug. In this folder, locate the Signed.apk version of the app and copy it to a conveniently-accessible place (such as the desktop). In the following screenshot, the APK com.companyname.XamagonXuzzle-Signed.apk is located and copied to the desktop:
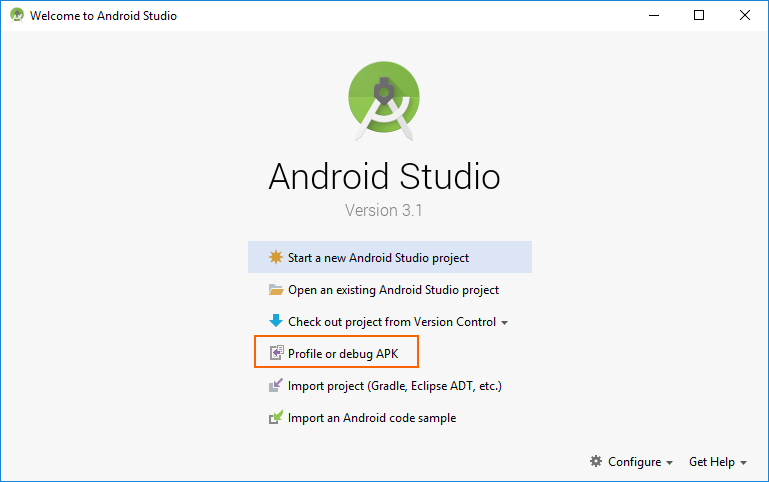
Launch Android Studio and select Profile or debug APK:
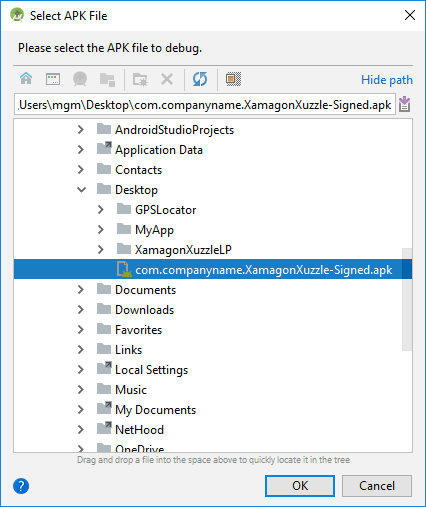
In the Select APK File dialog, navigate to the APK that you built and copied earlier. Select the APK and click OK:
Android Studio will load the APK and dissassembles classes.dex:

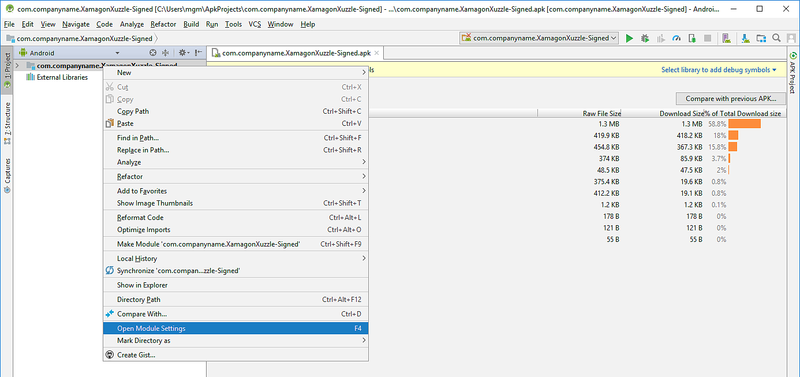
After the APK is loaded, Android Studio displays the following project screen for the APK. Right-click the app name in the tree view on the left and select Open Module Settings:
Navigate to Project Settings > Modules, select the -Signed node of the app, then click <No SDK>:
In the Module SDK pull-down menu, select the Android SDK level that was used to build the app (in this example, API level 26 was used to build XamagonXuzzle):
Click Apply and OK to save this setting.
Launch the profiler from the toolbar icon:
Select the deployment target for running/profiling the app and click OK. The deployment target can be a physical device or a virtual device running in an emulator. In this example, a Nexus 5X device is used:

After the profiler starts, it will take a few seconds for it to connect to the deployment device and the app process. While it is installing the APK, Android Profiler will report No connected devices and No debuggable processes.
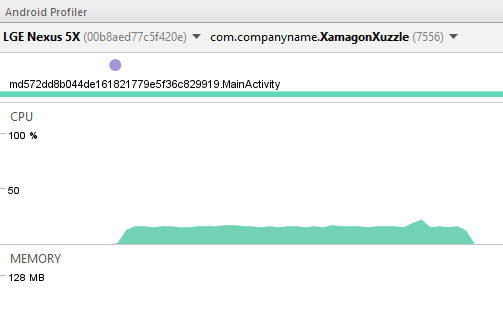
After several seconds, Android Profiler will complete APK installation and launch the APK, reporting the device name and the name of the app process being profiled (in this example, LGE Nexus 5X and com.companyname.XamagonXuzzle, respectively):
After the device and debuggable process are identified, Android Profiler begins profiling the app:
If you tap the RANDOMIZE button on XamagonXuzzle (which causes it to shift and randomize tiles), you will see the CPU usage increase during the app's randomization interval:
Using the Android Profiler
Detailed information for using the Android Profiler is included in the Android Studio documentation. The following topics will be of interest to Xamarin Android developers:
CPU Profiler – Explains how to inspect the app's CPU usage and thread activity in real-time.
Memory Profiler – Displays a real-time graph of the app's memory usage, and includes a button to record memory allocations for analysis.
Network Profiler – Displays real-time network activity of data sent and received by the app.

