Collect small slices on a paginated report pie chart (Report Builder)
Applies to:
Microsoft Report Builder (SSRS)
Power BI Report Builder
Report Designer in SQL Server Data Tools
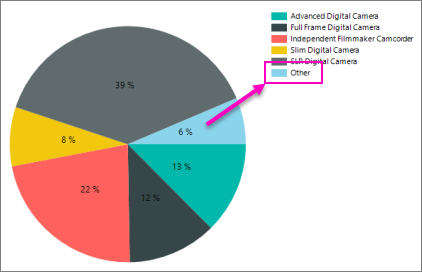
Pie charts with too many slices can look cluttered. Learn to collect many small slices in a pie chart into one single slice in paginated reports.
To collect small slices into one slice, first decide whether your threshold for collecting small slices is measured as a percentage of the pie chart or as a fixed value.
The Tutorial: Add a Pie Chart to Your Report (Report Builder) walks you through collecting small slices into a single slice, if you'd like to try this with sample data first.

You can also collect small slices into a second pie chart that is called out from a collected slice of the first pie chart. The second pie chart is drawn to the right of the original pie chart.
You cannot combine slices of funnel or pyramid charts into one slice.
To collect small slices into a single slice on a pie chart
Open the Properties pane.
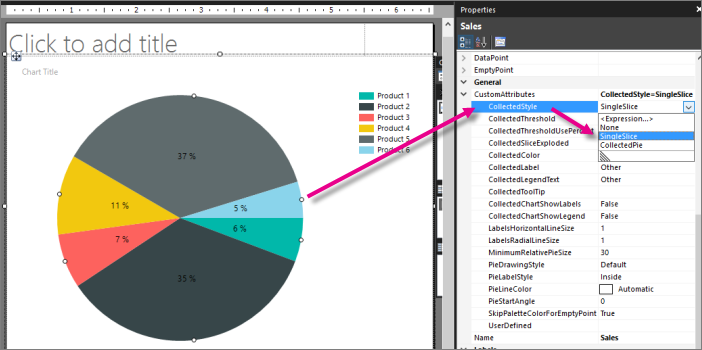
On the design surface, click on any slice of the pie chart. The properties for the series are displayed in the Properties pane.
In the General section, expand the CustomAttributes node.
Set the CollectedStyle property to SingleSlice.

Set the collected threshold value and type of threshold. The following examples are common ways of setting collected thresholds.
By percentage. For example, to collect any slice on your pie chart that is less than 10% into a single slice:
Set the CollectedThresholdUsePercent property to True.
Set the CollectedThreshold property to 10.
Note
If you set CollectedStyle to SingleSlice, CollectedThreshold to a value greater than 100, and CollectedThresholdUsePercent to True, the chart will throw an exception because it cannot calculate a percentage. To resolve this issue, set CollectedThreshold to a value less than 100.
By data value. For example, to collect any slice on your pie chart that is less than 5000 into a single slice:
Set the CollectedThresholdUsePercent property to False.
Set the CollectedThreshold property to 5000.
Set the CollectedLabel property to a string that represents the text label that will be shown on the collected slice.
(Optional) Set the CollectedSliceExploded, CollectedColor, CollectedLegendText and CollectedToolTip properties. These properties change the appearance, color, label text, legend text and tooltip aspects of the single slice.
To collect small slices into a secondary, callout pie chart
Follow Steps 1-3 from above.
Set the CollectedStyle property to CollectedPie.
Set the CollectedThresholdproperty to a value that represents the threshold at which small slices will be collected into one slice. When the CollectedStyle property is set to CollectedPie, the CollectedThresholdUsePercentproperty is always set to True, and the collected threshold is always measured in percent.
(Optional) Set the CollectedColor, CollectedLabel, CollectedLegendText and CollectedToolTip properties. All other properties named "Collected" do not apply to the collected pie.
Note
The secondary pie chart is calculated based on the small slices in your data so it will only appear in Preview. It does not appear on the design surface.
Note
You cannot format the secondary pie chart. For this reason, it is strongly recommended to use the first approach when collecting pie slices.