Merk
Tilgang til denne siden krever autorisasjon. Du kan prøve å logge på eller endre kataloger.
Tilgang til denne siden krever autorisasjon. Du kan prøve å endre kataloger.
Windows assigns each running process a unique decimal number called the process ID (PID). You use this number in many ways, such as specifying the process when attaching a debugger to it.
In this article, you'll learn how to find a process ID using:
- Task Manager - Quick visual method
- tasklist command - Command-line option
- TList utility - Advanced debugging tool
- PowerShell Get-Process - Automation-friendly
- Debugger .tlist command - For active debugging sessions
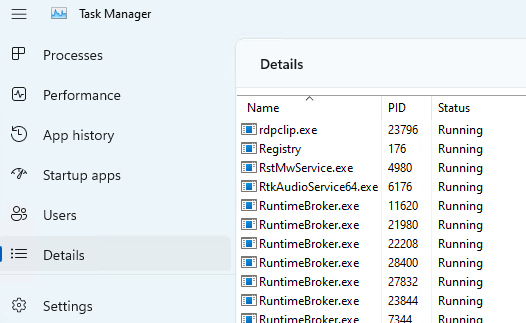
To find a PID using Task Manager**
- Open Task Manager by selecting Ctrl+Alt+Delete, then select Task Manager.
- Select More details to expand the information displayed (Windows only).
- From the Processes tab, select Details to see the process ID in the PID column.
You can select any column name to sort, or right-click a process name for more options.

Some kernel errors might cause delays in Task Manager's graphical interface.
The tasklist command
Use the built-in Windows tasklist command from a command prompt to display all processes, their PIDs, and a variety of other details.
C:\>tasklist

Image Name                     PID Session Name        Session#    Mem Usage
========================= ======== ================ =========== ============
System Idle Process              0 Services                   0          8 K
System                           4 Services                   0      7,428 K
Secure System                  104 Services                   0     40,344 K
Registry                       164 Services                   0    146,596 K
smss.exe                       592 Services                   0      1,176 K
csrss.exe                      896 Services                   0      6,224 K
wininit.exe                    980 Services                   0      6,572 K
...
Use tasklist /? to display command line help.
TList utility
Task List Viewer (TList), or tlist.exe, is a command-line utility that displays the list of tasks, or user-mode processes, currently running on the local computer. TList is included in the Debugging Tools for Windows. For information on how to download and install the debugging tools, see Debugging Tools for Windows.
If you installed the Windows Driver Kit in the default directory on a 64-bit PC, you can find the debugging tools here:
C:\Program Files (x86)\Windows Kits\10\Debuggers\x64\
When you run TList from the command prompt, it displays a list of all the user-mode processes in memory with a unique PID number. For each process, it shows the PID, process name, and, if the process has a window, the title of that window.
C:\Program Files (x86)\Windows Kits\10\Debuggers\x64>tlist -t
System Process (0)
System (4)
  smss.exe (592)
  Memory Compression (3376)
Secure System (104)
Registry (164)
csrss.exe (896)
wininit.exe (980)
  services.exe (660)
    svchost.exe (1232)
      WmiPrvSE.exe (6008)
      dllhost.exe (1748)
      WmiPrvSE.exe (1860)
...
For more information, see TList.
The .tlist debugger command
If you have a user-mode debugger already running on the system, use the .tlist (List Process IDs) command to display all PIDs.
Example:
0:000> .tlist
This method is useful when you're actively debugging and need to identify other processes without leaving the debugger.
PowerShell Get-Process command
To work with automation scripts, use the Get-Process PowerShell command. Specify a specific process name to see the process ID for that process.
C:\> Get-Process explorer

Handles  NPM(K)    PM(K)      WS(K)     CPU(s)     Id  SI ProcessName
-------  ------    -----      -----     ------     --  -- -----------
   2520     404   108948     179284   1,702.95   7656   1 explorer
For more information, see Get-Process.
Related topics
- Debugging Tools for Windows - Download tools used in this article
- TList command reference - Detailed TList utility documentation
- .tlist debugger command - Debugger command reference
- Get-Process PowerShell cmdlet - Complete PowerShell documentation
- Windows Internals - Deep dive into Windows processes and threads