What's New in DevTools (Microsoft Edge 85)
To check out the latest features of Microsoft Edge DevTools and the Microsoft Edge DevTools extension for Microsoft Visual Studio Code and Visual Studio, read these announcements.
To stay up to date and get the latest DevTools features, download an Insiders preview version of Microsoft Edge. Whether you're on Windows, Linux, or macOS, consider using Canary (or another preview channel) as your default development browser. The Beta, Dev, and Canary versions of Microsoft Edge run as separate apps, side-by-side with the stable, released version of Microsoft Edge. See Microsoft Edge Insider Channels.
For the latest announcements, follow the Microsoft Edge team on Twitter. To report a problem with DevTools or ask for a new feature, file an issue in the MicrosoftEdge/DevTools repo.
Announcements from the Microsoft Edge DevTools team
CSS grid debugging features
The Microsoft Edge DevTools team is collaborating with the Chrome DevTools team and Chromium community to add new CSS grid debugging features to DevTools. You can now display grid line numbers, grid gaps, and extended grid lines as an on-page overlay. Plus, more improvements to the grid tools are coming soon.

Update: This feature has been released and is no longer experimental.
To try out the experiment with a sample, see CSS Grid planner example.
Chromium issue #1047356
See also:
Edit and Replay requests with the Network Console
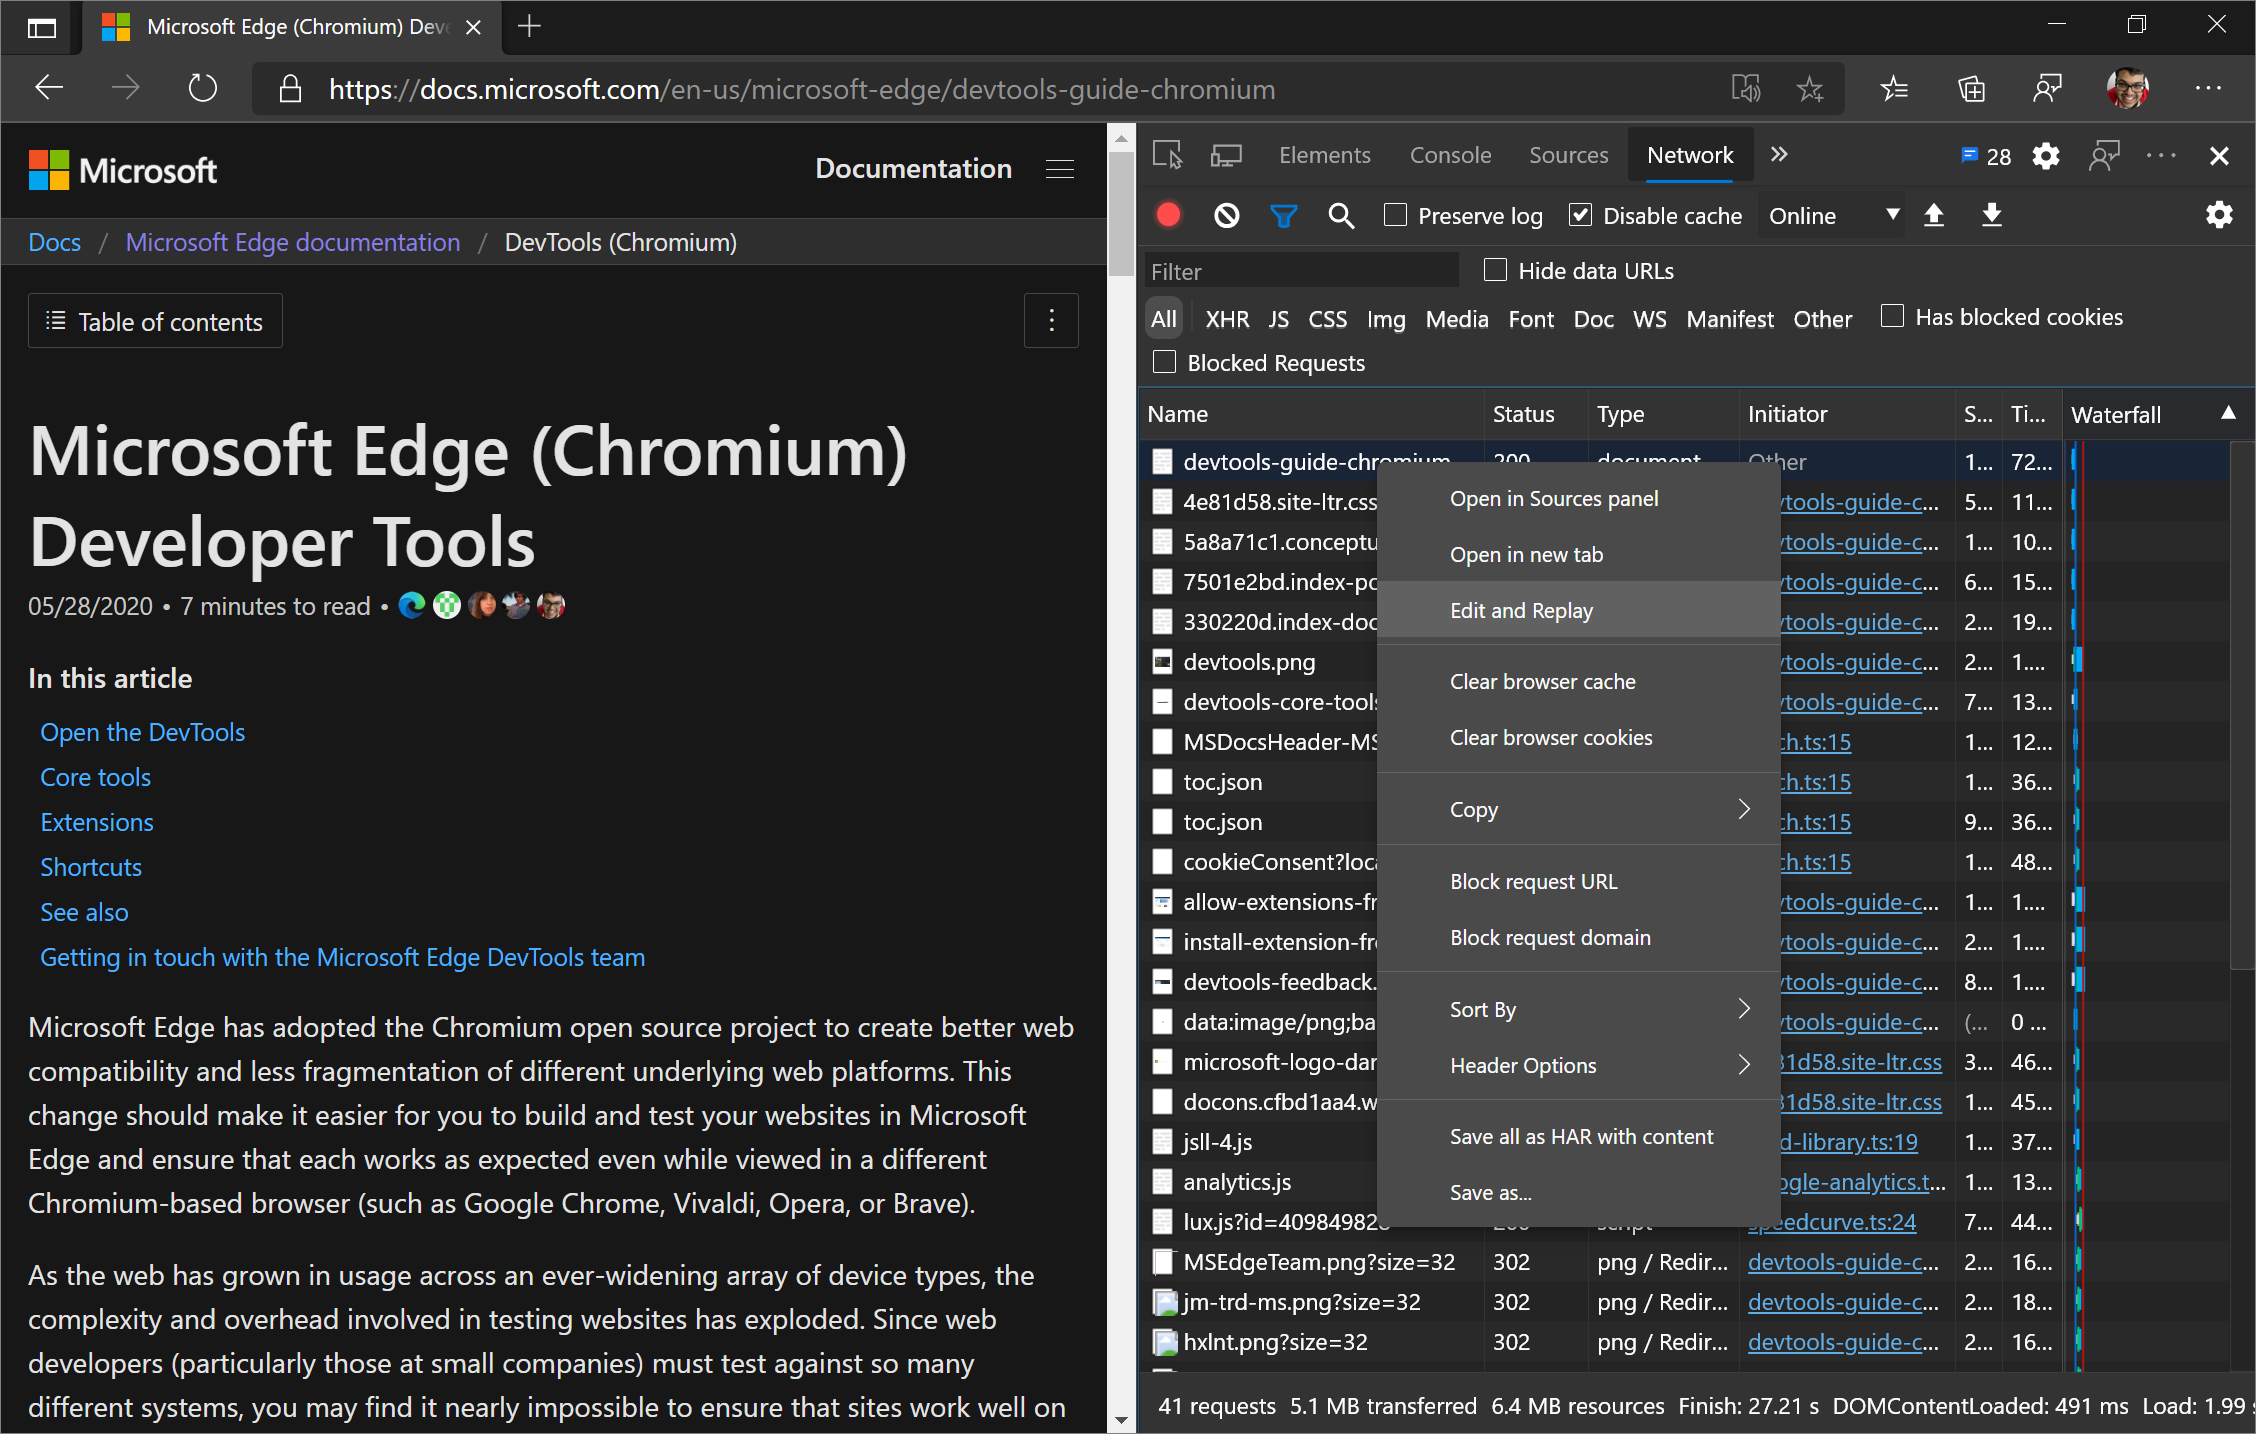
You can now use Edit and Replay on requests in the Network Log using the Network Console. Open the Network Log, right-click, and then select Edit and Replay:

The new Network Console tool opens in the Quick View panel at bottom of DevTools, and automatically populates with information for the HTTP request. To display the response that's returned from the server, edit the request (if needed) and then select Send.
You can also use the Network Console to create and send HTTP requests directly from the DevTools.

Tip: To display Network Console in the main (top) panel instead of in the Quick View panel, see Move tools between panels, below.
Update: This feature has been released and is no longer experimental.
Chromium issue #1093687
Service worker respondWith events in the Timing tab
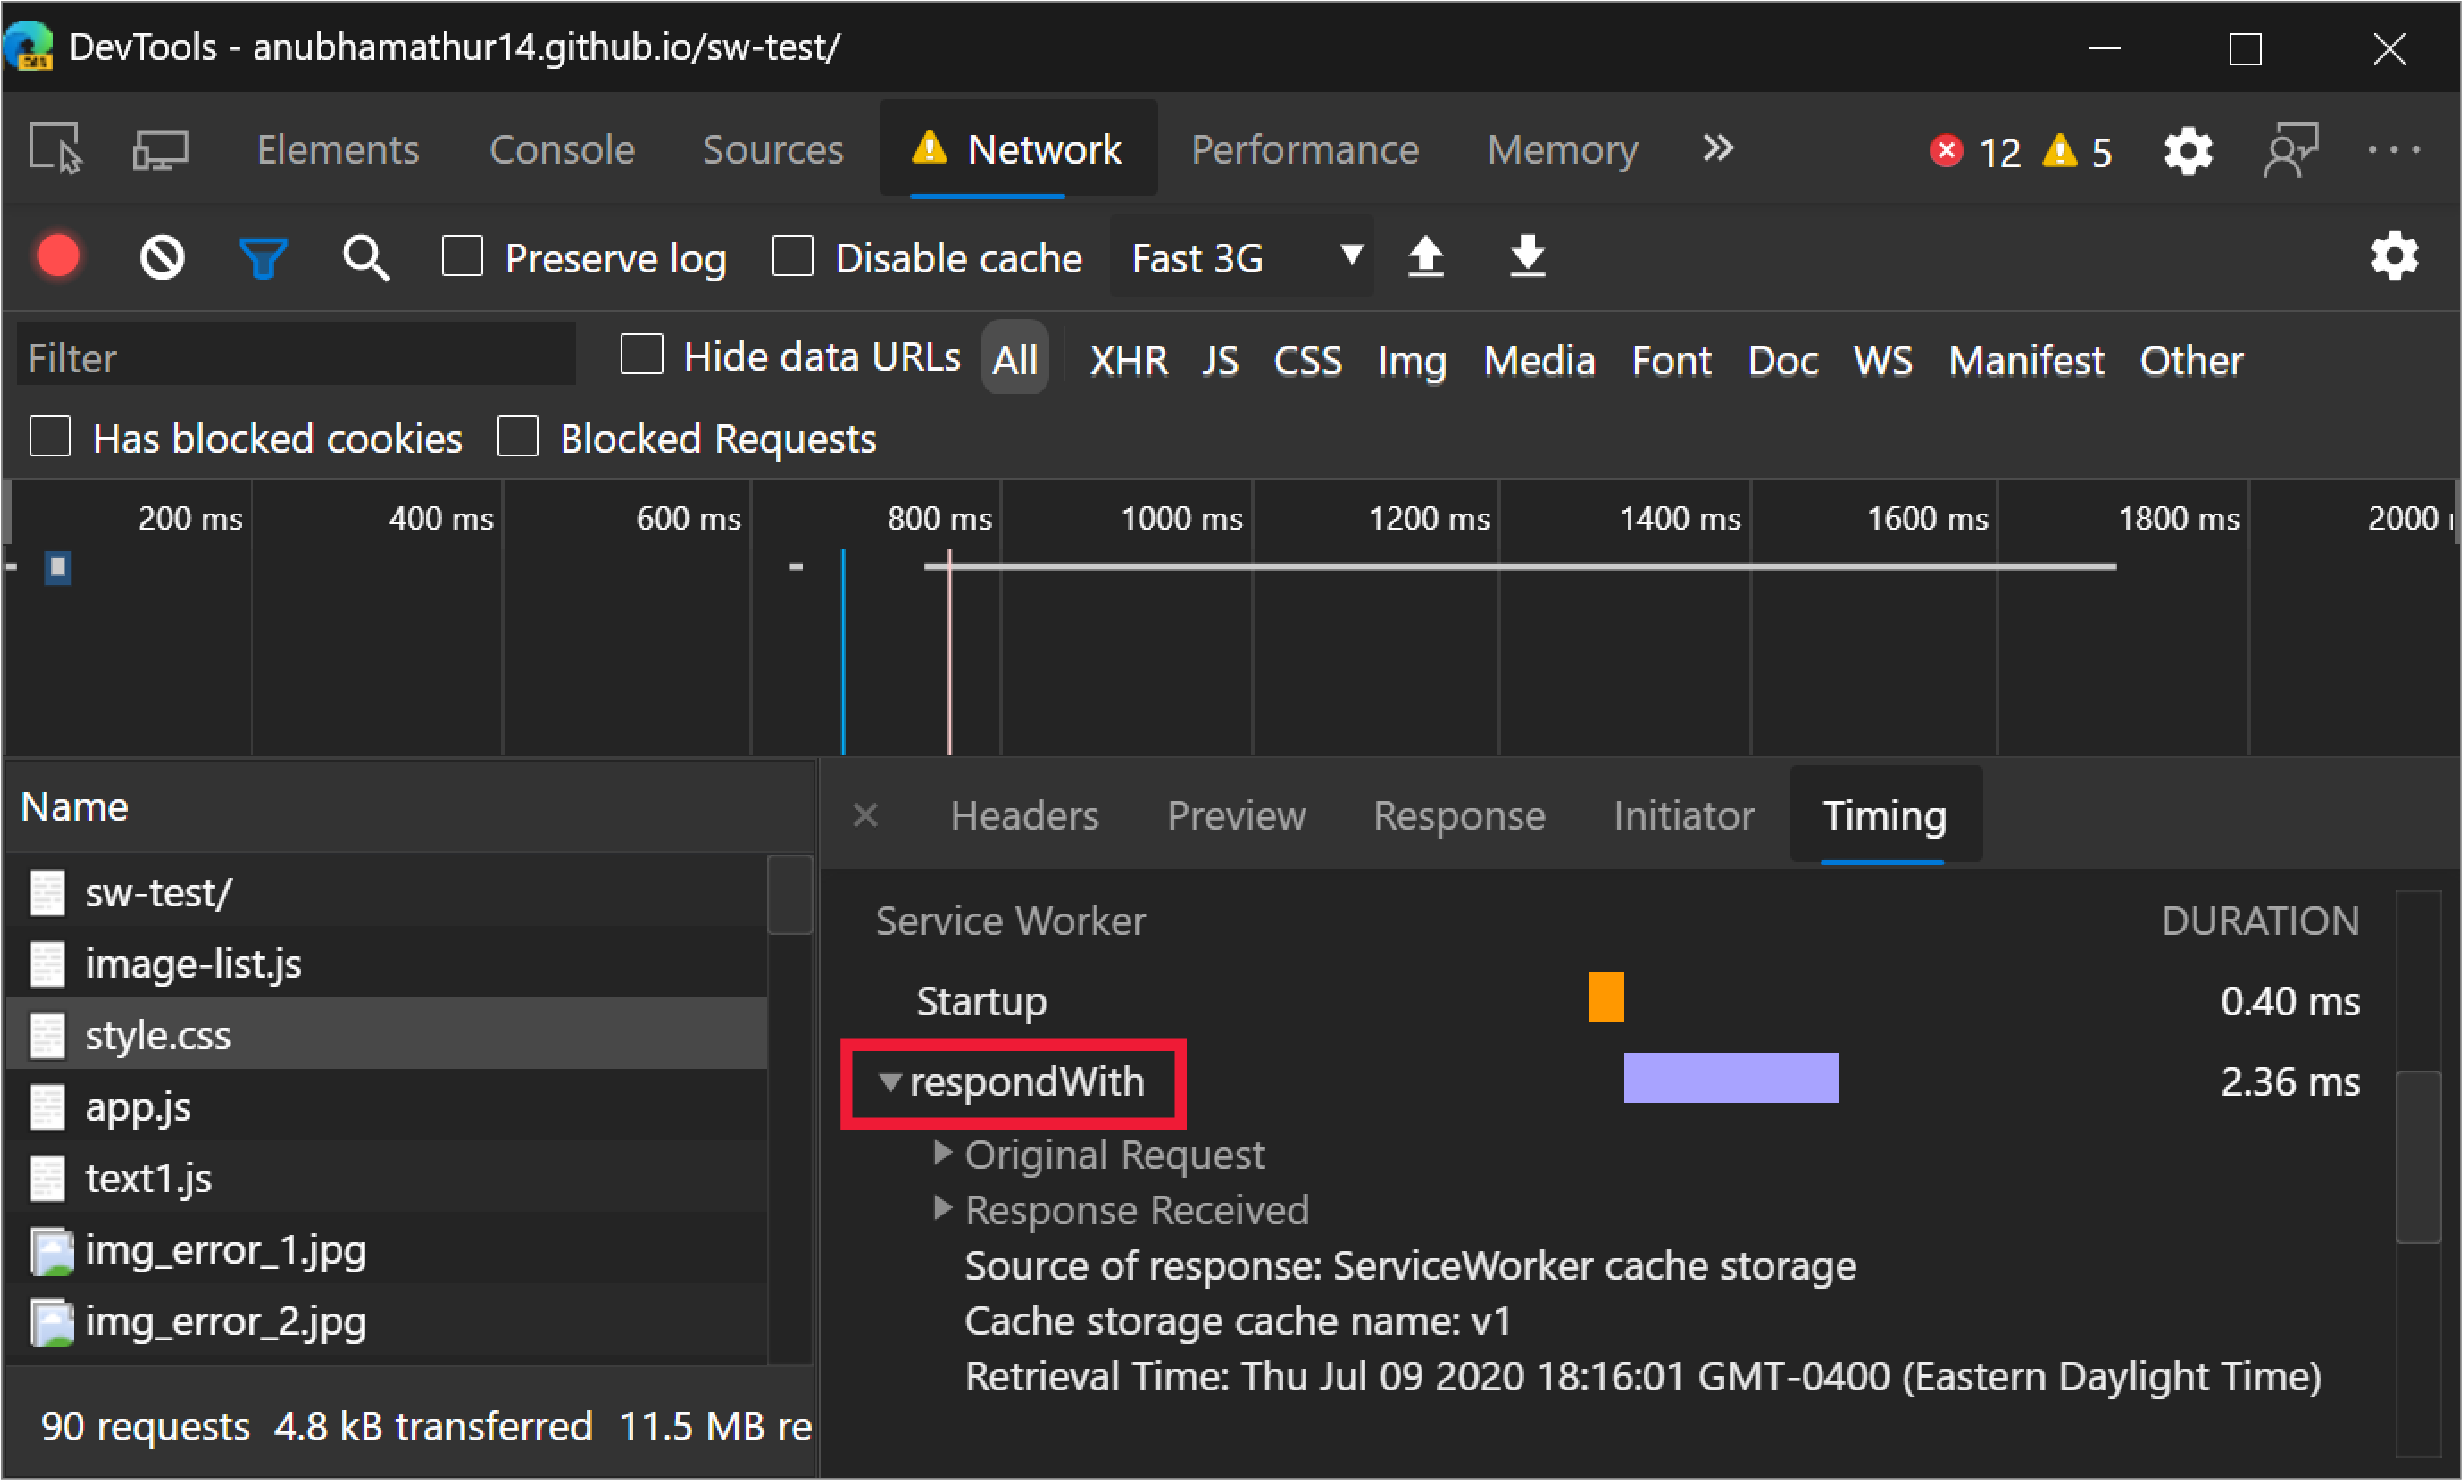
The Timing tab of the Network tool now includes respondWith service worker events. The respondWith service worker event shows the duration from the time immediately before the service worker fetch event handler starts running to the time when the respondWith promise of the fetch handler is settled.

Expand Response received to display additional information from the fetch response like CacheStorageCacheName, serviceWorkerResponseSource, and ResponseTime.

Chromium issue #1066579
See also:
- Display the timing relationship of requests in Network features reference.
- Display the timing breakdown of a request in Network features reference.
webhint feedback in the Issues panel

webhint is an open-source tool that provides real-time feedback on the accessibility, cross-browser compatibility, security, performance, PWAs, and other common web development issues of websites. You can view webhint feedback in the Issues panel.

To enable the experiment, see Turning an experiment on or off and select the checkbox next to Enable webhint. Open the Issues panel to display feedback from webhint.
Chromium issue #1070378
See also:
- webhint extension for Visual Studio Code
- Enable webhint in Experimental features in Microsoft Edge DevTools
Move tools between panels
Previously, tools such as Elements and Network could only be opened in the main (top) panel of DevTools. Similarly, tools such as 3D View and Issues could only be opened in the Drawer (now Quick View panel) at the bottom of DevTools. You can now customize your DevTools layout by moving tools between the top and bottom panels.

Update: This feature has been released and is no longer experimental.
Chromium issue #897944
See also:
- About Activity Bar and Quick View tools in Overview of DevTools.
Improved Initiator tooltip in the Network panel
In Microsoft Edge 83 and 84, tooltips for the Initiator column, which shows the cause of the resource request, in the Network Log displayed with a horizontal scrollbar. You were only able to display the call stack that initiated the request by scrolling horizontally in the tooltip.

Starting with Microsoft Edge 85, you can now display the Initiator call stack in the tooltip without scrolling horizontally.

Chromium issue #1069404
Announcements from the Chromium project
The following sections announce additional features available in Microsoft Edge 85 that were contributed to the open source Chromium project.
Style editing for CSS-in-JS frameworks
The Styles pane now has better support for editing styles that were created with the CSS Object Model (CSSOM) APIs. Many CSS-in-JS frameworks and libraries use the CSSOM APIs under the hood to construct styles.
You can now edit styles that were added in JavaScript using the CSSStyleSheet interface, which is a new way to create and distribute reusable styles when using Shadow DOM. See The CSSStyleSheet Interface in CSS Object Model (CSSOM).
For example, the h1 styles added with CSSStyleSheet (CSSOM APIs) were not editable previously. The styles are editable now in the Styles panel.

Give this feature a try with a sample that uses CSS-in-JS. See Style editing for CSS-in-JS frameworks.
Chromium issue #946975
Lighthouse 6 in the Lighthouse panel
The Lighthouse panel is now running Lighthouse 6. For a full list of all changes, see v6.0.0 release notes.
Lighthouse 6.0 introduces three new metrics to the report: Largest Contentful Paint (LCP), Cumulative Layout Shift (CLS), and Total Blocking Time (TBT).
The performance score formula has also been reweighted to better reflect the loading experience of the user.
Chromium issue #772558
See also:
First Meaningful Paint deprecation
First Meaningful Paint (FMP) is deprecated in Lighthouse 6.0. FMP has also been removed from the Performance panel. Largest Contentful Paint is the recommended replacement for FMP.
Chromium issue #1096008
See also:
Support for new JavaScript features
DevTools now has better support for some of the latest JavaScript language features:
Optional chaining syntax autocompletion. Property auto-completion in the Console now supports optional chaining syntax, for example,
name?.now works in addition toname.andname[.Syntax highlighting for private fields. Private class fields are now properly syntax-highlighted and pretty-printed in the Sources panel.
Syntax highlighting for Nullish coalescing operator. DevTools now properly pretty-prints the nullish coalescing operator in the Sources panel.
Chromium issues #1073903, #1083214, #1083797
See also:
New app shortcut warnings in the Manifest pane
In the Application tool, App shortcuts help users quickly start common or recommended tasks within a web app.
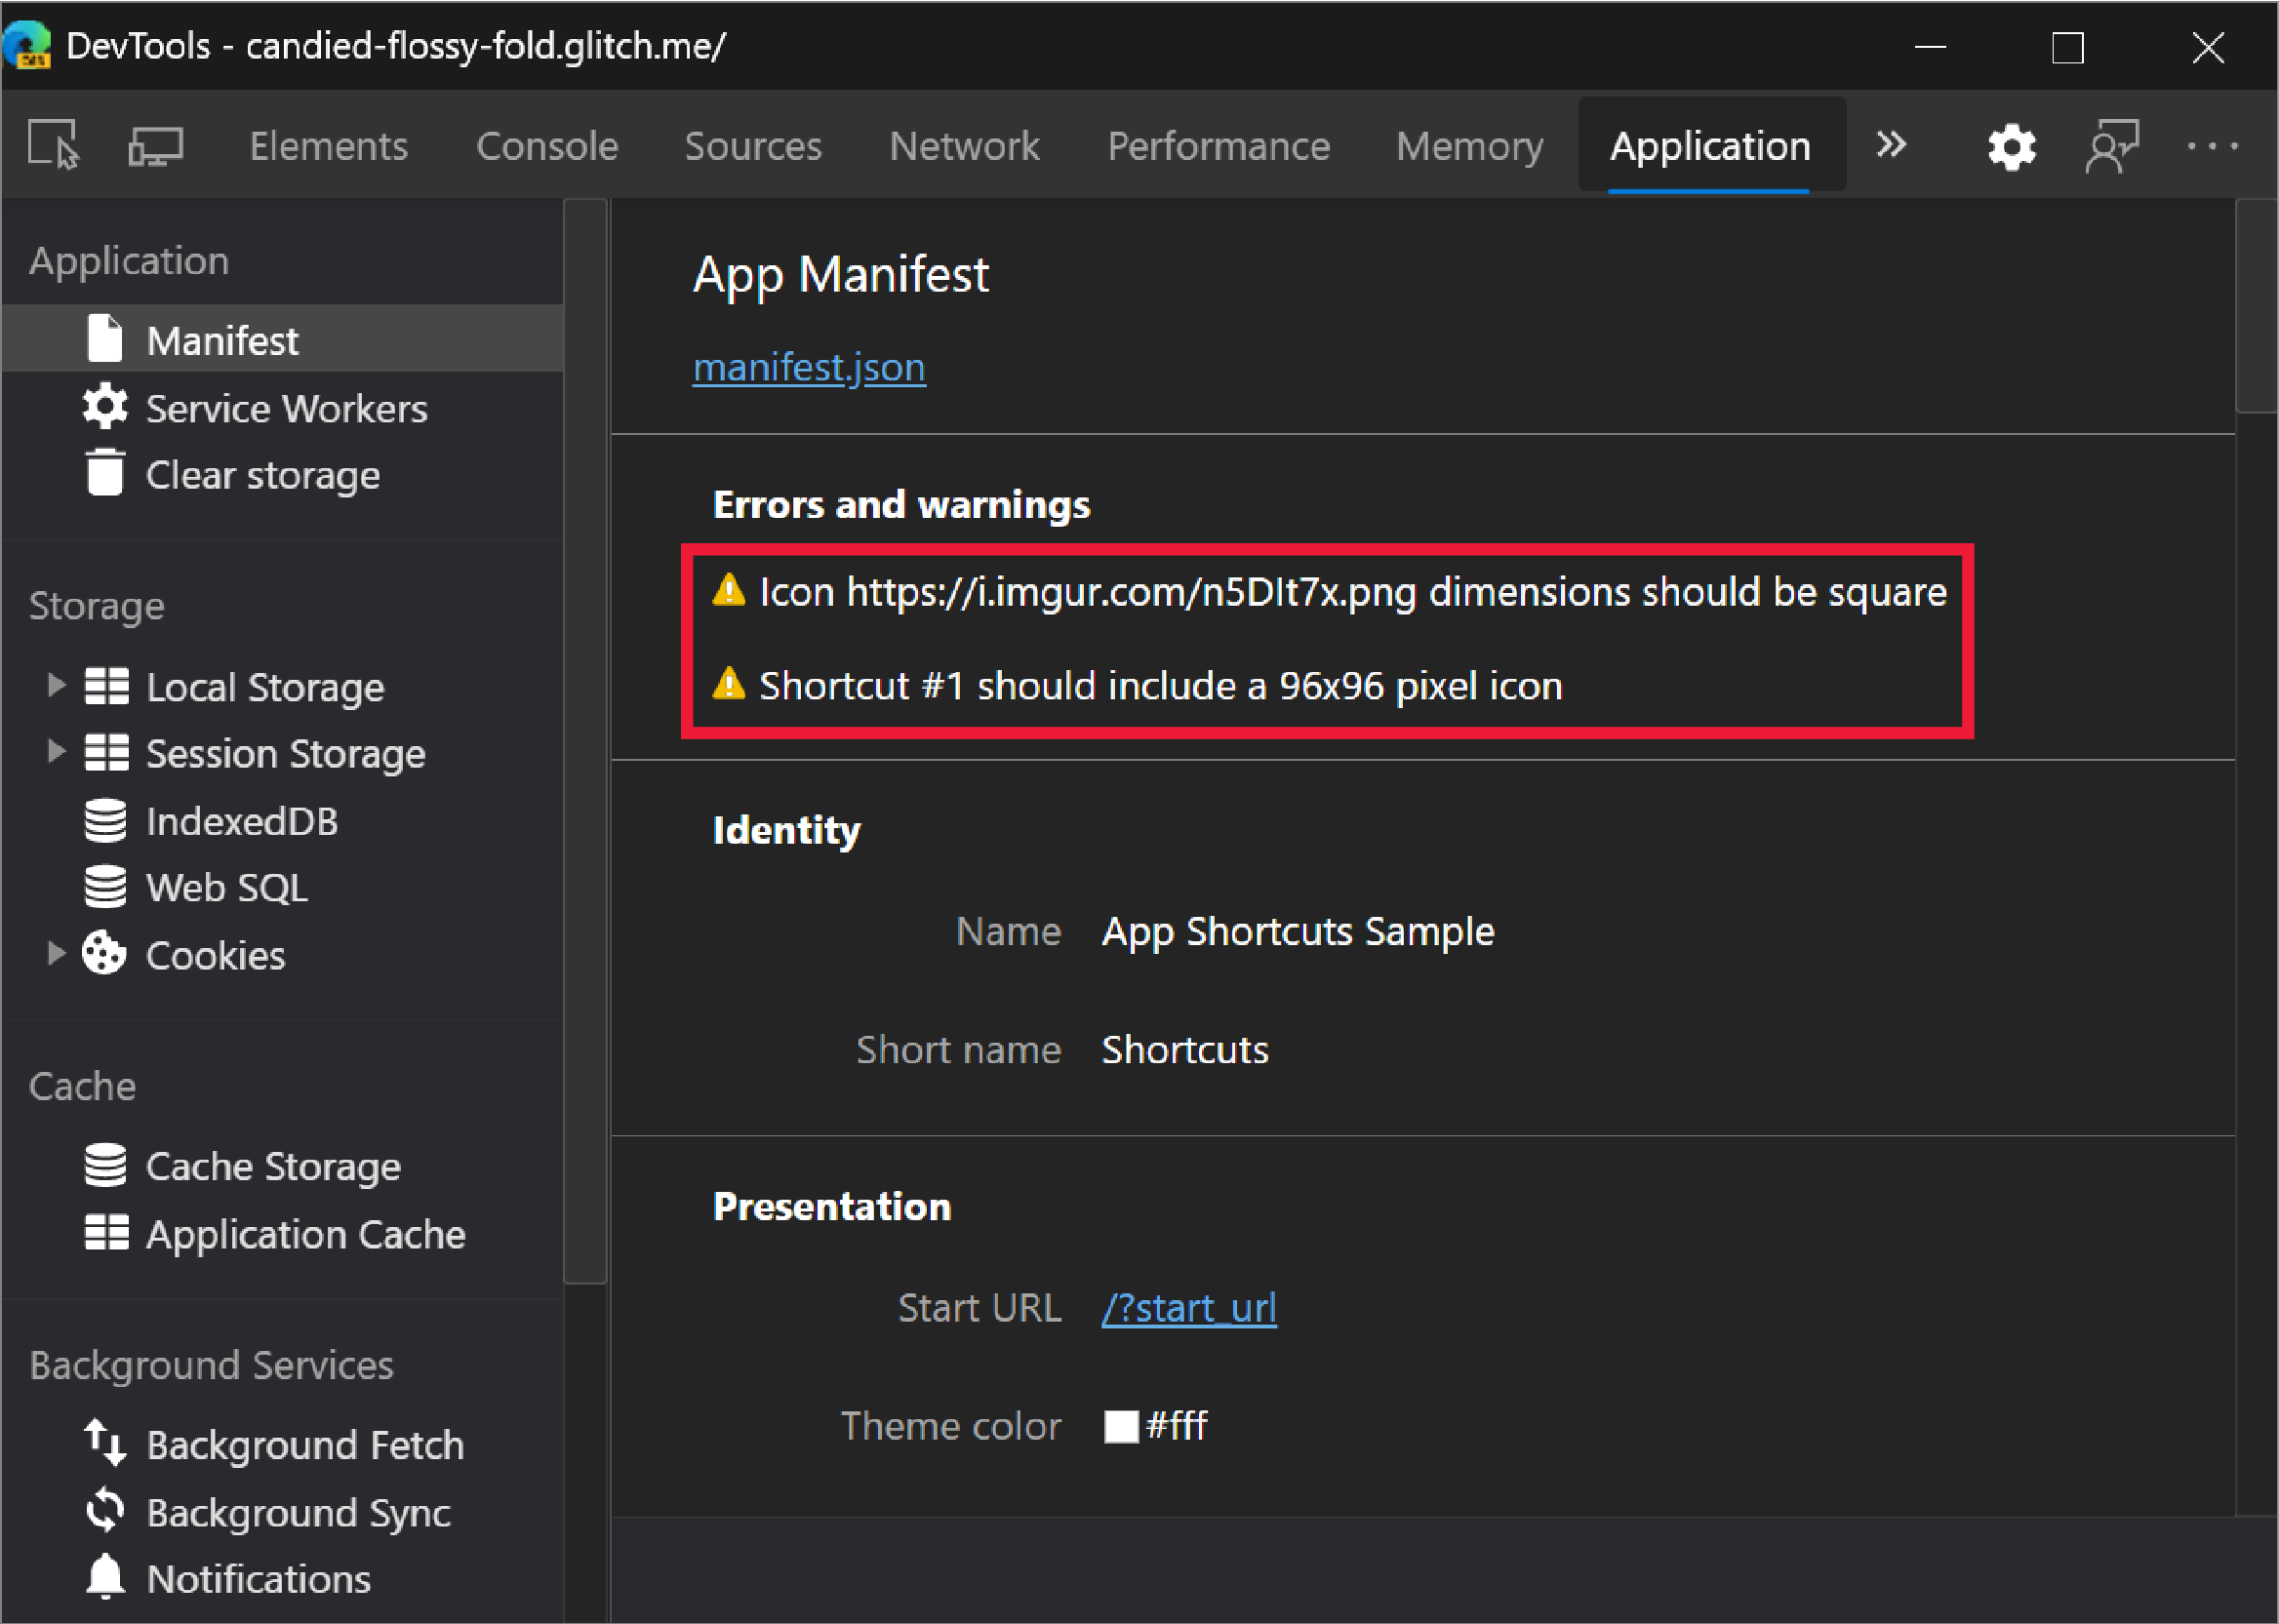
In the Application tool, the Manifest pane now shows warnings for the following conditions:
- When the app shortcut icons are smaller than 96x96 pixels.
- When the app shortcut icons and manifest icons aren't square (since the icons are ignored).

Chromium issue #955497
See also:
Consistent display of the Computed pane
The Computed pane in the Elements tool is now displayed consistently as a pane across all viewport sizes. Previously, the Computed pane merged inside of the Styles pane when DevTools was narrow.

Chromium issue #1073899
See also:
- View only the CSS that is actually applied to an element in CSS features reference
Bytecode offsets for WebAssembly files
DevTools now uses bytecode offsets for displaying line numbers of Wasm disassembly. The line numbers make it clearer that you are looking at binary data, and is more consistent with how the Wasm runtime references locations.Chromium issue #1071432
See also:
Line-wise copy and cut in Sources Panel
When performing copy or cut with no selection in the Sources panel editor, DevTools copies or cuts the current line of content.

Chromium issue #800028
Console Settings updates
Ungroup same console messages
The Group similar toggle in Console Settings now applies to duplicate messages. Previously it just applied to similar messages.
For example, previously, DevTools did not ungroup the hello messages even though Group similar is unchecked. Now, the hello messages are ungrouped.

Give this feature a try with a sample that sends duplicate messages to the Console.
Chromium issue #1082963
See also:
- Turn off message grouping in Console features reference
Persisting Selected context only settings
The Selected context only settings in Console Settings is now persisted. Previously the settings were reset every time you closed and reopened DevTools. The change makes the setting behavior consistent with other Console Settings options.

Chromium issue #1055875
See also:
- Filter out messages from different JavaScript contexts - in Console features reference
Performance panel updates
JavaScript compilation cache information in Performance tool
JavaScript compilation cache information is now always displayed in the Summary panel of the Performance tool. Previously, DevTools did not show anything related to code caching if code caching did not happen.

Chromium issue #912581
See also:
Navigation timing alignment in the Performance panel
Previously, the Performance panel showed times in the rulers based on when the recording started. The timing has now changed for recordings where the user navigates. DevTools now shows ruler times relative to the navigation, instead of when the recording started.

The times for DOMContentLoaded, First Paint, First Contentful Paint, and Largest Contentful Paint events are updated to be relative to the start of the navigation, which means the timing matches the timings reported by PerformanceObserver.
Chromium issue #974550
See also:
New icons for breakpoints, conditional breakpoints, and logpoints
Update: As of 2022, breakpoints are now indicated by a blue rectangle, instead of a red circle.
The Sources panel has new designs for breakpoints, conditional breakpoints, and logpoints. Breakpoints are represented by a red circle, just like Visual Studio Code and Visual Studio. Icons are added to differentiate conditional breakpoints and logpoints.

Chromium issue #1041830
See also:
Note
Portions of this page are modifications based on work created and shared by Google and used according to terms described in the Creative Commons Attribution 4.0 International License. The original page is found here and is authored by Jecelyn Yeen.
 This work is licensed under a Creative Commons Attribution 4.0 International License.