The launch.json file for the DevTools extension
Visual Studio Code uses a launch.json file to define debug configurations. To use the DevTools extension, a launch.json file is only needed if you want to use the debugger and your webpage requires running on a web server, not just a local file system. In most cases, the only thing you need to know about the content of the DevTools-generated launch.json file (if you choose to use it) is that you need to enter your desired URL in the "url" string in several places. Read this article if you want to use custom, advanced debug configurations.
If you want to use Visual Studio Code's UI such as F5 to start the DevTools tabs along with Debug mode, your opened folder (workspace) must contain a DevTools-generated (DevTools-compatible) launch.json file in the .vscode directory.
Details about the launch.json file format are below. You normally don't need to change anything in the file except to replace several instances of the URL string, as explained in Opening DevTools by clicking the Launch Project button in Opening DevTools and the DevTools browser.
Where the name strings appear in the UI
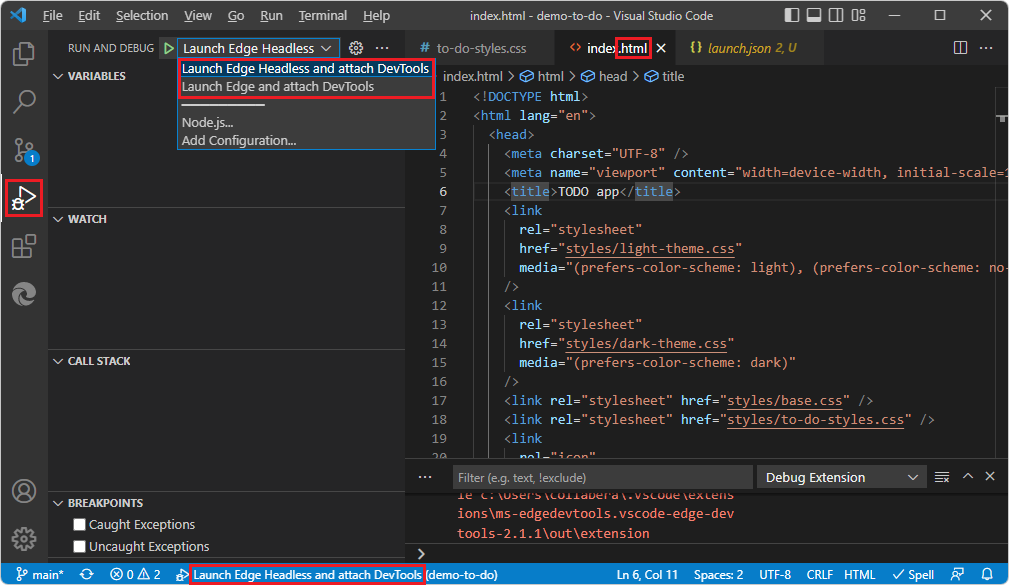
The "name" string of each debug configuration populates dropdown lists in several places.
Select File > Close Folder.
Select File > Open Recent >
C:\Users\username\Documents\GitHub\Demos\demo-to-do\index.html, cloned per Step 5: Clone the Demos repo in Installing the DevTools extension for Visual Studio Code.Suppose no
launch.jsonfile exists in the.vscodedirectory.Select Activity Bar > Microsoft Edge Tools > click the Generate launch.json button.
In Activity Bar > Explorer, double-click
index.htmlto open it.Select Activity Bar > Run and Debug > click the Run and Debug button.
In the Run and Debug Side Bar in the upper left, the strings are Launch Edge Headless and attach DevTools and Launch Edge and attach DevTools. In the bottom of the Visual Studio Code window, the string is Launch Edge Headless and attach DevTools. These are names of compound configurations in the
.jsonfile, telling the Visual Studio Code debugger to open the two DevTools tabs, or else the DevTools tab and an external browser:"compounds": [ { "name": "Launch Edge Headless and attach DevTools", "configurations": [ "Launch Microsoft Edge in headless mode", "Open Edge DevTools" ] }, { "name": "Launch Edge and attach DevTools", "configurations": [ "Launch Microsoft Edge", "Open Edge DevTools" ] } ]
In the Debug Console in the lower right, the string is Launch Microsoft Edge in headless mode. This is a string not about the Edge DevTools tab, but about the Edge DevTools: Browser tab. It's the name of an individual configuration, not of a compound configuration:
    "configurations": [
     ...
     {
         "type": "pwa-msedge",
         "name": "Launch Microsoft Edge in headless mode",
         "request": "launch",
         "runtimeArgs": [
             "--headless",
             "--remote-debugging-port=9222"
         ],
         "url": "file://c:\\Users\\collabera\\Documents\\GitHub\\Demos\\demo-to-do\\index.html",
         "presentation": {
             "hidden": true
         }
     },
In the Run and Debug Side Bar, click Start Debugging. The two DevTools tabs open, and Visual Studio Code enters Debug mode. This approach is the built-in Visual Studio Code UI for starting the debugger, rather than the DevTools UI that's described in Opening DevTools and the DevTools browser.
Where the launch.json file is placed
In Visual Studio Code's Explorer pane, the
launch.jsonfile is placed in a.vscodefolder at the root of the folder that you opened.For a repo, such as the Demos repo, if you open the entire repo folder, the Generate launch.json button creates a
\.vscode\launch.jsonfile near the root, for the entire repo directory.If you open a particular, smaller folder, such as
\Demos\demo-to-do\, the Generate launch.json button puts alaunch.jsonfile in that folder only.
Visual Studio Code uses a launch.json file to configure and customize the debugger. launch.json is a debugger configuration file. This file also controls which web browser to use in conjunction with the debugger. For example, when you test your webpage by clicking a button in the webpage to cause your JavaScript code to run, the Visual Studio Code debugger listens to the browser and steps through the JavaScript code of the webpage.
The following is a copy of the launch.json after clicking the Create launch.json button in the extension.
There are three configurations and two compounds initially defined by default:
configurations- in the Visual Studio Code UI, these configuration names appear in Debugger UI:Launch Microsoft Edge - this is a "launch"-type configuration.
Launch Microsoft Edge in headless mode - this is a "launch"-type configuration.
Open Edge DevTools - this is a "debug"-type (or "attach"-type) configuration.
compounds- in the Visual Studio Code UI, these appear in the Debug toolbar:Launch Edge Headless and attach DevTools
Launch Edge and attach DevTools
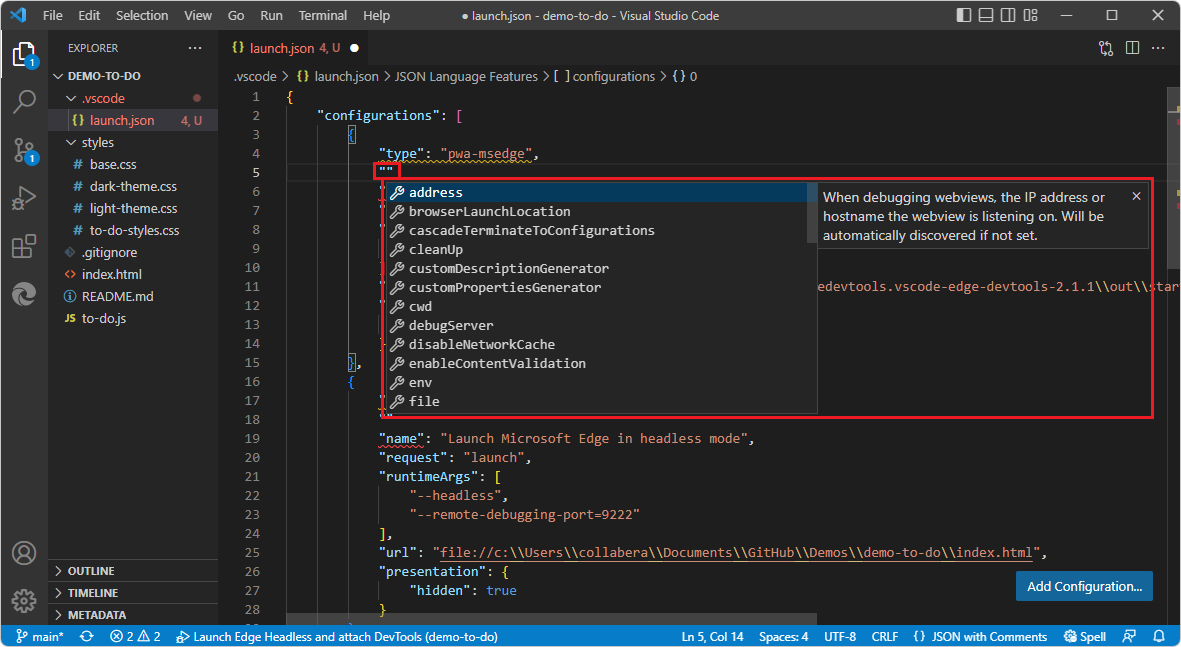
Intellisense and autocomplete
Hover over a JSON name or value to show a tooltip:

Start typing double-quotes, to see the autocompletion list of available JSON properties and descriptions:

When saving the file, be sure to provide well-formed JSON, including commas.
Configuration types: launch vs. debug
These two distinct types of configurations are both defined in this .json file for the Visual Studio Code debugger.
Configurations
The following sections of launch.json file are from v2.1.1 of the extension, in a default installation location for Visual Studio Code on Windows.
Configuration 1: Launch Microsoft Edge
This is a "launch browser"-type configuration. This configuration controls the browser component, such as which .html file to display, when headless is not selected in the UI.
This configuration name doesn't appear directly in the UI. This configuration is used by a compound configuration, below.
        {
            "type": "pwa-msedge",
            "name": "Launch Microsoft Edge",
            "request": "launch",
            "runtimeArgs": [
                "--remote-debugging-port=9222"
            ],
            "url": "c:\\Users\\username\\.vscode\\extensions\\ms-edgedevtools.vscode-edge-devtools-2.1.1\\out\\startpage\\index.html", // Provide your project's url to finish configuring
            "presentation": {
                "hidden": true
            }
        },
Configuration 2: Launch Microsoft Edge in headless mode
This is a "launch browser"-type configuration. This configuration controls the browser component, such as which .html file to display, when Headless is selected in the the Edge DevTools > Settings page, as it is by default.
This configuration name Launch Microsoft Edge in headless mode appears in the UI, such as in the Debug toolbar and in the Debug Console. If you launch multiple instances, a number is appended to the additional instances in the UI, such as Launch Microsoft Edge in headless mode 2. This configuration is used by a compound configuration, below.
        {
            "type": "pwa-msedge",
            "name": "Launch Microsoft Edge in headless mode",
            "request": "launch",
            "runtimeArgs": [
                "--headless",
                "--remote-debugging-port=9222"
            ],
            "url": "c:\\Users\\username\\.vscode\\extensions\\ms-edgedevtools.vscode-edge-devtools-2.1.1\\out\\startpage\\index.html", // Provide your project's url to finish configuring
            "presentation": {
                "hidden": true
            }
        },
Configuration 3: Open Edge DevTools
This is a "attach debugger"-type configuration. This configuration controls the Edge DevTools tab (pane), such as which .html file populates the Elements tool.
This configuration name doesn't appear directly in the UI. This configuration is used by a compound configuration, below.
        {
            "type": "vscode-edge-devtools.debug",
            "name": "Open Edge DevTools",
            "request": "attach",
            "url": "c:\\Users\\username\\.vscode\\extensions\\ms-edgedevtools.vscode-edge-devtools-2.1.1\\out\\startpage\\index.html", // Provide your project's url to finish configuring
            "presentation": {
                "hidden": true
            }
        }
Compound configurations
The compounds section of launch.json defines compound configurations.
Each compound configuration refers to two configurations: one configuration to open the Edge DevTools tab in Visual Studio Code, and the other configuration to open either the Edge DevTools: Browser tab (sometimes called the screencast or headless browser), or both the Edge DevTools: Browser tab and the entire Microsoft Edge browser window.
In the Microsoft Edge Tools pane, in the Targets section, on the right side of a target, click the Toggle screencast button. The headless embedded Edge DevTools: Browser tab (pane) closes or opens.
In the Microsoft Edge Tools pane, in the Targets section, on the right side of a target, click the Attach and open Microsoft Edge Tools button.
Compound configuration 1: Launch Edge Headless and attach DevTools
This compound configuration launches the following components:
The Edge DevTools: Browser tab (pane) in Visual Studio Code. This is defined by the configuration that has the
name"Launch Microsoft Edge in headless mode", above.The Edge DevTools tab (pane) in Visual Studio Code. This is defined by the configuration that has the
name"Open Edge DevTools", above.
        {
            "name": "Launch Edge Headless and attach DevTools",
            "configurations": [
                "Launch Microsoft Edge in headless mode",
                "Open Edge DevTools"
            ]
        },
The name of this compound configuration, Launch Edge Headless and attach DevTools, appears in the Debug toolbar of Visual Studio Code.
Compound configuration 2: Launch Edge and attach DevTools
This compound configuration launches the following components:
The Edge DevTools: Browser tab (pane) in Visual Studio Code. This is defined by the configuration that has the
name"Launch Microsoft Edge", above.The Microsoft Edge browser window. This is defined by the configuration that has the
name"Launch Microsoft Edge", above.The Edge DevTools tab (pane) in Visual Studio Code. This is defined by the configuration that has the
name"Open Edge DevTools", above.
        {
            "name": "Launch Edge and attach DevTools",
            "configurations": [
                "Launch Microsoft Edge",
                "Open Edge DevTools"
            ]
        }
The name of this compound configuration, Launch Edge and attach DevTools, appears in the UI in the Debug toolbar of Visual Studio Code.
Adding configurations
You can define your own, additional debugging configurations. Click the Add configuration button.
See also
- Opening DevTools and the DevTools browser.
- Get started using the DevTools extension for Visual Studio Code
- Microsoft Edge DevTools extension for Visual Studio Code
launch.json for other platforms
- Configure C/C++ debugging in the Visual Studio Code docs.
- Configure the debugger in Using React in Visual Studio Code in the Visual Studio Code docs.