Debug UWP apps on remote machines from Visual Studio
You can use Visual Studio to run, debug, profile, and test a Universal Windows Platform (UWP) app on another computer or device. Running the UWP app on a remote machine is especially helpful when the Visual Studio computer does not support UWP-specific functionality like touch, geo-location, or physical orientation.
Prerequisites
To debug a UWP app on a remote device from Visual Studio:
- The Visual Studio project must be configured for remote debugging.
- The remote machine and the Visual Studio computer must be connected over a network, or connected directly through a USB or Ethernet cable. Debugging over the internet is not supported.
- You must turn on developer mode on both the Visual Studio computer and the remote machine.
- Remote computers must be running the Remote Tools for Visual Studio.
- Some Windows 10 and later versions start and run the remote tools automatically. Otherwise, install and run the Remote Tools for Visual Studio.
- Windows Mobile 10 devices don't require or support the remote tools.
Configure a Visual Studio project for remote debugging
You use the project Properties to specify the remote device to connect to. The settings differ depending on the programming language.
Caution
By default, the property page sets Universal (Unencrypted Protocol) as the Authentication Type for Windows 10 and later remote connections. You may need to set No Authentication to connect to the remote debugger. Universal (Unencrypted Protocol) and No Authentication protocols have no network security, so data passed between the development and remote machines is vulnerable. Choose these authentication types only for trusted networks that you are sure are not at risk from malicious or hostile traffic.
If you choose Windows Authentication for the Authentication Type, you will need to sign in to the remote machine when debugging. The remote debugger must also be running under Windows Authentication mode, with the same user account as on the Visual Studio machine.
Configure a C# or Visual Basic project for remote debugging
Select the C# or Visual Basic project in Visual Studio Solution Explorer and select the Properties icon, press Alt+Enter, or right-click and choose Properties.
Select the Debug tab.
Under Target device, select Remote Machine for a remote computer, or Device for a direct-connected Windows Mobile 10 device.
For a remote machine, enter the network name or IP address in the Remote machine field, or select Find to search for the device in the Remote Connections dialog box.

Configure a C++ project for remote debugging
Select the C++ project in Visual Studio Solution Explorer and select the Properties icon, press Alt+Enter, or right-click and choose Properties.
Select the Debugging tab.
Under Debugger to launch, select Remote Machine for a remote computer, or Device for a direct-connected Windows Mobile 10 device.
For a remote machine, enter or select the network name or IP address in the Machine Name field, or drop down and select Locate to search for the device in the Remote Connections dialog box.

Use the Remote Connections dialog box
In the Remote Connections dialog box, you can search for a specific remote computer name or IP address, or auto-detect connections by selecting the rounded-arrow refresh icon. The dialog searches only devices on the local subnet that are currently running the remote debugger. Not all devices can be detected in the Remote Connections dialog box.

Tip
If you can't connect to a remote device by name, try using its IP address. To determine the IP address, on the remote device, enter ipconfig in a command window. The IP address appears as IPv4 Address.
Download and install the Remote Tools for Visual Studio
For Visual Studio to debug apps on a remote computer, the remote computer must be running the Remote Tools for Visual Studio.
- Windows Mobile 10 devices do not require or support the remote tools.
- Windows 11 PCs, and Windows 10 PCs running Creator's Update (version 1703) and later, Windows 10 Xbox, IoT, and HoloLens devices install the remote tools automatically when you deploy the app.
- On pre-Creator's Update Windows 10 PCs, you must manually download, install, and be running the remote tools on the remote computer before you start debugging.
To download and install the remote tools:
On the remote device or server that you want to debug on, rather than the Visual Studio machine, download and install the correct version of the remote tools from the links in the following table.
- Download the most recent update of the remote tools for your version of Visual Studio. Earlier remote tools versions aren't compatible with later Visual Studio versions. (For example, if you're using Visual Studio 2019, download the latest update of the remote tools for Visual Studio 2019. In this scenario, don't download the remote tools for Visual Studio 2022.)
- Download the remote tools with the same architecture as the machine you're installing them on. For example, if you want to debug x86 applications on a remote computer running an x64 operating system, install the x64 remote tools. To debug x86, ARM, or x64 applications on an ARM64 operating system, install the ARM64 remote tools.
| Version | Link | Notes |
|---|---|---|
| Visual Studio 2022 | Remote tools | Compatible with all Visual Studio 2022 versions. Download the version matching your device operating system (x86, x64 (AMD64), or ARM64). On older versions of Windows Server, see Unblock the file download for help with downloading the remote tools. |
| Visual Studio 2019 | Remote tools | Remote tools for Visual Studio 2019 are available from My.VisualStudio.com. If prompted, join the free Visual Studio Dev Essentials program, or sign in with your Visual Studio subscription ID. Download the version matching your device operating system (x86, x64 (AMD64), or ARM64). On older versions of Windows Server, see Unblock the file download for help with downloading the remote tools. |
| Visual Studio 2017 | Remote tools | Remote tools for Visual Studio 2017 are available from My.VisualStudio.com. If prompted, join the free Visual Studio Dev Essentials program, or sign in with your Visual Studio subscription ID. Download the version matching your device operating system (x86, x64 (AMD64), or ARM64). On Windows Server, see Unblock the file download for help with downloading the remote tools. |
| Visual Studio 2015 | Remote tools | Remote tools for Visual Studio 2015 are available from My.VisualStudio.com. If prompted, join the free Visual Studio Dev Essentials program, or sign in with your Visual Studio subscription ID. On Windows Server, see Unblock the file download for help with downloading the remote tools. |
| Visual Studio 2013 | Remote tools | Download page in Visual Studio 2013 documentation |
| Visual Studio 2012 | Remote tools | Download page in Visual Studio 2012 documentation |
| Version | Link | Notes |
|---|---|---|
| Visual Studio 2019 | Remote tools | Compatible with all Visual Studio 2019 versions. Download the version matching your device operating system (x86, x64 (AMD64), or ARM64). On Windows Server, see Unblock the file download for help with downloading the remote tools. For the most recent version of the remote tools, open the Visual Studio 2022 doc. |
| Visual Studio 2017 | Remote tools | Compatible with all Visual Studio 2017 versions. Download the version matching your device operating system (x86, x64 (AMD64), or ARM64). On Windows Server, see Unblock the file download for help with downloading the remote tools. |
| Visual Studio 2015 | Remote tools | Remote tools for Visual Studio 2015 are available from My.VisualStudio.com. If prompted, join the free Visual Studio Dev Essentials program, or sign in with your Visual Studio subscription ID. On Windows Server, see Unblock the file download for help with downloading the remote tools. |
| Visual Studio 2013 | Remote tools | Download page in Visual Studio 2013 documentation |
| Visual Studio 2012 | Remote tools | Download page in Visual Studio 2012 documentation |
You can run the remote debugger by copying msvsmon.exe to the remote computer, rather than installing the remote tools. However, the Remote Debugger Configuration Wizard (rdbgwiz.exe) is available only when you install the remote tools. You may need to use the wizard for configuration if you want to run the remote debugger as a service. For more information, see (Optional) Configure the remote debugger as a service.
Note
- To debug Windows 10 or later apps on ARM devices, use ARM64, which is available with the latest version of the remote tools.
- To debug Windows 10 apps on Windows RT devices, use ARM, which is available only in the Visual Studio 2015 remote tools download.
- To debug x64 apps on an ARM64 operating system, run the x64 msvsmon.exe that is installed with the ARM64 remote tools.
Configure the remote tools
On the remote computer, find and start the Remote Debugger from the Start menu.
If you don't have administrative permissions on the remote computer, right-click the Remote Debugger app and select Run as administrator. Otherwise, just start it normally.
If you are planning to attach to a process which is running as an administrator, or is running under a different user account (such as IIS), right-click the Remote Debugger app and select Run as administrator. For more information, see Run the remote debugger as an administrator.
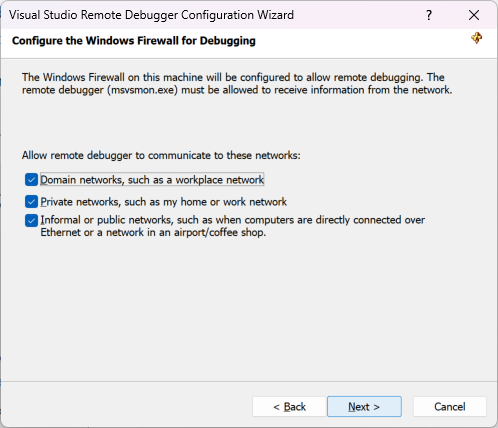
The first time you start the remote debugger (or before you have configured it), the Remote Debugging Configuration wizard appears.
In most scenarios, choose Next until you get to the Configure the Windows Firewall page of the wizard.


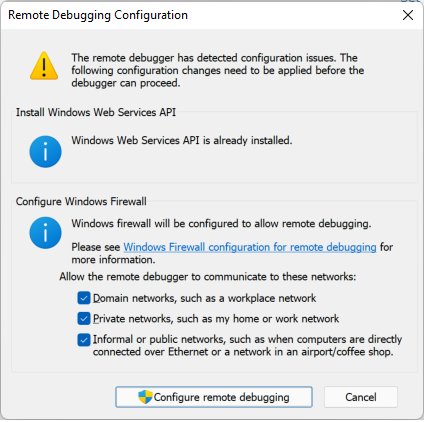
If the Windows Web Services API is not installed, which happens only on Windows Server 2008 R2, select the Install button.
Select at least one network type you want to use the remote tools on. If the computers are connected through a domain, you must choose the first item. If the computers are connected through a workgroup or homegroup, choose the second or third item as appropriate.
Next, select Finish to start the remote debugger.
Next, select Configure remote debugging to start the remote debugger.
When configuration is complete, the Remote Debugger window appears.


The remote debugger is now waiting for a connection. Use the server name and port number shown to set the remote connection configuration in Visual Studio.
To stop the remote debugger, select File > Exit. You can restart it from the Start menu, or from the command line:
<Remote debugger installation directory>\msvsmon.exe
Debug UWP apps remotely
Remote debugging works the same as local debugging.
On pre-Creator's Update versions of Windows 10, make sure the Remote Debugging Monitor (msvsmon.exe) is running on the remote device.
On the Visual Studio computer, make sure the correct debugging target (Remote Machine or Device) appears next to the green arrow on the toolbar.
Start debugging by selecting Debug > Start Debugging, pressing F5, or selecting the green arrow on the toolbar.
The project recompiles, then deploys and starts on the remote device. The debugger suspends execution at breakpoints, and you can step into, over, and out of code.
If necessary, select Debug > Stop Debugging or press Shift+F5 to stop debugging and close the remote app.