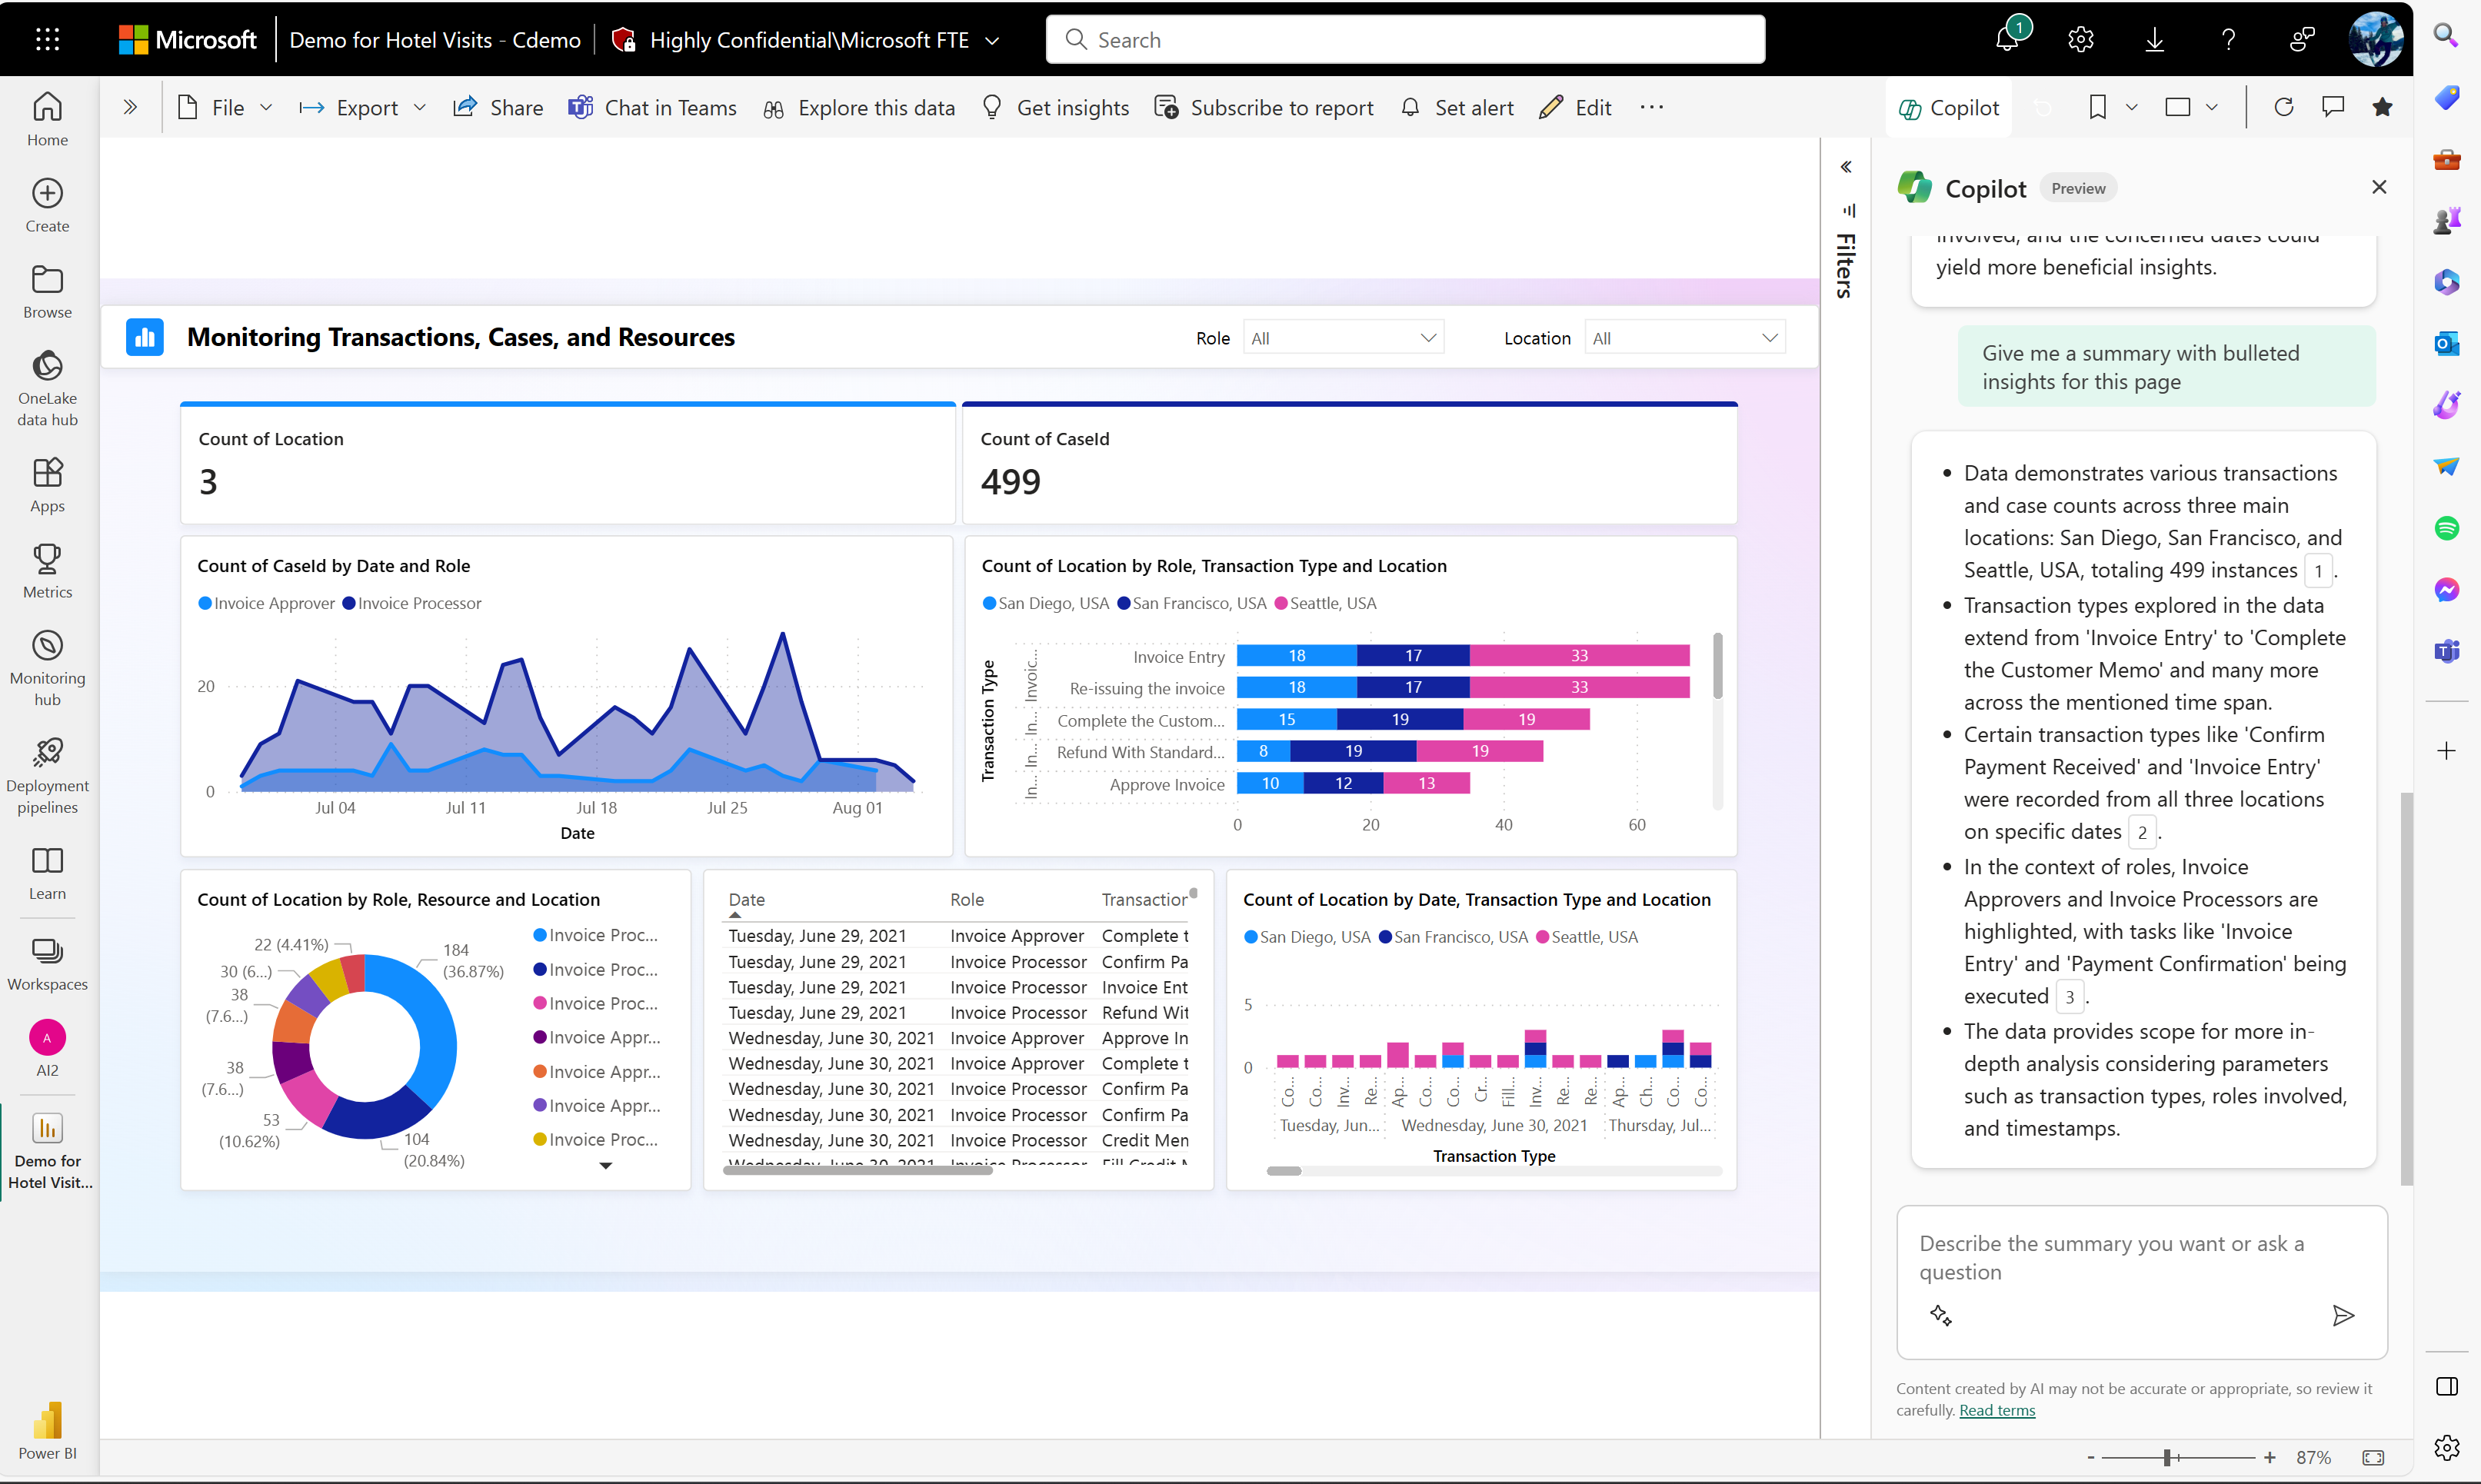
Summarize a report page in the Copilot pane
APPLIES TO:
Power BI Desktop
Power BI service
Even if you don't have permission to edit a Power BI report, Copilot can still create a summary for you in the Copilot pane. You can just be a report reader. If you can edit the report, you can also create a visual in the report that provides a summary. See the article Write Copilot prompts to create narrative visuals in Power BI for details.
Note
- Your administrator needs to enable Copilot in Microsoft Fabric.
- Your F64 or P1 capacity needs to be in one of the regions listed in this article, Fabric region availability. If it isn't, you can't use Copilot.
- Your administrator needs to enable the tenant switch before you start using Copilot. See the article Copilot tenant settings for details.
- If your tenant or capacity is outside the US or France, Copilot is disabled by default unless your Fabric tenant admin enables the Data sent to Azure OpenAI can be processed outside your tenant's geographic region, compliance boundary, or national cloud instance tenant setting in the Fabric Admin portal.
- Copilot in Microsoft Fabric isn't supported on trial SKUs. Only paid SKUs (F64 or higher, or P1 or higher) are supported.
Given a Power BI report page populated with visuals, you might spend anywhere from 30 minutes to a couple hours combing through the report to fully understand your key questions, key insights, and what's going on at a high level, so you can summarize it for your leadership team. That length of time varies depending on how familiar you are with the data and how much involvement the analyst has in answering your questions. Now, with the summary feature in the Copilot pane, you can generate a summary of the data displayed on the page in seconds, instead of the minutes or hours to manually interpret the data and then write a summary, or ask an analyst to interpret and write a summary for you.
Get started with standard prompts
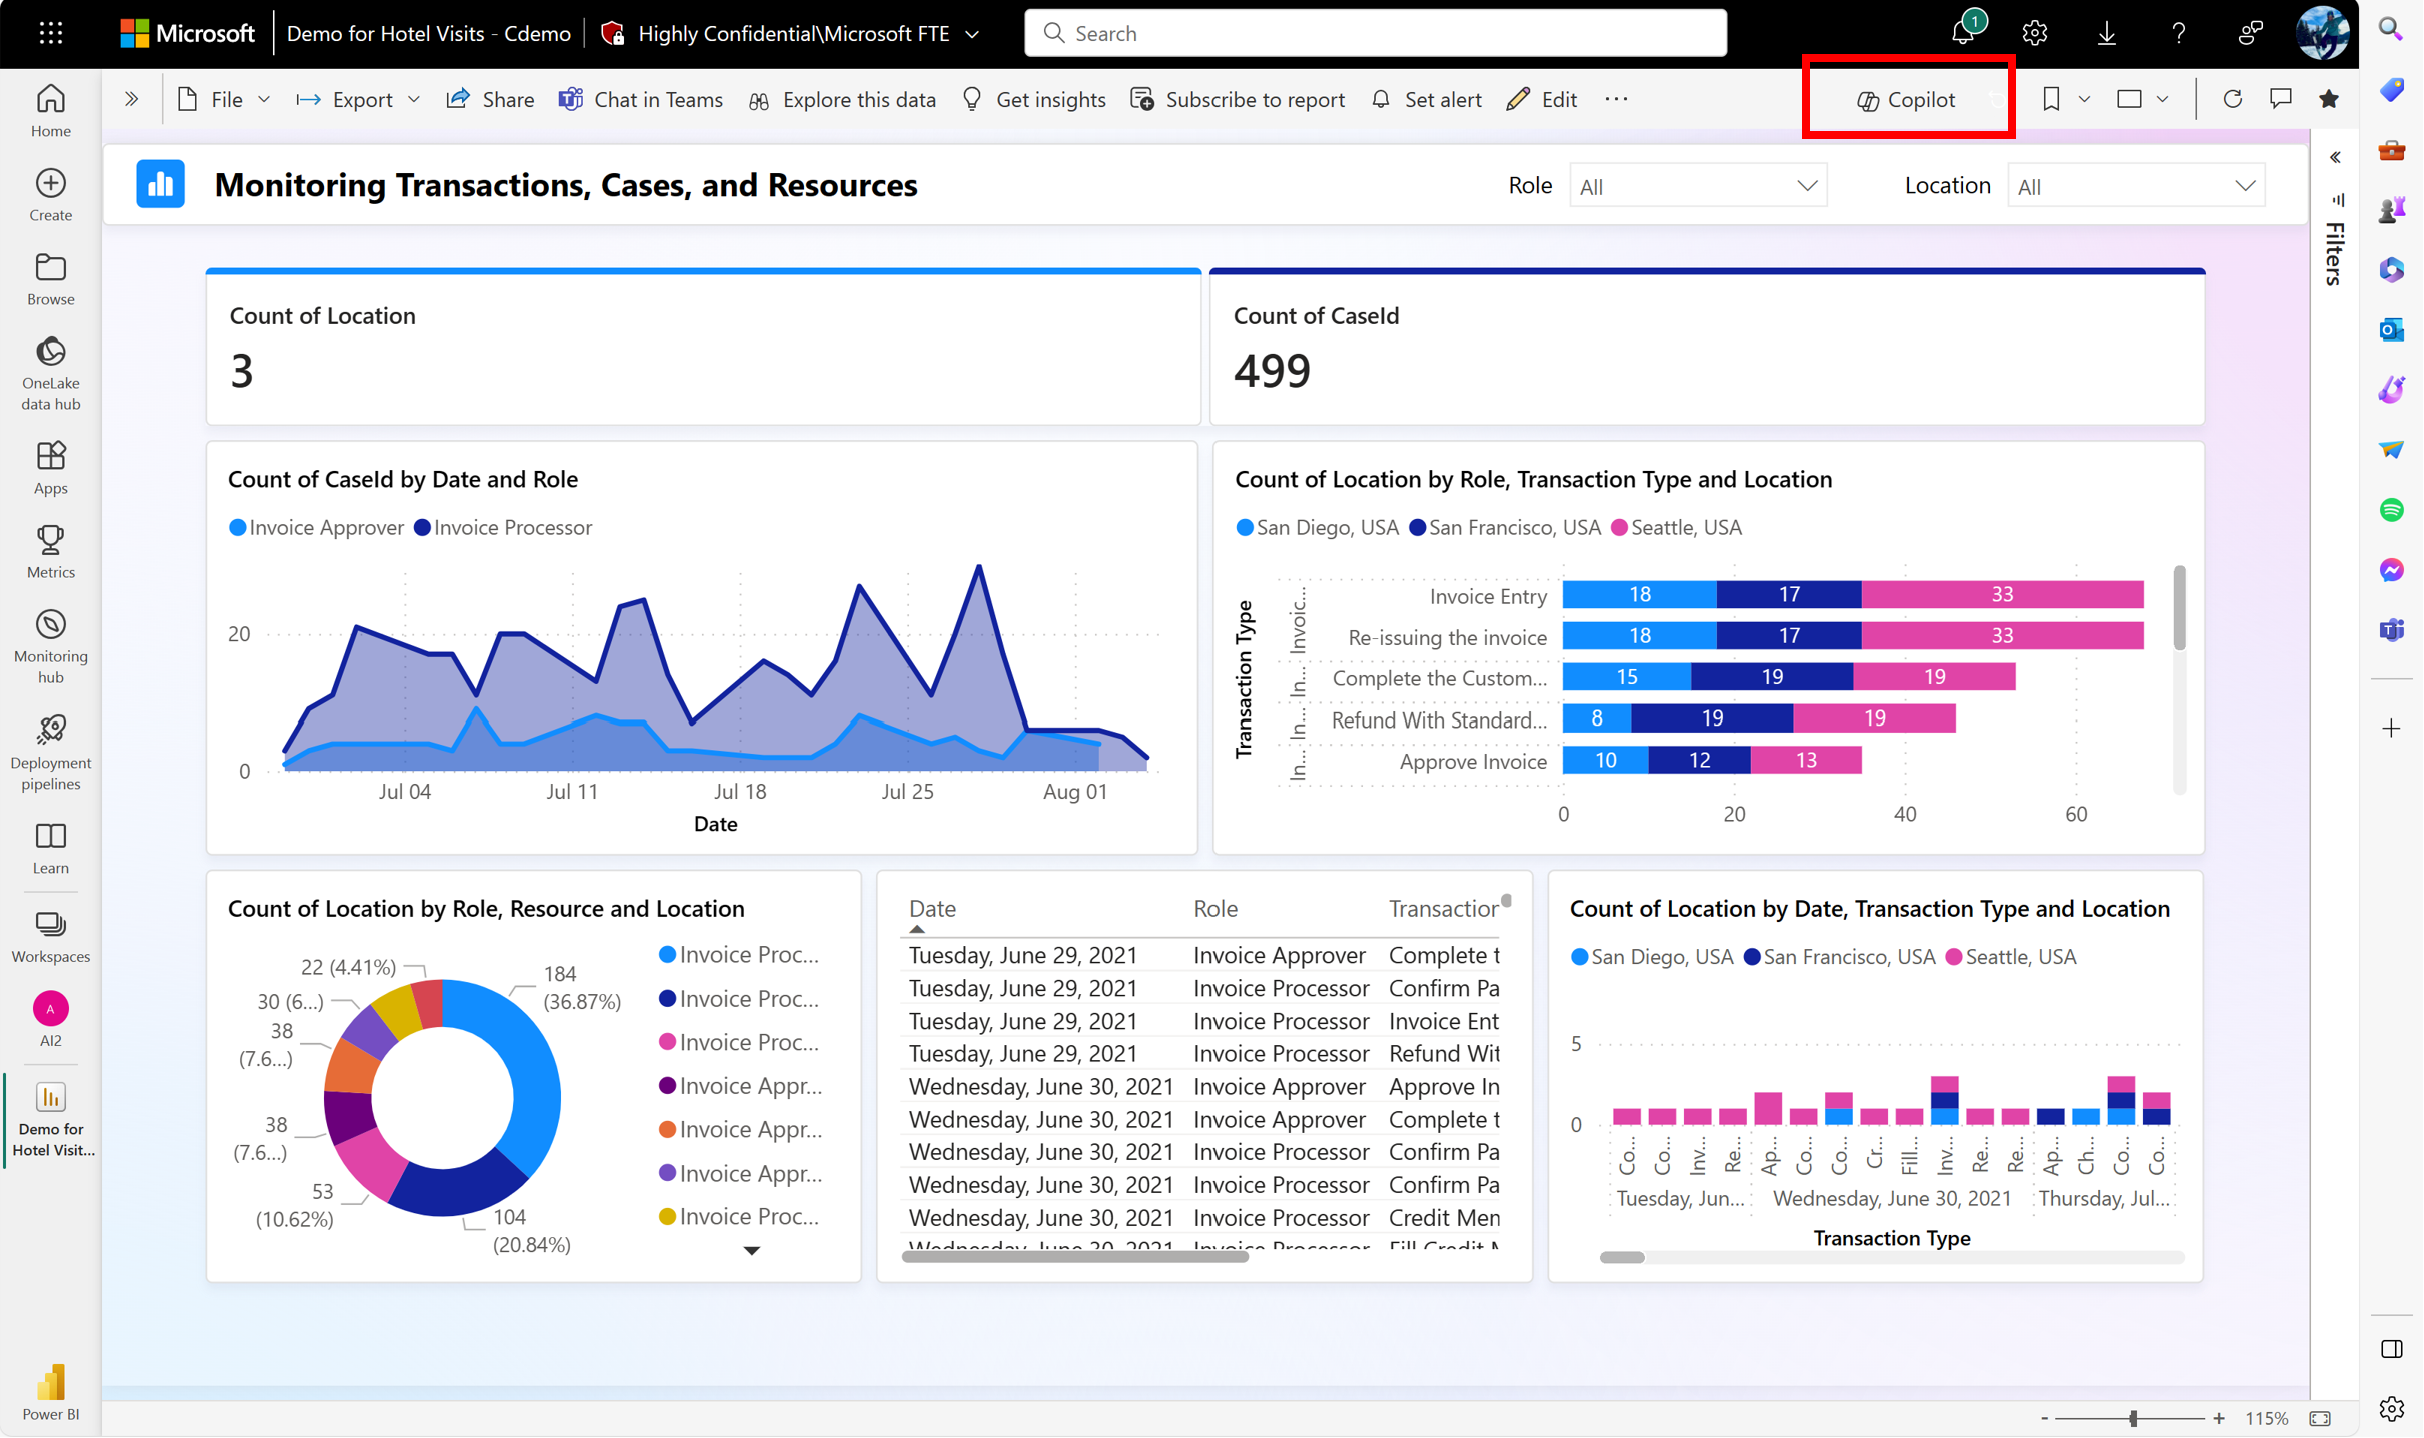
To get started, select the Copilot button in the ribbon in either Power BI Desktop or the Power BI service. In the service, the button is available in both edit mode and view mode.
Tip
If you don't see Copilot, your admins might not have enabled it, or you could be in a workspace that doesn't meet the Copilot requirements.
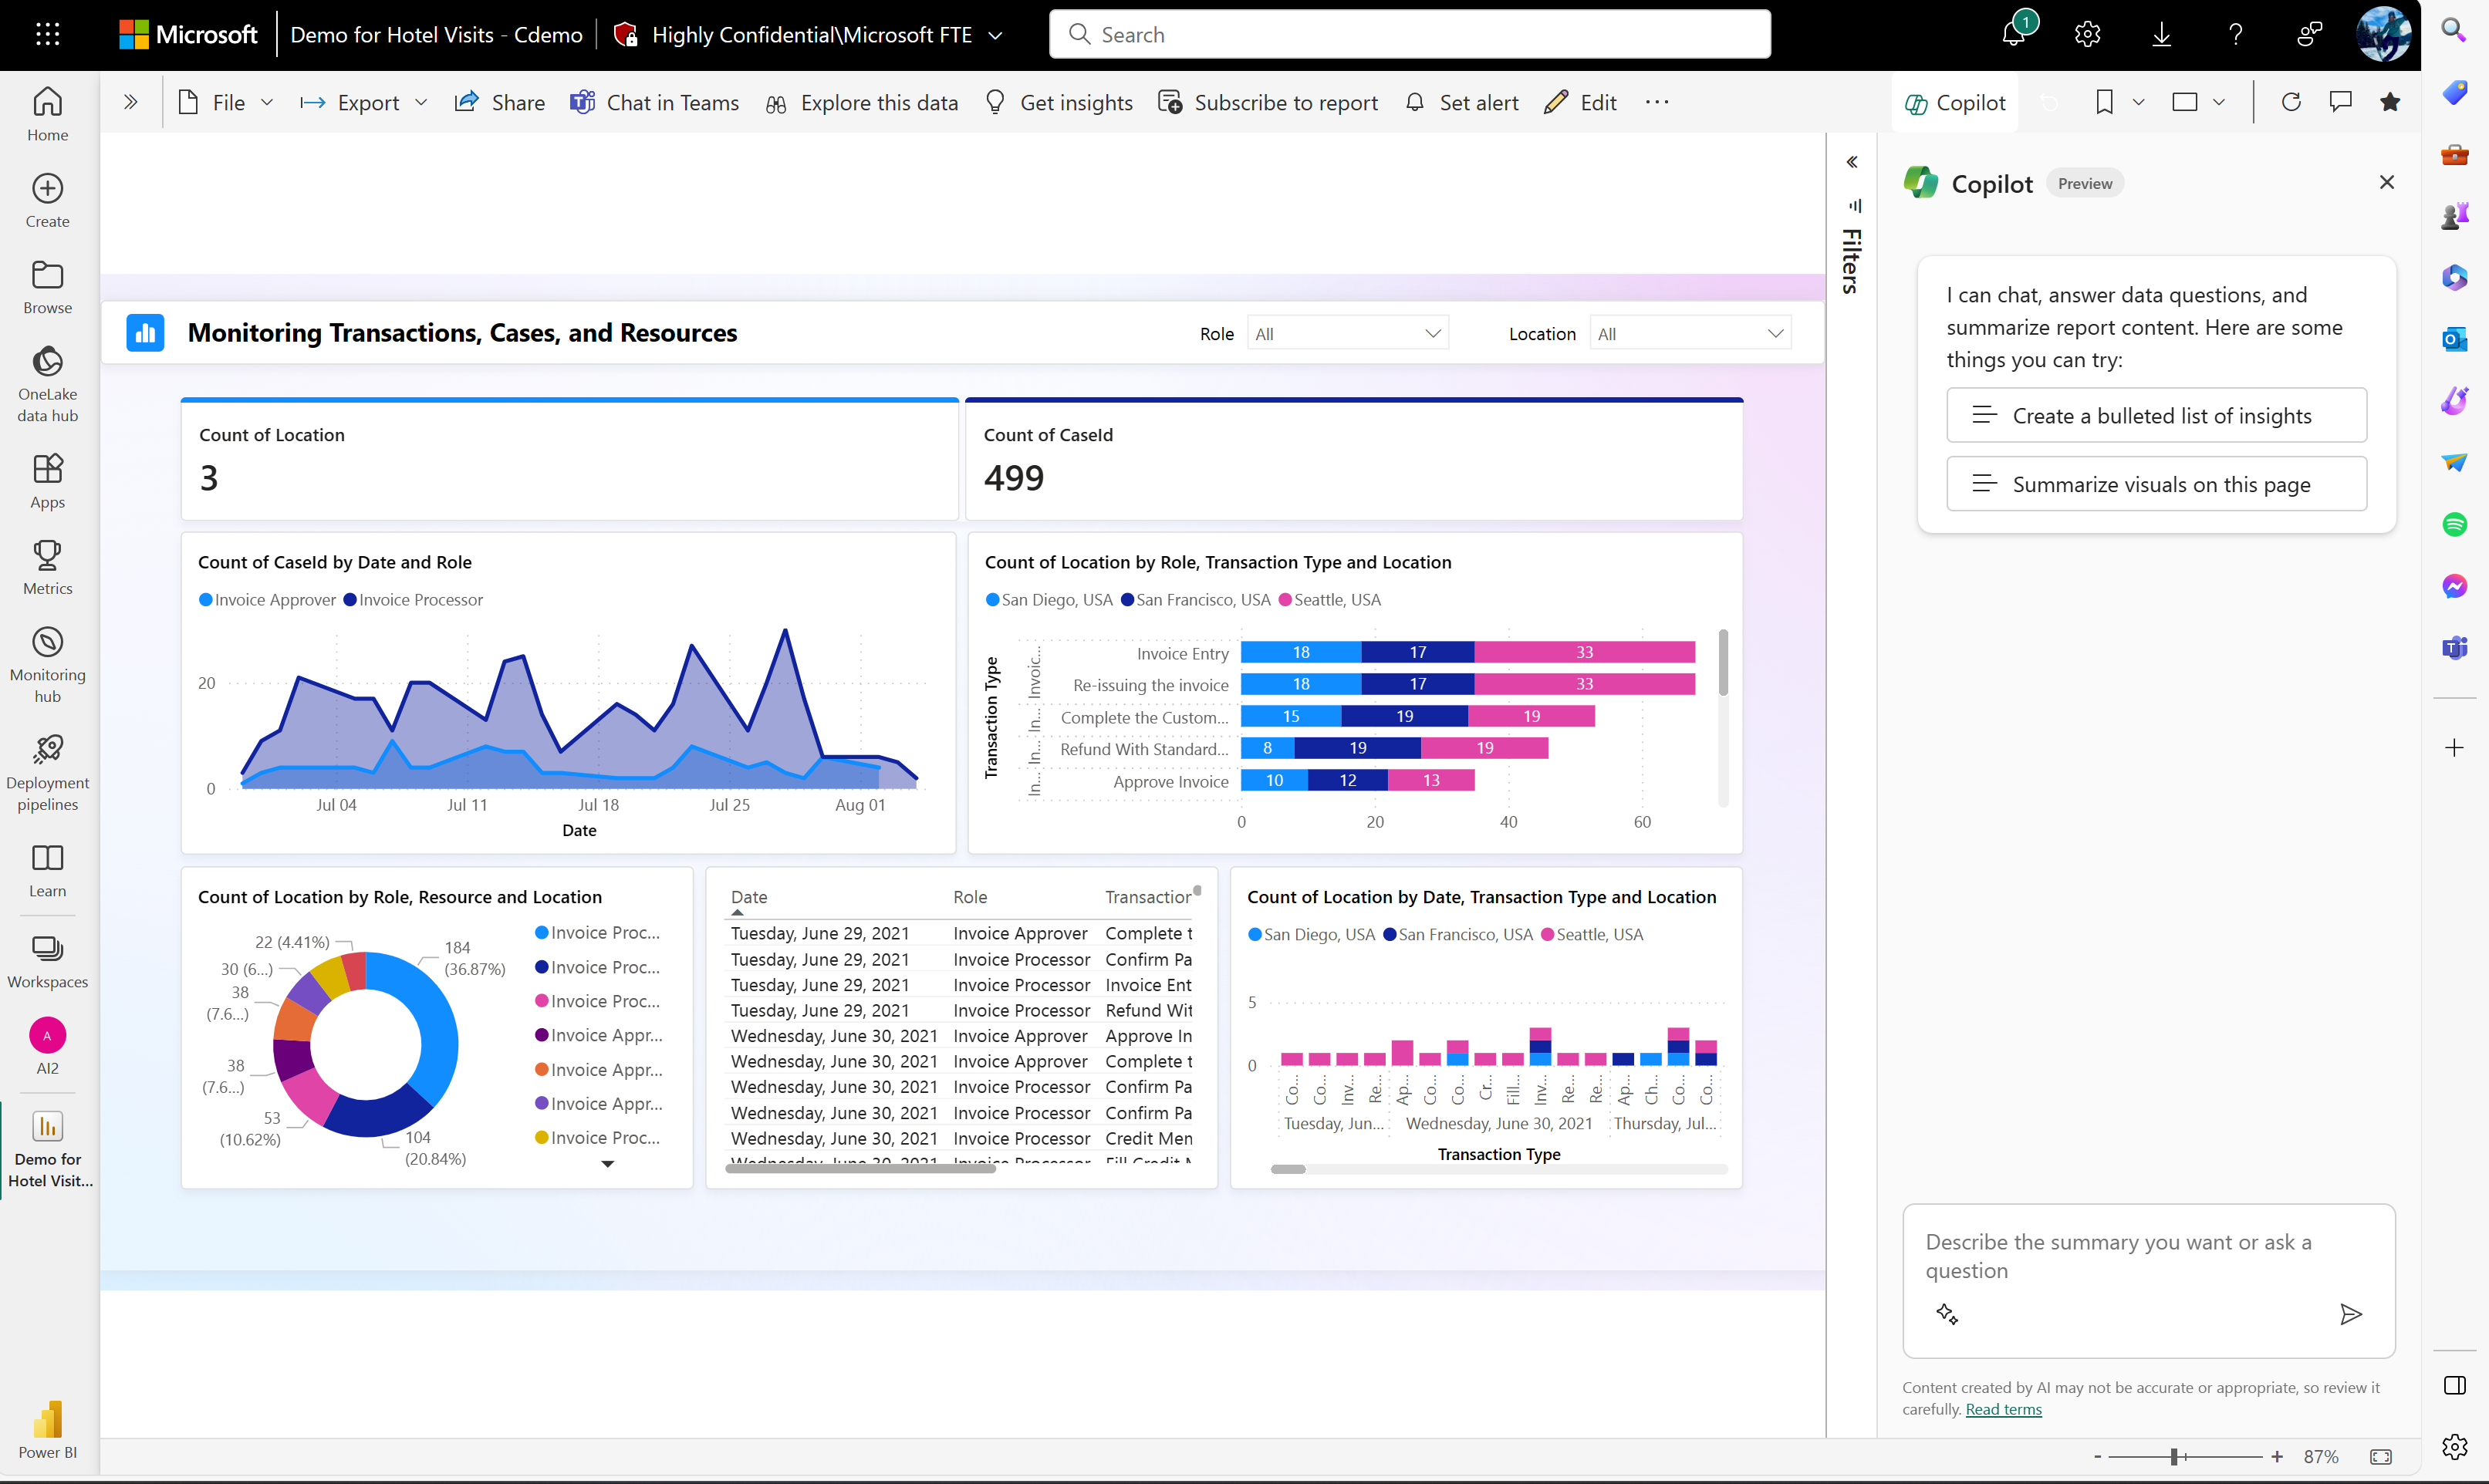
The Copilot pane opens.
You can choose from suggested prompts of summaries from the main Copilot menu such as "Create a bulleted list of insights" or "Summarize visuals on this page".
Or you can select prompts from the user prompt guide in the sparkle menu in the lower left-hand corner of the dialogue input box. Those options are:
- Give an executive summary of the report.
- Summarize visuals on the page.
- Create a bulleted list of insights.
After you choose a prompt, select Enter and watch Copilot generate your summary.
Copilot uses Azure Open AI to look at the visuals on the report page, and create a natural language summary using the data in those visuals. It doesn't take into account other pages or data that's not currently visualized in your current view.
Reference footnotes
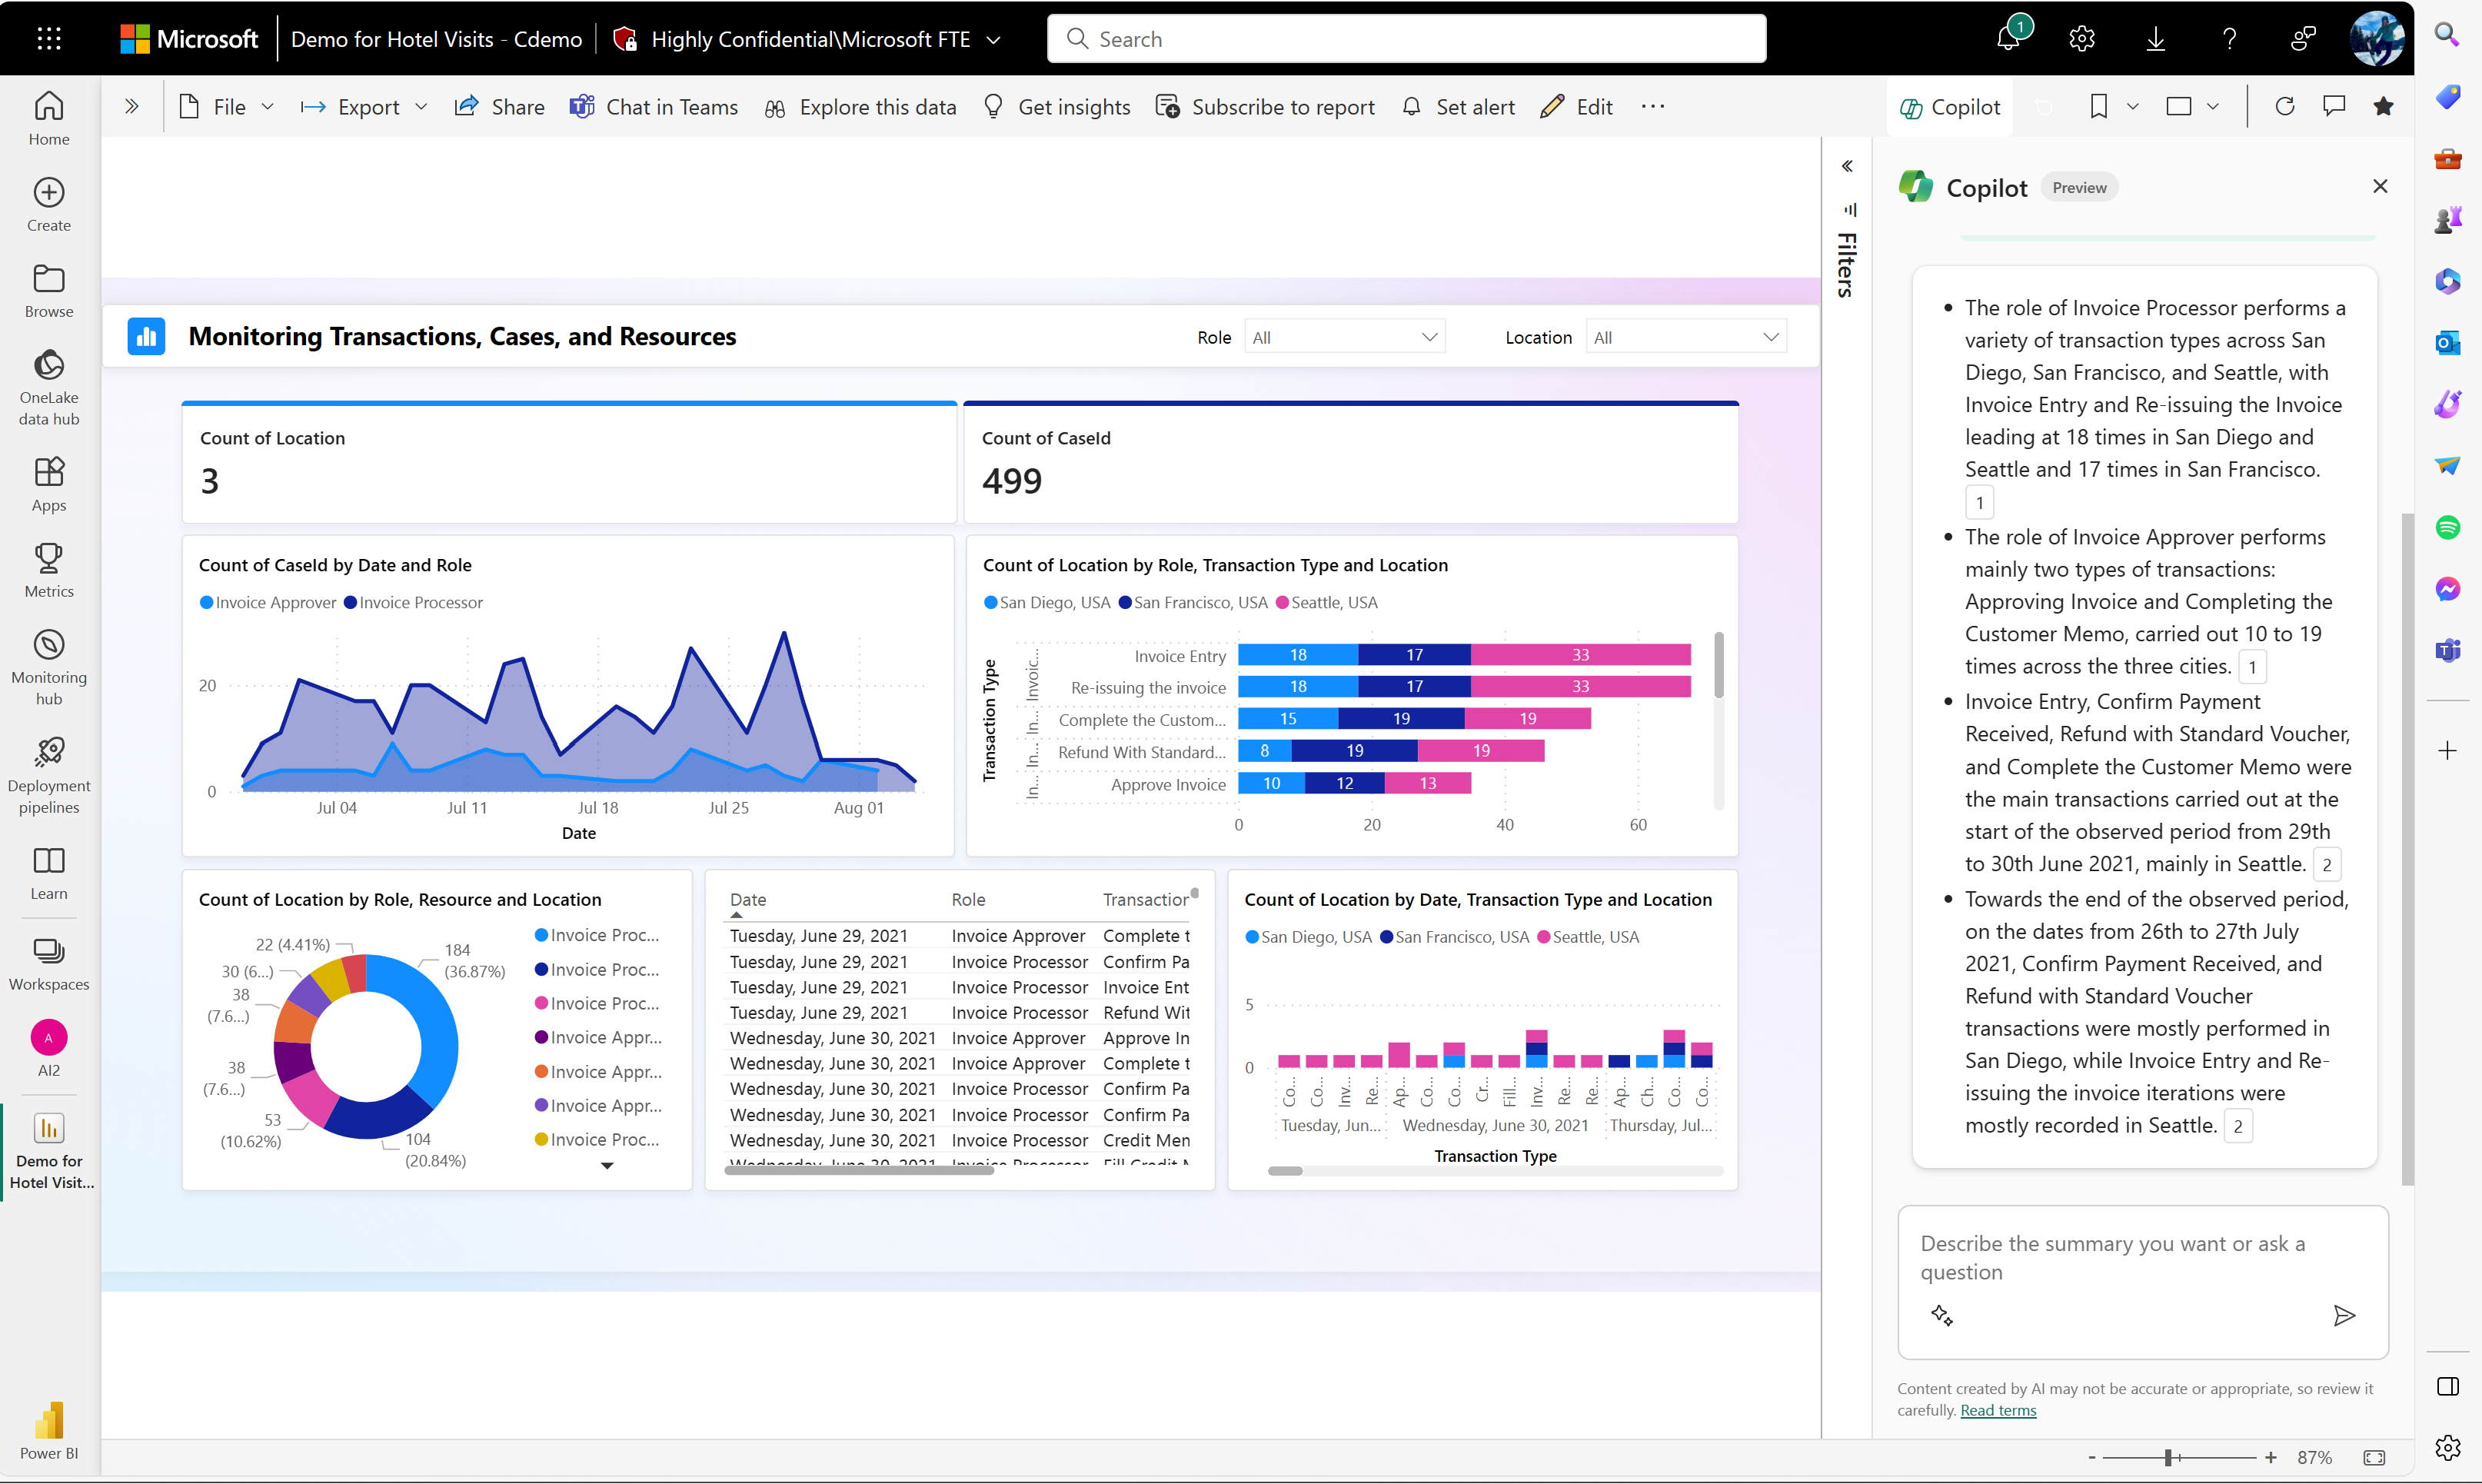
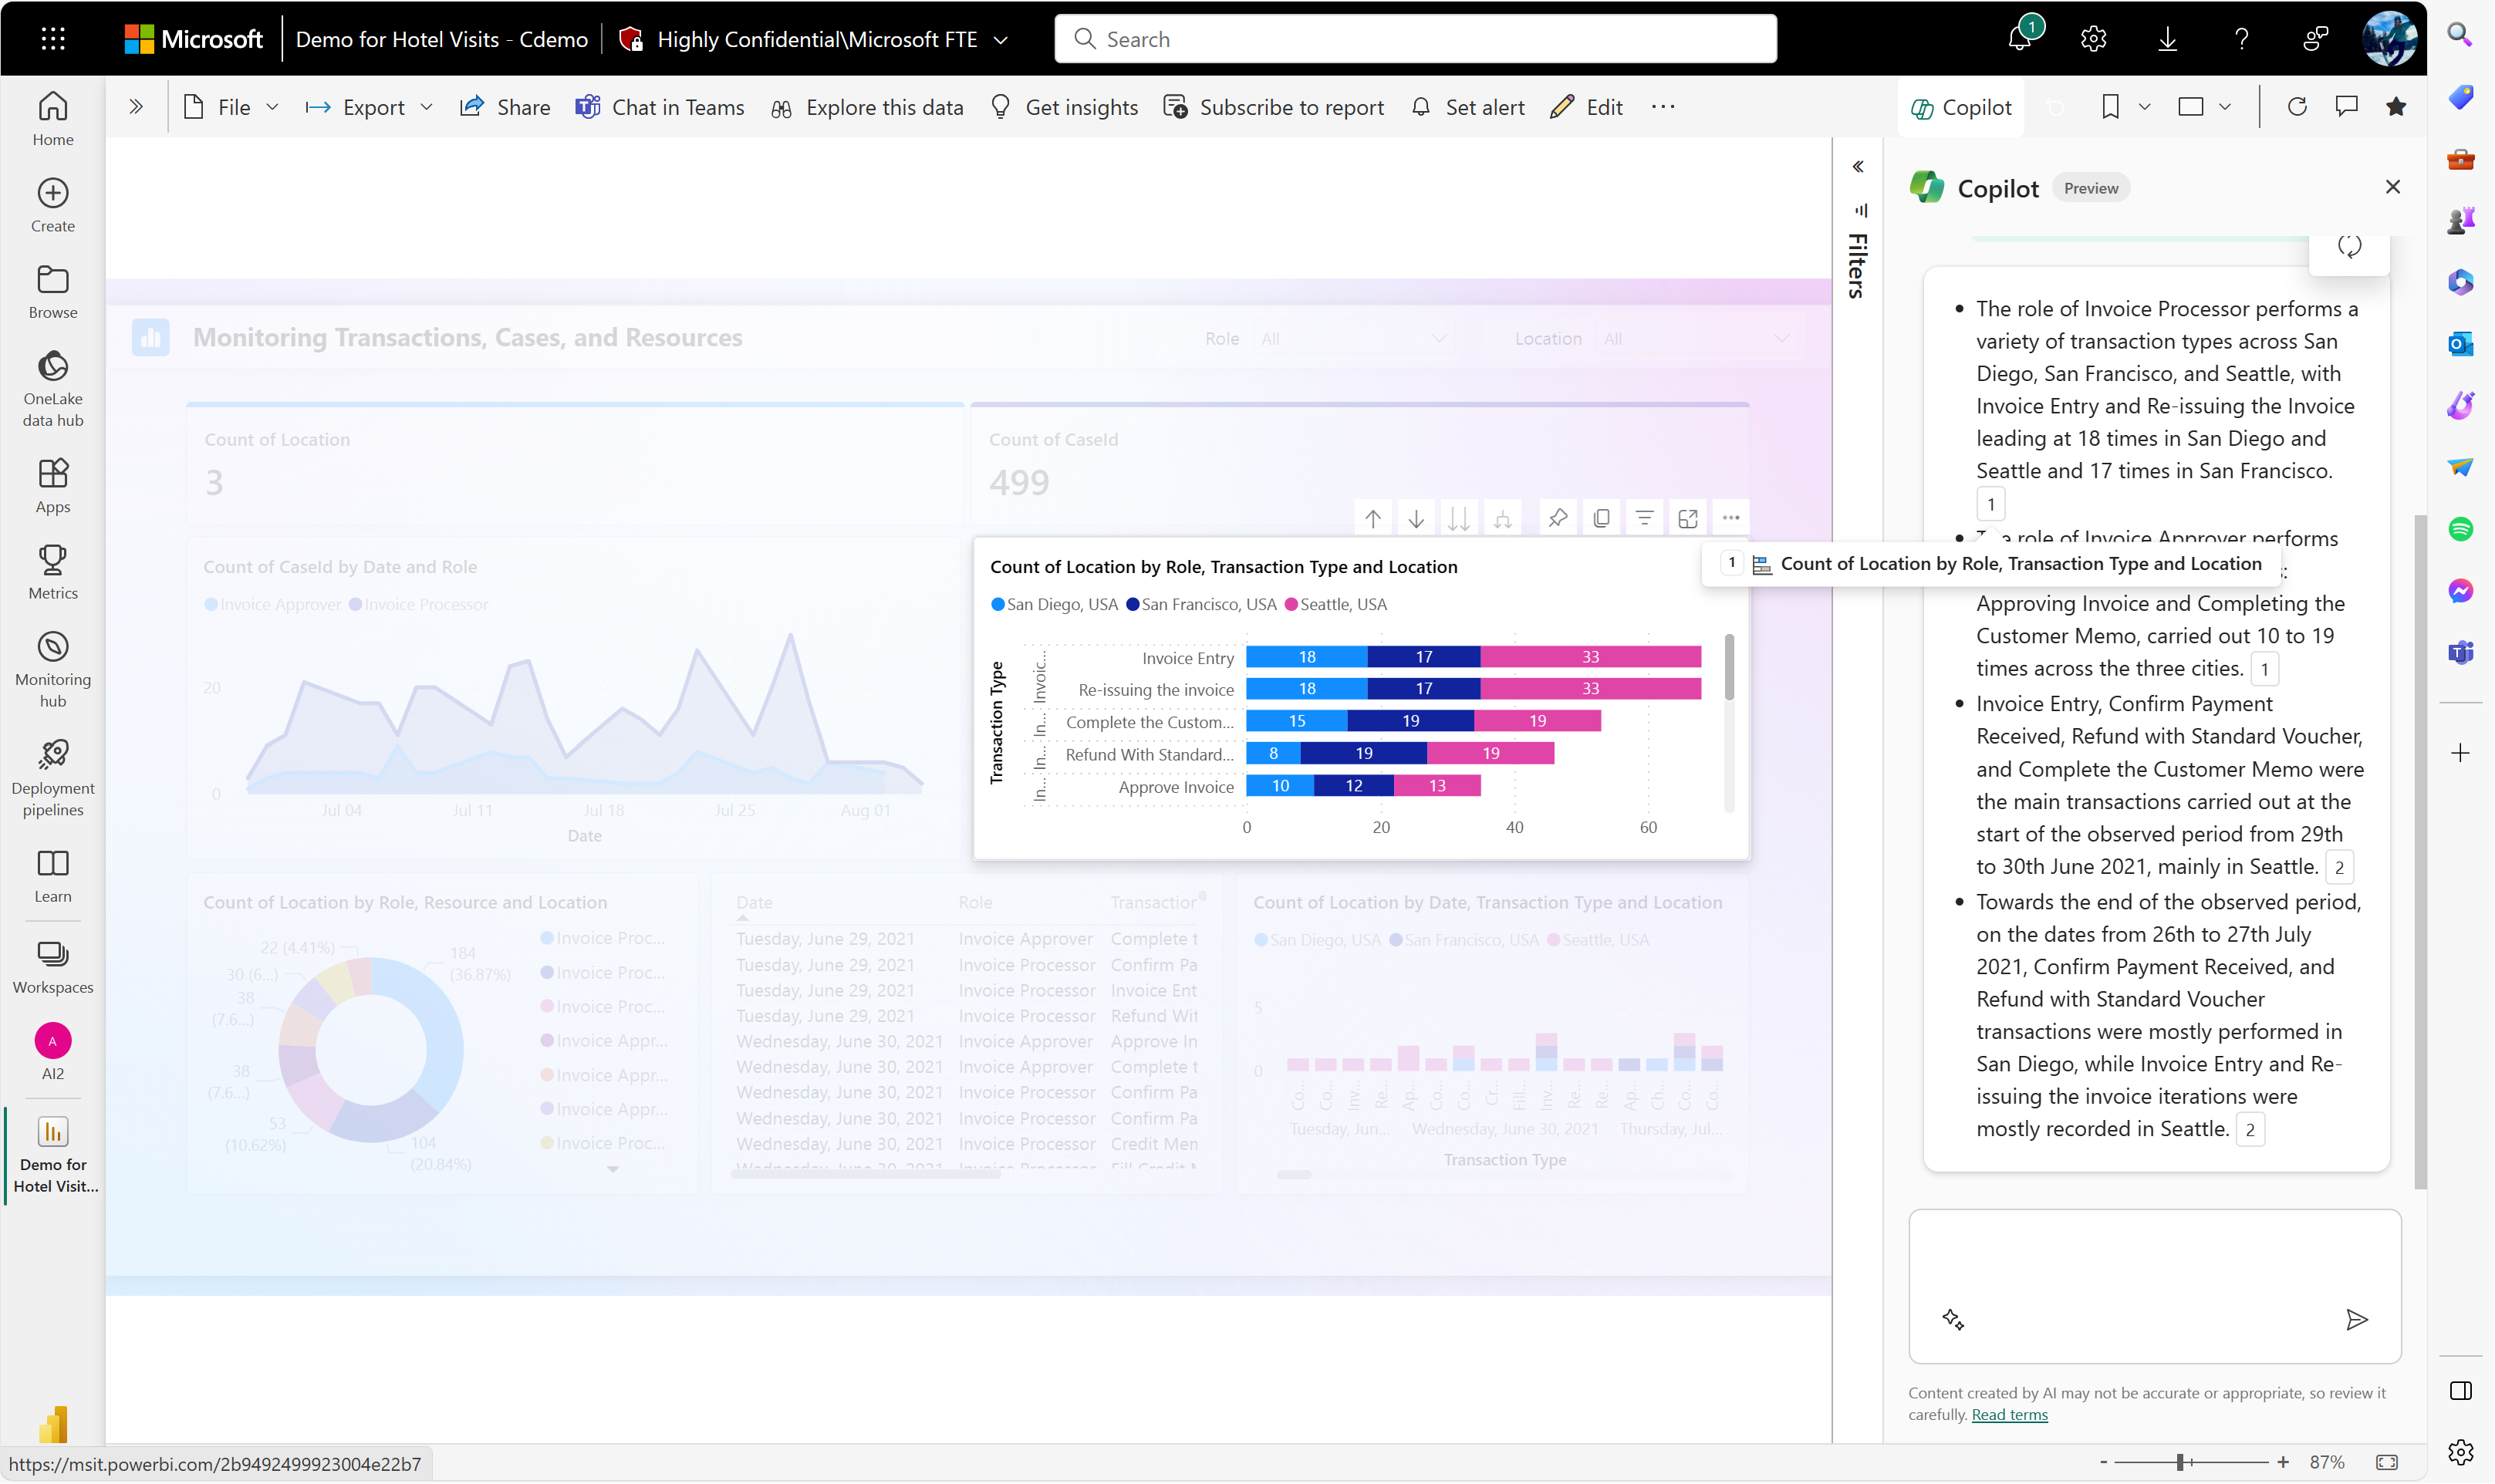
In a summary response from the Copilot pane, reference footnotes are provided within the summary to indicate which data visuals Copilot referenced to generate the summary. These footnotes help you quickly cross-check the summary output to ensure accuracy, increasing productivity.
Custom prompts
The summary skill benefit goes beyond providing a generic summary for a consumer. You can type custom prompts to request a specific summary, such as a bulleted summary or a summary specifically about sales, or about another nuanced slice of your data.
Copilot allows you to generate a custom summary to fit your business needs. Here are some examples of custom summaries:
- Give me a summary of my revenue over the last fiscal year and describe any significant outliers.
- Summarize the trends that are shown on this report page.
- Outline the insights on this page in reference to bike sales and geography.
- Summarize the data in a way that allows me to use it in an email to leadership.
- Summarize the data on this page specific to Seattle, WA.
Benefits
This customization allows you to focus on nuanced aspects of the data that are relevant to your objectives or questions. Some key advantages include:
- Relevance: Customized summaries ensure that the information provided is directly aligned with your specific inquiry or area of interest, making the insights more relevant and actionable.
- Efficiency: You can quickly obtain targeted information without sifting through irrelevant details. This streamlines the decision-making process and enhances overall efficiency.
- Personalization: Customized summaries cater to individual preferences and priorities, providing an experience personalized for you. This personalization fosters a sense of ownership and engagement with the data.
- Precision: You can receive precise details on the metrics or dimensions that matter most to you, allowing for a more detailed and nuanced understanding of the data.
- Improved decision-making: Customized summaries empower you to make informed decisions based on specific, tailored insights, contributing to more effective and strategic decision-making.
- Flexibility: You have the flexibility to adapt the summary to changing business needs or evolving questions, ensuring that the insights remain pertinent over time.
Answer questions about your report content in the Copilot pane
The Copilot pane also allows you to ask specific questions about your report content and receive a summarized response. This allows you to not only request summaries but ask additional follow-up questions about your report page or about a summary you've received. The Copilot pane generates an answer that contains visual references within the report. You can ask fact-based questions from the report page you're on, or speculative questions like "what are some reasons", "why might", and some "what if" questions.
Examples of questions you can ask
- Which team had the highest sales?
- Which product had the highest profit margin?
- Why is there a significant variance between the sales amount and the sales quota across departments?
- What are some factors behind the major increase in Accessories sales?
- What is the difference in revenue by product streams, and are they statistically significant?
- What are the trends in wait times and call lengths across different cities, and how can we improve these metrics?
- What are some questions leadership might ask about this data?
Limitations and considerations
- For the Copilot button to be available in a report, the report needs to be in:
- An eligible workspace: the workspace needs to have a paid dedicated capacity. The workspace needs to be a paid Premium or F64 or higher.
- A tenant where the admin setting is enabled.
- If you have a visual with extensive data points, Copilot may answer on truncated data. We are working on techniques to improve this.
- The accuracy of the public preview may be limited.
- The summary in the Copilot pane can only summarize one report page at a time. It doesn't summarize across the entire report or multiple pages.
- The Copilot summary pane doesn't return new visuals as data answers.
Send feedback
We always welcome your feedback about our products. Especially during public preview, your feedback helps us improve the product faster.
Next steps
Feedback
Coming soon: Throughout 2024 we will be phasing out GitHub Issues as the feedback mechanism for content and replacing it with a new feedback system. For more information see: https://aka.ms/ContentUserFeedback.
Submit and view feedback for
