Note
Access to this page requires authorization. You can try signing in or changing directories.
Access to this page requires authorization. You can try changing directories.
APPLIES TO: ![]() Power BI Desktop
Power BI Desktop ![]() Power BI service
Power BI service
In Power BI reports, you can find out how each of your report visuals is performing. By using the performance analyzer, you can see how long each visual takes to load. Each load time is further broken down category, such as time the DAX query took to run. The DAX query for each visual can be copied, and ran in DAX query view in Power BI Desktop. The performance analyzer is a pane available in Report view of Power BI Desktop or when editing a report in the web.

Performance analyzer displays the load duration of all the visuals. Including when visuals load from different interactions, such as applying filters from slicers. It also presents the information so that you can view, drill down, or export the results to a file. Performance Analyzer can help you identify visuals that affect the performance of your reports and identify the reason for the impact.
Display the Performance Analyzer pane in Power BI Desktop
In Power BI Desktop select the Optimize ribbon, and then select Performance Analyzer to display the Performance Analyzer pane.

Display the Performance Analyzer pane in the web
In Power BI service open a report and select Edit. When editing a report, select the View menu, and then select Performance Analyzer to display the Performance Analyzer pane.

Once selected, performance analyzer is displayed in its own pane to the right of the report canvas in either Power BI Desktop or the Power BI service.
Use Performance Analyzer
Performance analyzer measures the time to load a visual. Including when the visuals reload as a result of any user interaction. For example, adjusting a slicer requires the slicer visual to be modified, a query to be sent to the data model, and displayed again.
To have performance analyzer begin recording, select Start recording.
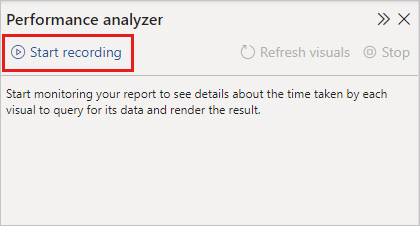
Any actions you take in the report are displayed and logged in the performance analyzer pane, in the order that the visual is loaded. For example, perhaps you have a report users say takes a long time to load when a slider is adjusted. Performance analyzer can tell you which visual is the culprit and identify which aspects are taking the longest duration.
Once you start recording, the Start recording button is grayed out (inactive, since you've already begun recording) and the Stop button is active.
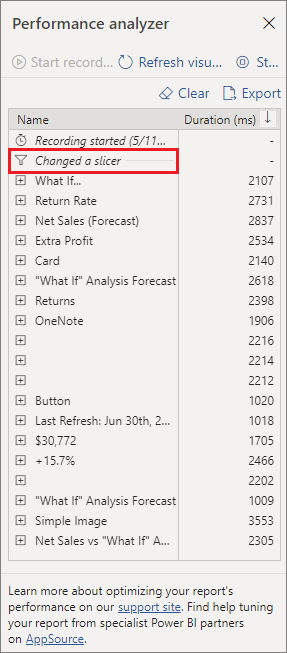
Performance analyzer collects and displays information in real time. Each time you select a visual, move a slicer, or interact in any other way, performance analyzer logs the new duration.
Each interaction has a section identifier in the pane, describing the action that initiated the new entries. In the following image, the interaction was changing a slicer.
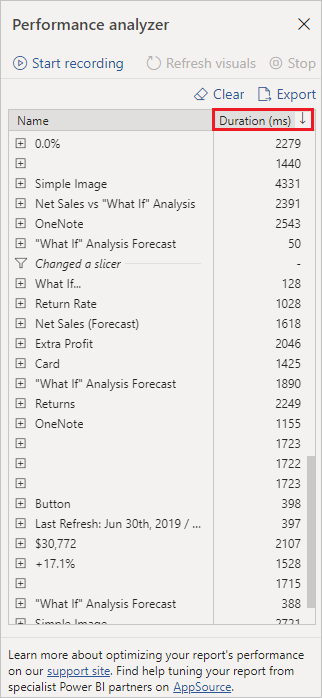
Each visual's log information includes the time spent (duration) to complete the following categories of tasks:
- DAX query - If a DAX query was required, this duration is the time between the visual sending the query and the semantic model or Analysis services model returning the results.
- Direct query - If the table storage mode is DirectQuery, this duration is the time for the external query to return results.
- Visual display - This duration is the time required for the visual to draw on the screen, including the time required to retrieve any web images or geocoding.
- Other - This duration is the time required by the visual for preparing queries, waiting for other visuals to complete, or performing other background processing.
- Evaluated parameters (preview) - This duration is the time spent evaluating the field parameters within a visual. Learn more about field parameters (preview).
The Duration (ms) values indicate the difference between a start and end timestamp for each operation. Most canvas and visual operations execute sequentially on a single User Interface thread, shared by multiple operations. The reported durations include time spent queued while other operations complete. The Performance Analyzer sample on GitHub and its associated documentation provide details about how visuals query data and render.
After you've interacted with the report, you can select the Stop button. The performance information remains in the pane after you select Stop for you to analyze.
To clear out the information in the Performance Analyzer pane, select Clear. All information is erased and isn't saved when you select Clear. To learn how to save information in logs, see the following section.
Tip
The DAX query performance is impacted by the complexity of the calculations, the number of tables involved, and the relationships between them.
DAX queries in visuals
Visuals in Power BI reports display data from the semantic model. The data is accessed with a DAX query. You can see the DAX query of each visual by selecting Copy query in performance analyzer. For tables using DirectQuery table storage mode, this query includes the DAX query and the translated query in SQL or KQL.
Run in DAX query view in performance analyzer runs the DAX query in DAX query view. The result grid shows the data the visual uses and you can inspect the logic of the DAX query itself. This option isn't available in the Power BI service, but the copied DAX query can be run after navigating to DAX query view in the service. From the report, select open data model, which opens the web modeling experience. From web modeling, select DAX query view and run the query.
The structure of a DAX query from a visual is more verbose and structured than necessary to get the same result. The visual DAX query structure helps as you change visuals from one type to another when building a report. Fabric Copilot to write and explain DAX queries in DAX query view can help structure the visual DAX query into a simpler form with the following prompt.
Remove the VARs and TOPN and simplify this DAX query
Copilot is powered by AI, so surprises and mistakes are possible. For more information, see Copilot general use FAQs.
Learn more about DAX queries in the DAX queries learn documentation.
Refreshing visuals
You can select refresh visuals in the performance analyzer pane to gather timing information about all the visuals on the current report page.
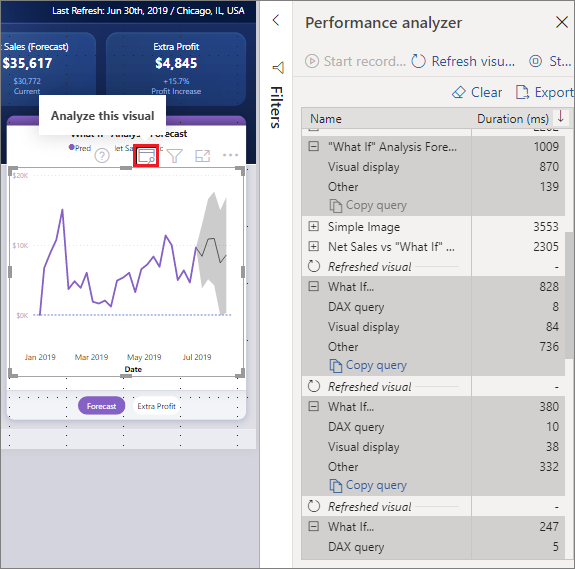
You can also refresh individual visuals. When performance analyzer is recording, you can select analyze this visual, found in the top-right corner of each visual, to refresh that visual and capture its performance information.
Save performance information
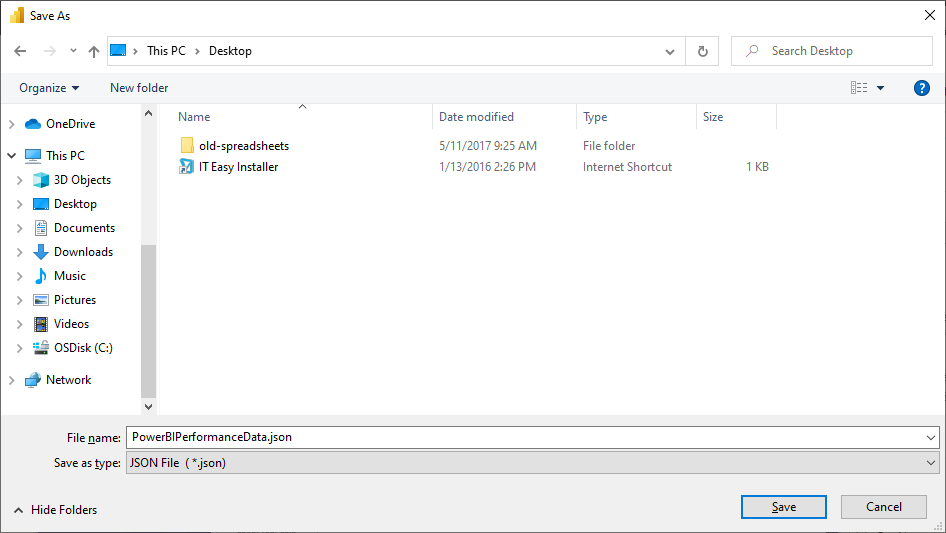
You can save the information that performance analyzer creates about a report by selecting the export button. Selecting export creates a .json file with information from the performance analyzer pane.
Related content
For more information about Power BI Desktop and how to get started, see the following articles.
- What is Power BI?
- Query overview with Power BI Desktop
- DAX queries
- DAX query view
- Fabric Copilot to write and explain DAX queries
For information about the Performance Analyzer sample, check out the following resources.