Note
Access to this page requires authorization. You can try signing in or changing directories.
Access to this page requires authorization. You can try changing directories.
Applies to: ✅ Power BI Desktop
Power BI Desktop includes Report view, where you create and edit report pages and visualizations. You can move visualizations, copy and paste them, and format your report.
In Power BI Desktop, you can also transform data, create relationships between tables, and work with your semantic model. Save the Power BI Desktop file locally or to the cloud, and then publish it to the Power BI service.
This article covers Report view in Power BI Desktop. To create, edit, or view a report in a browser, see Use Report view in the Power BI service.
Get started with Report view
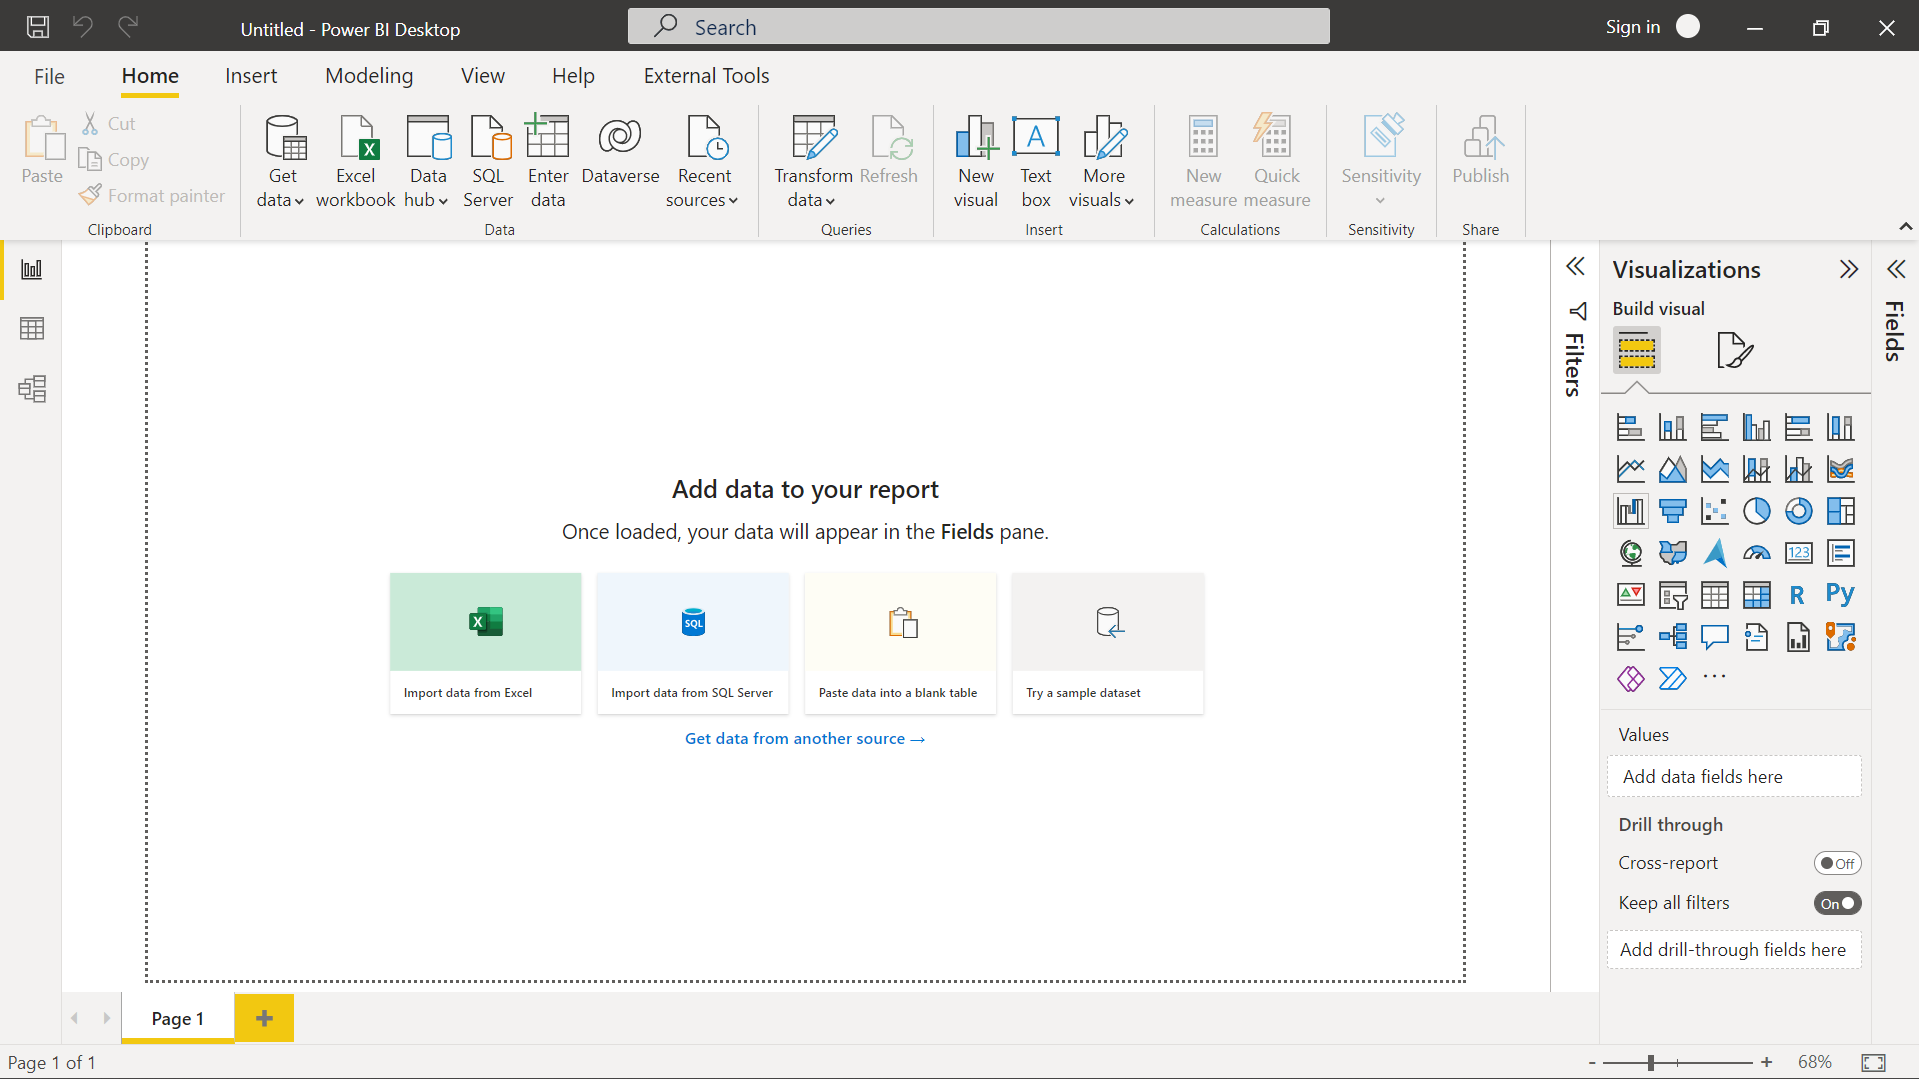
When you first load data in Power BI Desktop, you see the Report view with a blank canvas, with links to help you add data to your report.
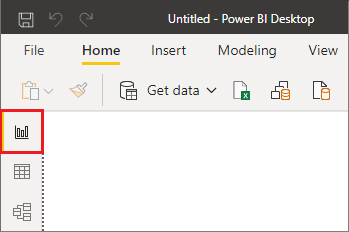
You can switch between Report, Data, and Model views by selecting the icons in the left-hand navigation pane:
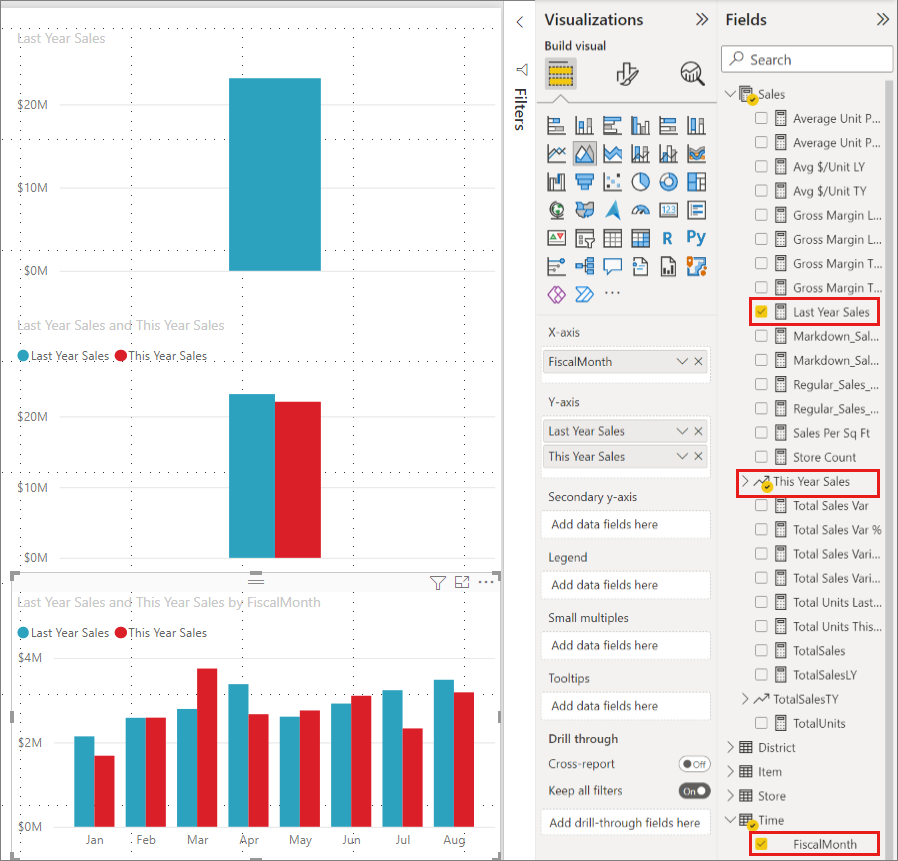
Once you add data, you can add fields to a new visualization in the canvas.
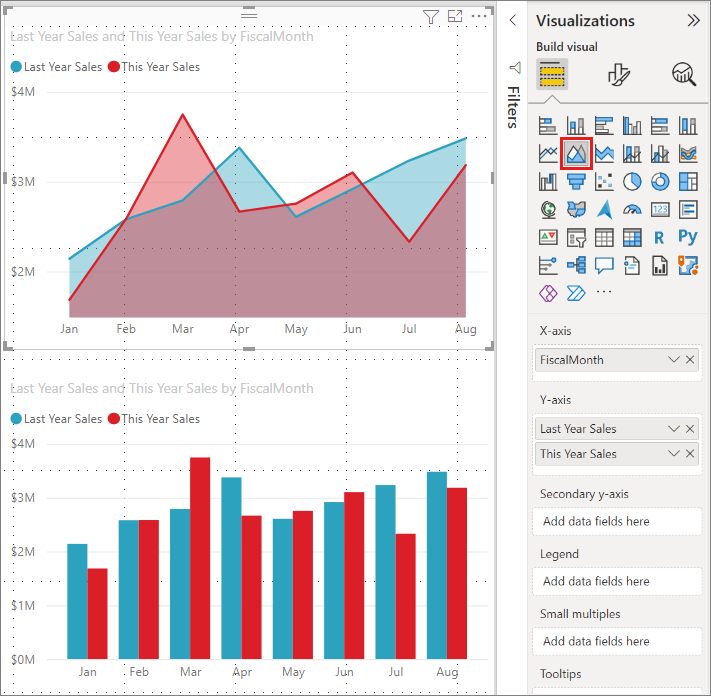
To change the type of visualization, select it on the canvas, and then select a new type in Visualizations.
Tip
Be sure to experiment with different visualization types. It's important your visualization convey information in your data clearly.
A report has at least one blank page to start. Pages appear in the navigation area at the bottom of the Report view. You can add all sorts of visualizations to a page, but it's important not to overdo it. Too many visualizations on a page make it look busy and difficult to find the right information. You can add new pages to your report. Just select New page from the Insert tab on the ribbon, and then select Blank page.
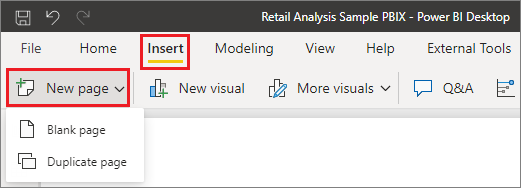
You can also select the + icon next to the pages in the navigation area below the canvas to create a new page.

To delete a page, select the x on the page's tab at the bottom of the Report view.

Note
You can't pin reports and visualizations to a dashboard from Power BI Desktop. To do that, you need to publish to your Power BI site. For more information, see Publish semantic models and reports from Power BI Desktop.
Copy and paste visuals between reports
You can easily take a visual from one Power BI Desktop report and paste it into another report. Use the Ctrl+C keyboard shortcut to copy your report visual. In the other Power BI Desktop report, use Ctrl+V to paste the visual into the other report. You can copy one visual at a time, or all visuals on a page, then paste into the destination Power BI Desktop report.
The ability to copy and paste visuals is useful for people who build and update multiple reports frequently. When you copy between files, the process carries forward settings and formatting that you explicitly set in the formatting pane. Visual elements that rely on a theme or the default settings automatically update to match the theme of the destination report. When you get a visual formatted and appearing the way you want, you can copy and paste that visual into new reports and preserve your work.
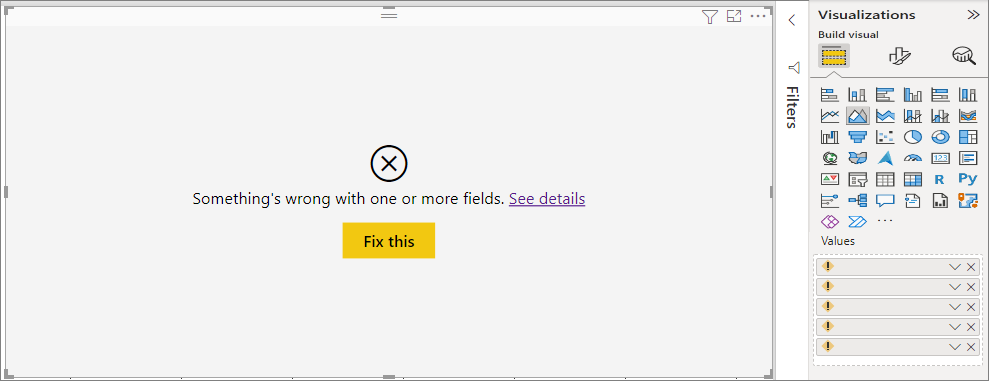
If the fields in your model are different, you see an error on the visual and a warning about which fields don't exist. The error is similar to the experience you see when you delete a field in the model that a visual is using.
Hide report pages
When you create a report, you can also hide pages from the report. This approach might be useful if you need to create underlying data or visuals in a report, but you don't want those pages to be visible to others. Hiding pages can be useful when you create tables or supporting visuals that are used in other report pages. Many other creative reasons exist for creating a report page and then hiding it from a report you want to publish.
Hiding a report page is easy. Right-click the report page tab, and select Hide from the menu.
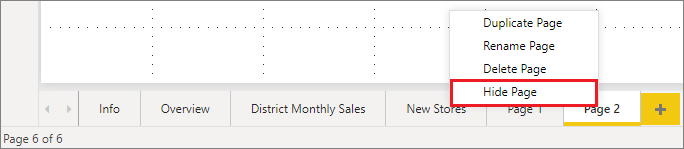
Keep a few considerations in mind when hiding a report page:
You can still see a hidden report view when in Power BI Desktop, even though the page shows a hidden page icon. In the following image, the Overview page is hidden.

You can't see a hidden report page when you view the report in the Power BI service in Reading view, but you can see it in Edit view.
If you save the report while looking at the hidden page, and then you publish it to the Power BI service, that page is the first one your report readers see.
Hiding a report page is not a security measure. Users can still access the page, and its content is still accessible through drillthrough and other methods.
No view-mode navigation arrows appear when a page is hidden in View mode.