Note
Access to this page requires authorization. You can try signing in or changing directories.
Access to this page requires authorization. You can try changing directories.
APPLIES TO: ![]() Power BI Desktop
Power BI Desktop ![]() Power BI service
Power BI service
On-object interaction is the new way to build and format a visual, directly on the visual in Power BI Desktop. It puts common actions for creating and formatting visuals on the visuals themselves, actions such as adding fields, changing visualization types, and formatting text.
Turn on preview features
Because the on-object feature is in preview, you need to turn it on.
In Power BI Desktop, select File > Options and settings > Options > Preview Features > On-object interaction.

Restart Power BI Desktop to see the new experience.

Choose a default pane arrangement
Starting with the December 2023 build, if you’ve used on-object before, the next time you start Power BI Desktop, you see this dialog asking which pane arrangement you prefer.
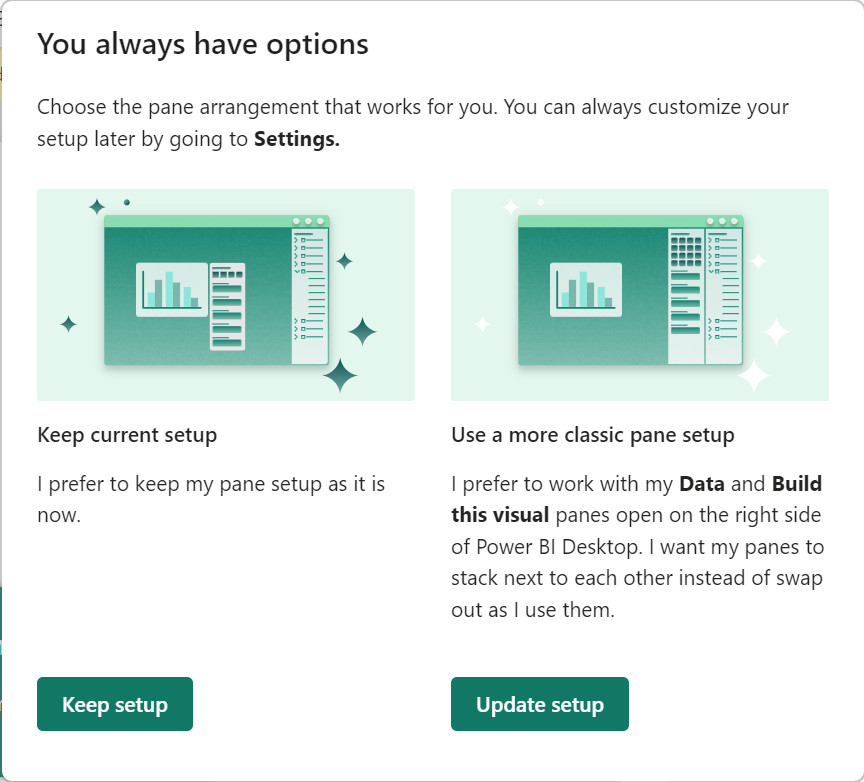
- Keep setup: Keeps the on-object pane setup.
- Update setup: Returns the panes to the right side of Power BI Desktop.
Change settings in the Options menu
If you change your mind, you can go back to the Options menu to customize the experience to suit your needs. To summarize, here’s the state of these settings for the new default setup, and an explanation of each of these options.
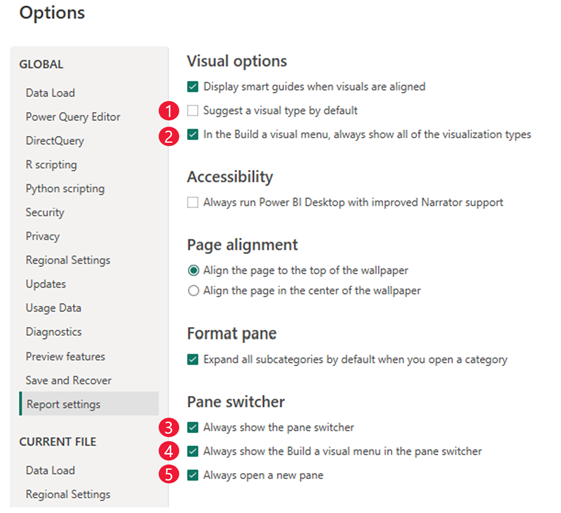
Suggest a type by default: If you don't want Power BI Desktop to suggest a visual, make sure this option isn't checked. All the field wells will always be expanded.
In the Build a visual menu, always show all the visualization types: Check this option to see all the visualization types shown by default in the Build menu.
Always show pane switcher: When you check this option, the right-hand pane switcher is shown even when you're not working with any panes. You always have access to the + menu and Settings icon.
Always show the Build a visual menu in the pane switcher: The Build menu moves from being next to the visual to the pane switcher on the right instead. Check this option if you prefer to work with the Build menu as a pane.
Always open a new pane: Instead of switching between panes, check this option if you prefer the stacking behavior as before. With this option on, a new pane opens side-by-side by default.
Multiselect in data flyout
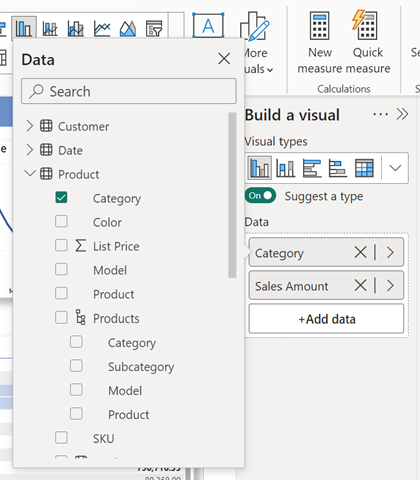
To cut down on extra clicks when you're adding data using the new Add data button, the data flyout now allows you to multiselect fields to add in bulk to your visual, just like in the data pane! Check all the fields you’d like to add to your visual at one time.
This option works best when Suggest a type is On, so you can add as many fields as you like and Power BI places the fields in the appropriate field wells for you.
In-product help
With the many changes to the on-object interaction, it can be hard to know where certain features have moved. These four teaching bubbles can help you along the way.
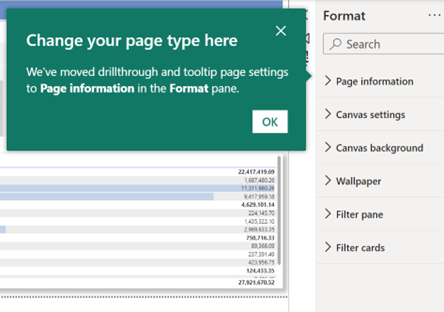
Where’s drillthrough and tooltip page setup?
A teaching bubble now points to the new location within Format > Page information.
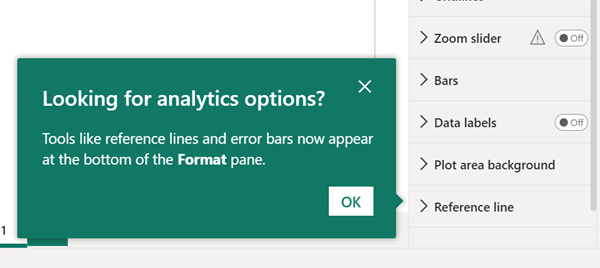
Where did the analytics pane go?
Analytics options like error bars, max, min, or percentile lines are consolidated in the Format pane at the bottom. You can set a max, min, or other reference line using the new Reference line card in the Format pane.
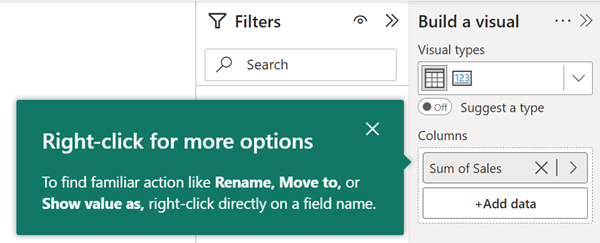
What happened to the right-click options for a field, like rename or Show value as?
They're still available on the right-click menu. Right-click the field name to see the same options as before.
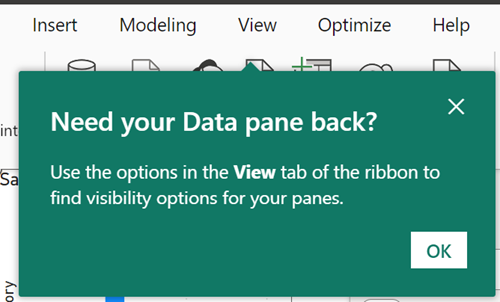
How do I bring back my data pane if the pane switcher is gone?
You can reopen a pane from the View tab in the ribbon.
Build a visual with on-object interaction
You can begin building a new visual in one of three ways.
Select or drag fields from the Data pane.
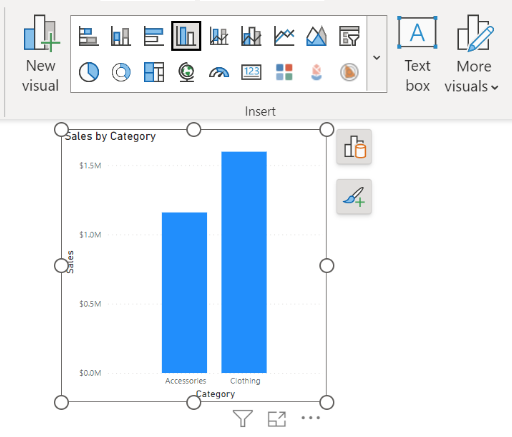
Select a new visual from the Insert section of the ribbon, and then add fields. If you have the ribbon collapsed, select Visual gallery > select a visual.
Right-click the canvas > Add visual or Paste.
You notice the Visualizations pane is no longer available, by design.
Note
Custom visuals are shown in the ribbon visualization gallery, along with the other visuals.
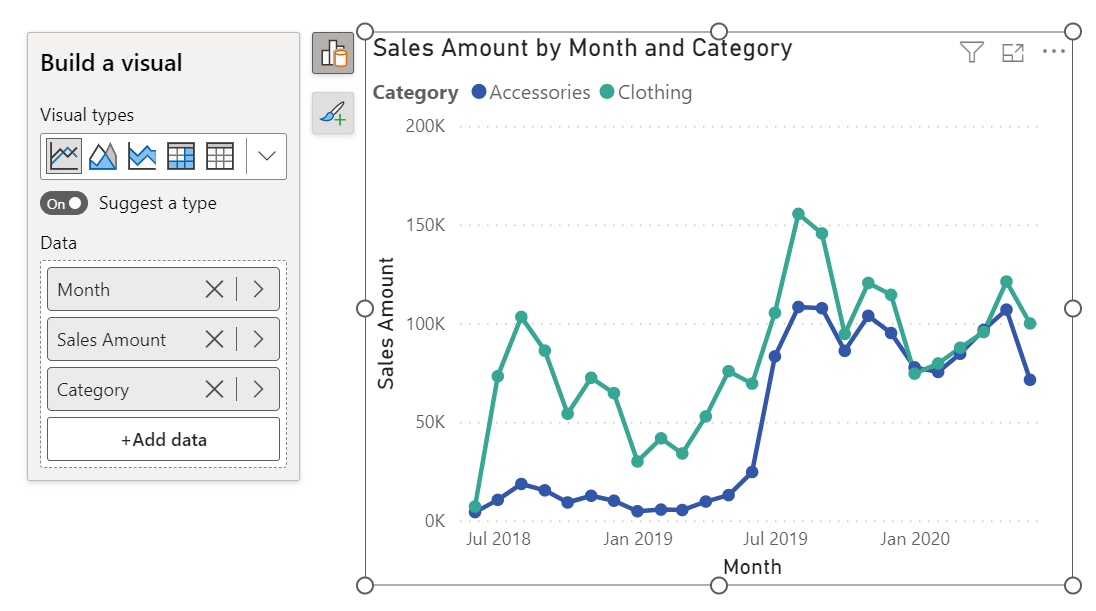
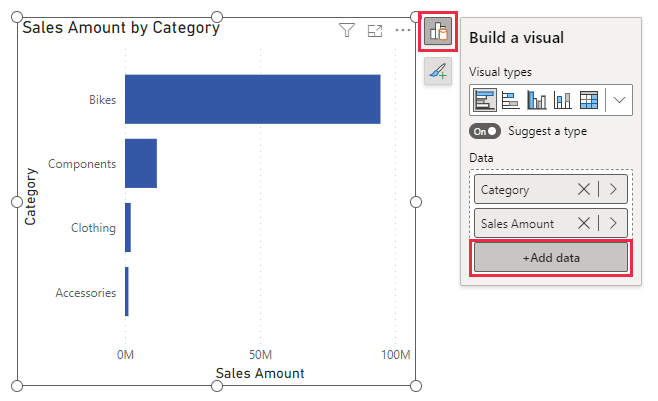
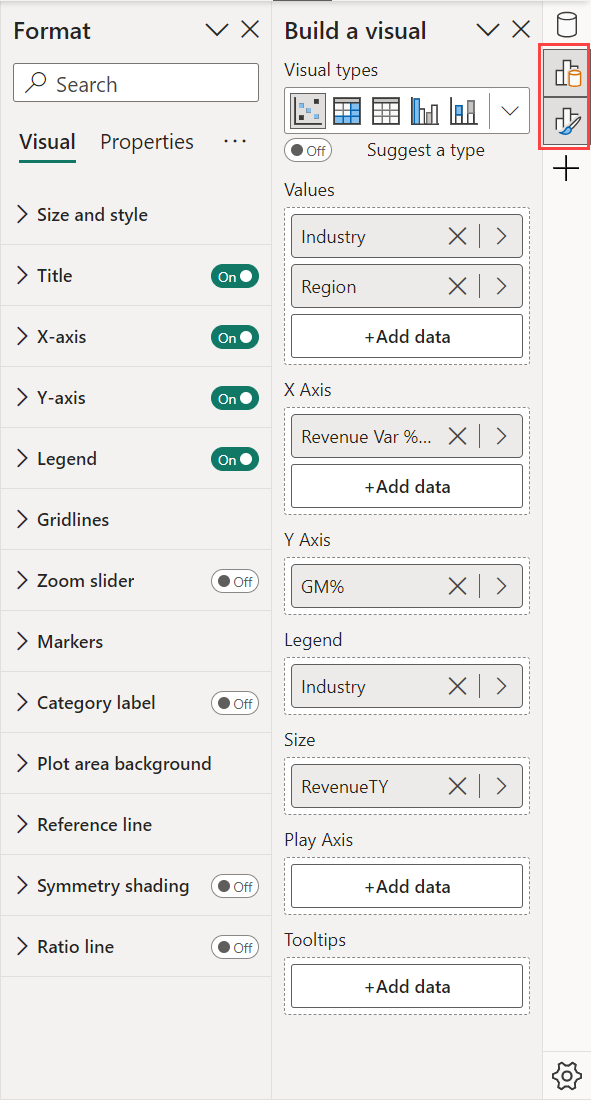
As you add fields, the visual type updates dynamically based on what Power BI believes is the best visual type for your data. If you want to change the visual type manually, select the Build a visual button and select a visual in the Visual types tray. Selecting a visual type yourself turns off the automatic Suggest a type toggle.
From this flyout menu, you can continue to add data. Select the Add data button and select fields from the Select data pane.
If you prefer to see all the field wells as before, turn off the Suggest a type toggle to expand the full Build a visual menu.
Tip
You can also turn this toggle off by default as well as pinning the full visualization gallery tray open. Select File > Options and settings > Options > Report settings, and clear the Suggest a visual type by default check box.
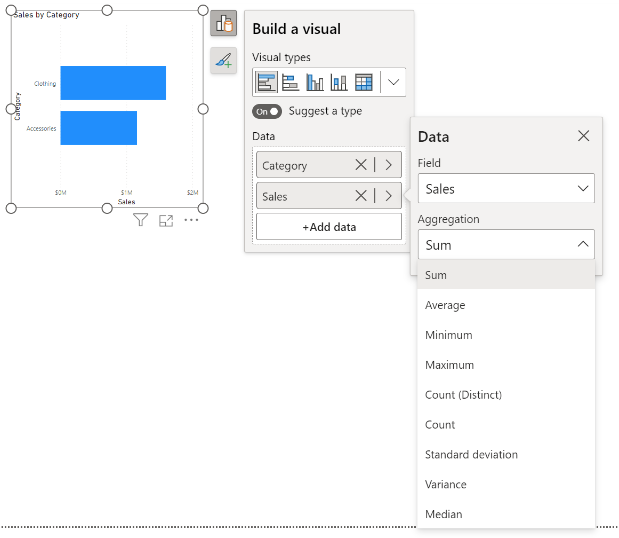
Add aggregations
After adding a data field to your visual, select the aggregation you want from the Aggregations dropdown.
Change the type of visual
You can also change the type of a visual. Select the visual, and in the ribbon visualization gallery, select a different visual.
Format a visual on-object
The default behavior when you hover over a visual is to see tooltips, and clicking around a visual, you get the cross-highlight and cross-filter effect. To avoid conflicting with this existing behavior, we introduced a new format mode. When you're in format mode, the hover and click behavior changes to show subselection regions.
You enter format mode in one of two ways:
- Double-click a visual.
- Right-click a visual > select Format.
You know you’re in this new mode when the bounding box turns blue, the handle shapes turn to squares, and the hover and click behavior changes to show subselection regions.
You can hover and click around in the visual to format specific subselections. Right-click the selected element to use the mini-toolbar and shortcut menu.

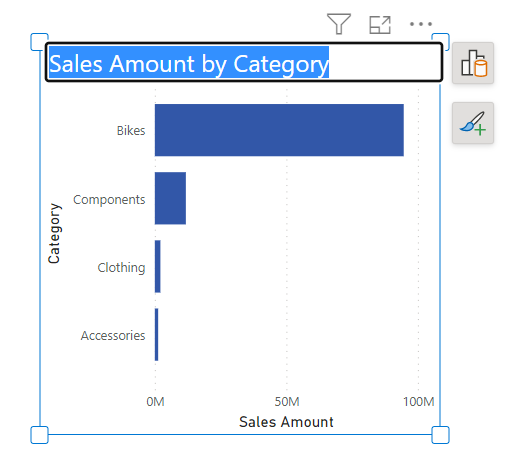
Edit labels and titles
You can edit labels and titles on visuals directly. Double-click the label you’d like to edit and begin typing. Click away from the label, or press Enter to save your changes.
Note
If you set the title or label by conditional formatting, it's possible to override the text with this new feature. It's a known issue we're working to block, and warn users that dynamic text takes precedence.
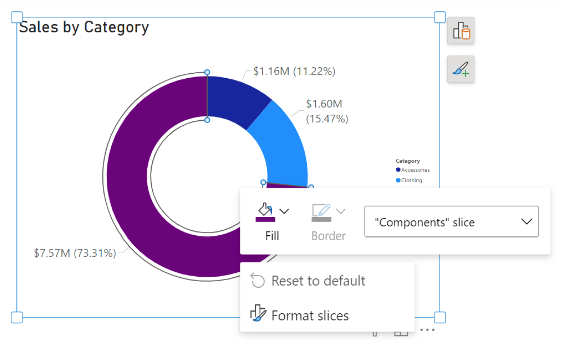
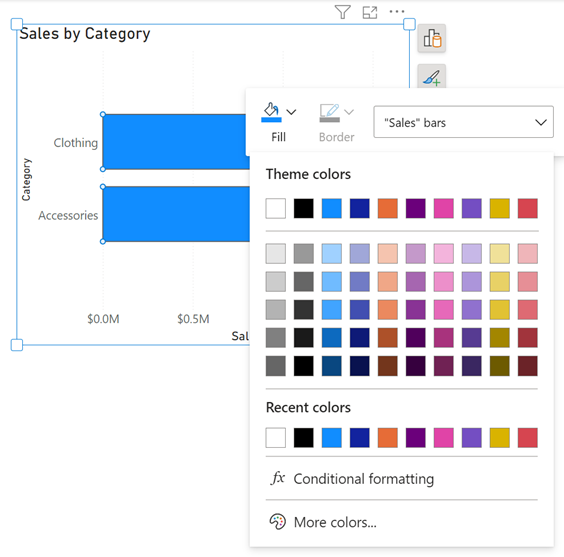
Format colors
In the Format pane > Colors, select the color you want to use. You can also choose to use Conditional formatting to color visual elements.
Selecting overlapping elements
When selecting an element that's very close or overlapping another, Power BI takes the best guess at your selection. If the selection is incorrect, right-click and use the dropdown menu to change your selection to the element you’d like to format.

Format multiple visuals at once
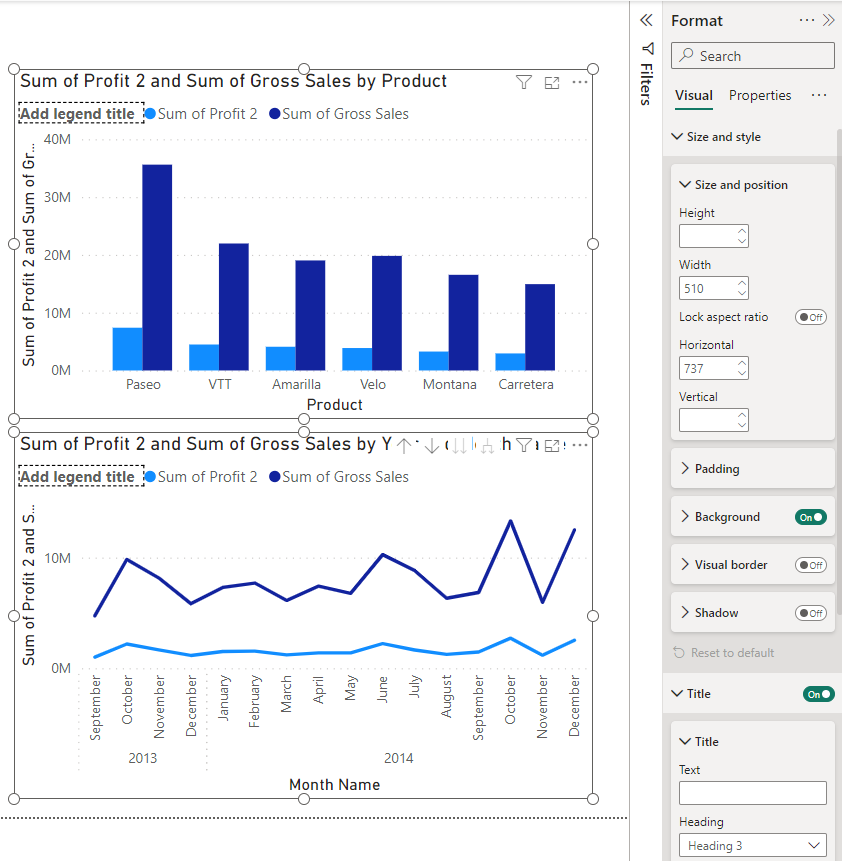
You can now format containers for more than one visual at a time. When you multi-select different visuals, Power BI has added formatting support for container formatting such as changing the size, background color, adding a shadow, or turning on or off titles in bulk.
When you multi-select different visual types, such as a line chart and bar chart, you see Size and style and Title in the Visual section of the Format pane.
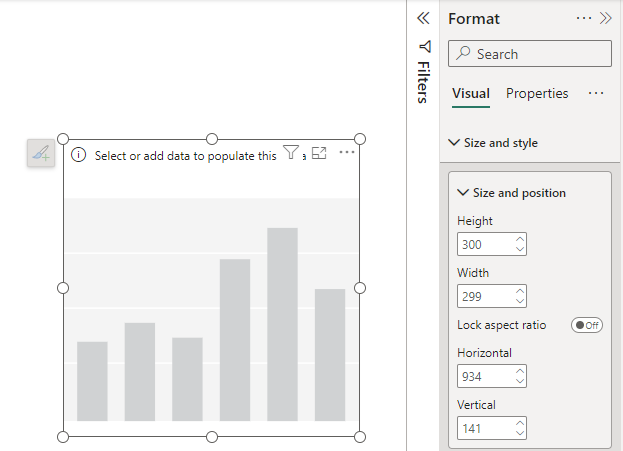
Format an empty visual
You can also format the size and position of a visual before you add any data to it.
Attach the build menu to the pane switcher
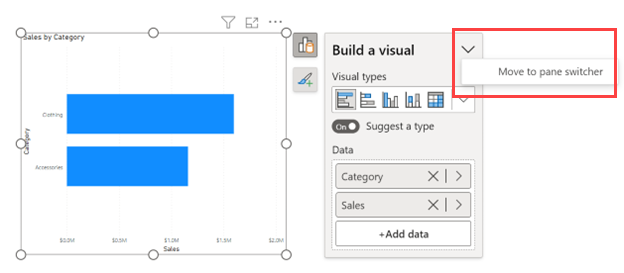
You can attach the build menu to the pane switcher, if you'd prefer that. Pick one of these three different ways to attach it:
Select the drop-down arrow on the Build a visual pane > Move to pane switcher.
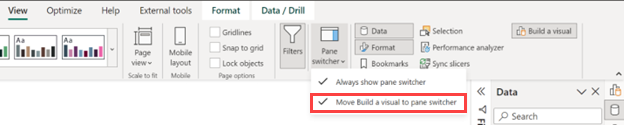
On the View ribbon, select Move Build a visual to pane switcher.
On the File menu, select Options and settings > Options > Report settings. Select Always show Build a visual menu in the pane switcher.
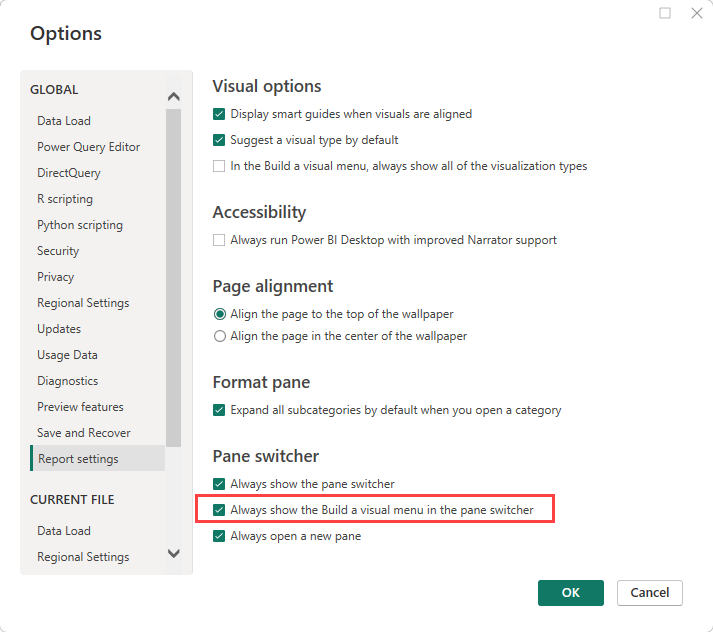


With the View ribbon and the Options dialog, you can choose to Always show the pane switcher.
Customize the pane switcher
With the new plus (+) button on the pane switcher, you can quickly add new panes directly from the pane switcher without having to go to the View ribbon. This menu also gives a brief description of what panes are available and what their functions are. Adding panes to the switcher saves them across reports.
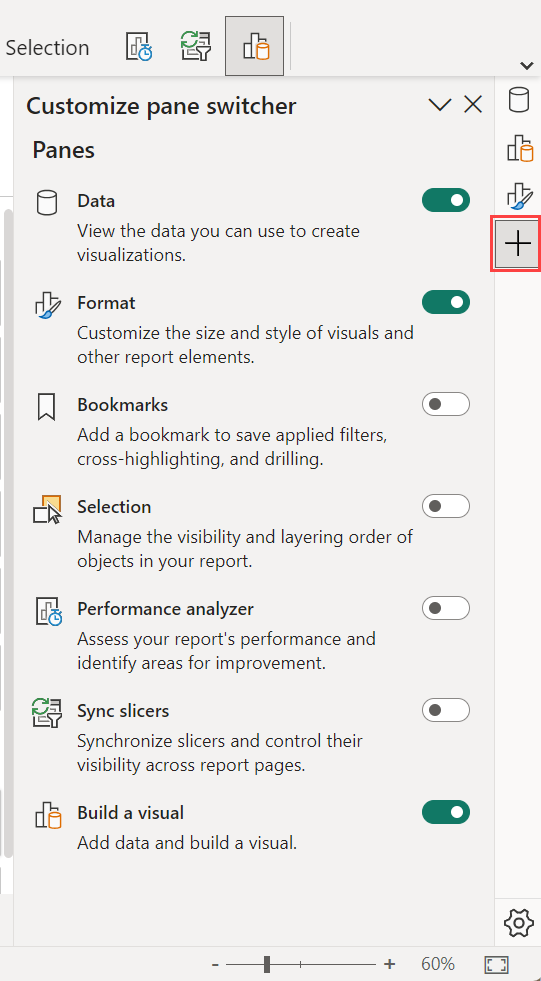
Select the gear icon and select the three preference settings:
- Always show the pane switcher
- Always show the "Build a visual" menu in the pane switcher
- Always open in a new pane

Show more than one pane at a time
There are a few ways to have multiple panes open at the same time:
- Select CTRL and select another pane in the pane switcher.
- Right-click an unselected pane and select Open in new pane.
- You can also Customize the pane switcher settings so that you Always open a new pane.
Limitations and known issues
Supported visuals for on-object formatting
- On-object formatting is currently supported for bar, column, line, area, combo, scatter, card, pie, donut, tree map, and table visuals. Small multiples aren't currently supported.
- Format mode isn't currently supported in mobile layout.
- Format mode isn't currently supported in focus mode.
Subselections
- Small multiples and analytics pane items aren't currently selectable in format mode.
- Subselection regions don't scale as expected in spotlight mode and after using zoom sliders.
- Reset to default might not reset direct text edit and background colors for data and category labels.
On-object buttons
- On-object buttons might show above the formula bar if they're open at the same time.
Warnings
- If you set the title or label by conditional formatting, it's possible to override the text with the new direct text editing feature. It's a known issue we're working to block, and warn users that dynamic text takes precedence.
- While responsive is on, the mini-toolbar will increase to the responsive upper bound, then stop. It might appear as a bug that it’s broken. We plan to add an error state to communicate this.
Custom visuals
We plan to release an API for custom visual developers to be able to define subselection regions within their visuals.
Accessibility
- Full accessibility isn't currently supported.
Related content
More questions? Try the Power BI community