Note
Access to this page requires authorization. You can try signing in or changing directories.
Access to this page requires authorization. You can try changing directories.
The fetchMoreData API lets you load data chunks of different sizes as a way of enabling Power BI visuals to bypass the hard limit of a 30K row data view. In addition to the original approach of aggregating all requested chunks, the API now also supports loading data chunks incrementally.
You can configure the number of rows to fetch at a time in advance, or you can use dataReductionCustomization to allow the report author set the chunk size dynamically.
Note
The fetchMoreData API is available in version 3.4 and above.
The dynamic dataReductionCustomization API is available in version 5.2 and above.
To find out which version you’re using, check the apiVersion in the pbiviz.json file.
Enable a segmented fetch of large semantic models
Define a window size for dataReductionAlgorithm in the visual's capabilities.json file for the required dataViewMapping. The count determines the window size, which limits the number of new data rows that you can append to the dataview in each update.
For example, add the following code in the capabilities.json file to append 100 rows of data at a time:
"dataViewMappings": [
    {
        "table": {
            "rows": {
                "for": {
                    "in": "values"
                },
                "dataReductionAlgorithm": {
                    "window": {
                        "count": 100
                    }
                }
            }
    }
]
New segments are appended to the existing dataview and provided to the visual as an update call.
Using fetchMoreData in the Power BI visual
In Power BI, you can fetchMoreData in one of two ways:
- segments aggregation mode
- incremental updates mode
Segments aggregation mode (default)
With the segments aggregation mode, the data view that is provided to the visual contains the accumulated data from all previous fetchMoreData requests. Therefore, the data view size grows with each update according to the window size. For example, if a total of 100,000 rows are expected, and the window size is set to 10,000, then the first update data view should include 10,000 rows, the second update data view should include 20,000 rows, and so on.
Select the segments aggregation mode by calling fetchMoreData with aggregateSegments = true.
You can determine whether data exists by checking for the existence of dataView.metadata.segment:
    public update(options: VisualUpdateOptions) {
        const dataView = options.dataViews[0];
        console.log(dataView.metadata.segment);
        // output: __proto__: Object
    }
You also can check to see whether the update is the first update or a subsequent update by checking options.operationKind. In the following code, VisualDataChangeOperationKind.Create refers to the first segment and VisualDataChangeOperationKind.Append refers to subsequent segments.
// CV update implementation
public update(options: VisualUpdateOptions) {
    // indicates this is the first segment of new data.
    if (options.operationKind == VisualDataChangeOperationKind.Create) {

    }

    // on second or subsequent segments:
    if (options.operationKind == VisualDataChangeOperationKind.Append) {

    }

    // complete update implementation
}
You also can invoke the fetchMoreData method from a UI event handler:
btn_click(){
{
    // check if more data is expected for the current data view
    if (dataView.metadata.segment) {
        // request for more data if available; as a response, Power BI will call update method
        let request_accepted: bool = this.host.fetchMoreData(true);
        // handle rejection
        if (!request_accepted) {
            // for example, when the 100 MB limit has been reached
        }
    }
}
As a response to calling the this.host.fetchMoreData method, Power BI calls the update method of the visual with a new segment of data.
Note
To avoid client memory constraints, Power BI limits the fetched data total to 100 MB. When this limit is reached, fetchMoreData() returns false.
Incremental updates mode
With the incremental updates mode, the data view that is provided to the visual contains only the next set of incremental data. The data view size is equal to the defined window size (or smaller, if the last bit of data is smaller than the window size). For example, if a total of 101,000 rows are expected and the window size is set to 10,000, the visual would get 10 updates with a data view size of 10,000 and one update with a data view of size 1,000.
The incremental updates mode is selected by calling fetchMoreData with aggregateSegments = false.
You can determine whether data exists by checking for the existence of dataView.metadata.segment:
    public update(options: VisualUpdateOptions) {
        const dataView = options.dataViews[0];
        console.log(dataView.metadata.segment);
        // output: __proto__: Object
    }
You also can check if the update is the first update or a subsequent update by checking options.operationKind. In the following code, VisualDataChangeOperationKind.Create refers to the first segment, and VisualDataChangeOperationKind.Segment refers to subsequent segments.
// CV update implementation
public update(options: VisualUpdateOptions) {
    // indicates this is the first segment of new data.
    if (options.operationKind == VisualDataChangeOperationKind.Create) {

    }

    // on second or subsequent segments:
    if (options.operationKind == VisualDataChangeOperationKind.Segment) {

    }

    // skip overlapping rows
    const rowOffset = (dataView.table['lastMergeIndex'] === undefined) ? 0 : dataView.table['lastMergeIndex'] + 1;

    // Process incoming data
    for (var i = rowOffset; i < dataView.table.rows.length; i++) {
        var val = <number>(dataView.table.rows[i][0]); // Pick first column

     }

    // complete update implementation
}
You also can invoke the fetchMoreData method from a UI event handler:
btn_click(){
{
    // check if more data is expected for the current data view
    if (dataView.metadata.segment) {
        // request for more data if available; as a response, Power BI will call update method
        let request_accepted: bool = this.host.fetchMoreData(false);
        // handle rejection
        if (!request_accepted) {
            // for example, when the 100 MB limit has been reached
        }
    }
}
As a response to calling the this.host.fetchMoreData method, Power BI calls the update method of the visual with a new segment of data.
Note
Although the data in the different updates of the data views are mostly exclusive, there's some overlap between consecutive data views.
For table and categorical data mapping, the first N data view rows can be expected to contain data copied from the previous data view.
N is determined by: (dataView.table['lastMergeIndex'] === undefined) ? 0 : dataView.table['lastMergeIndex'] + 1
The visual keeps the data view passed to it so it can access the data without extra communications with Power BI.
Customized data reduction
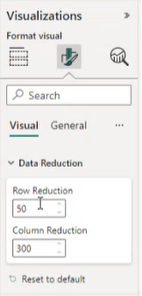
Since the developer can't always know in advance what type of data the visual will display, they might want to allow the report author to set the data chunk size dynamically. From API version 5.2, you can allow the report author to set the size of the data chunks that are fetched each time.
To allow the report author to set the count:
Define a formatting object property called
dataReductionCustomizationin your capabilities.json file:"objects": { "dataReductionCustomization": { "properties": { "rowCount": { "type": { "numeric": true } }, "columnCount": { "type": { "numeric": true } } } } },Insert the following code fragment into the formatting settings file:
class DataReductionCardSettings extends FormattingSettingsCard {
    rowCount = new formattingSettings.NumUpDown({
        name: "rowCount",
        displayName: "Row reduction",
        description: "Show Reduction for all row groups",
        value: 100,
    });

    columnCount = new formattingSettings.NumUpDown({
        name: "columnCount",
        displayName: "Column reduction",
        description: "Show Reduction for all column groups",
        value: 10,
   });

    name = "dataReductionCustomization";
    displayName = "Data Reduction";
    slices = [this.rowCount, this.columnCount];
}
After the
dataViewMappings, definedataReductionCustomizationas:"dataReductionCustomization": { "matrix": { "rowCount": { "propertyIdentifier": { "objectName": "dataReductionCustomization", "propertyName": "rowCount" }, }, "columnCount": { "propertyIdentifier": { "objectName": "dataReductionCustomization", "propertyName": "columnCount" }, } } }
The data reduction information appears under visual in the format pane.
Considerations and limitations
- The window size is limited to a range of 2-30,000.
- The data view total row count is limited to 1,048,576 rows.
- The data view memory size is limited to 100 MB in segments aggregation mode.
- The dataReductionCustomization row count is limited to a range of 15-30,000
- The dataReductionCustomization columns count is limited to a range of 1-2,000