Accessibility features in paginated reports (Power BI Report Builder)
APPLIES TO: ![]() Power BI Report Builder
Power BI Report Builder ![]() Power BI Desktop
Power BI Desktop
You can create paginated reports with accessibility. Power BI Report Builder has accessibility features that help you create a paginated report that's inclusive and usable by all. As a report creator, it's important to know these features and their functionalities to use them in making your paginated reports accessible to people who are blind, have low vision, or have physical disabilities. Designing your report for accessibility doesn't just benefit users with disabilities. It benefits everyone because it improves the usability of your report.
This article provides details on the accessibility features in Power BI Report Builder for creating accessible paginated reports.
Types of accessibility features
The Power BI Report Builder has various accessibility features available to the report creator, these features are categorized into three categories as follows:
- Built-in accessibility features (no configuration required).
- Built-in accessibility features (requiring configuration).
- Other tips and considerations.
The following sections describe these categories in detail.
Built-in accessibility features
These features have been built into Power BI Report Builder and don't require any configuration from the report author. These features include the following:
Let's explore each of these built-in accessibility features individually.
Keyboard navigation
As a report author, you can operate Power BI Report Builder by using the keyboard for navigation. Your paginated report consumers can also efficiently use their keyboards to navigate through a report and interact with the various objects of a paginated report. This functionality is in line with WCAG guidelines of operability, and it creates an accessible user experience for reporting consumers with disabilities.
By pressing the Alt key, you can see the keyboard shortcuts for the different menus for Power BI Report Builder. Here's the detailed list of keyboard shortcuts for Power BI Report Builder.
Note
Keyboard navigation for accessibility is partially supported. You can't use the cancel button in the loading dialog.
Screen–reader compatibility
Power BI Report Builder is screen-reader compatible. As a user navigates to any object on the app, the screen reader converts all the text into spoken words. As a report author, you can use a screen reader to create a paginated report. When you hover over any of the app menus, the screen reader reads the property description shown.
Accessible PDF export format in the service for report consumers
As a report creator, it's important to recognize that there are two PDF formats available for exporting paginated reports from the Power BI service:
- Standard PDF format.
- Accessible PDF format.
The Accessible PDF is a feature in the service for the report consumer. It isn't supported in Power BI Report Builder. The Accessible PDF format provides support for PDF/UA in conformance to the ISO 14289-1(PDF/UA) requirements for universally accessible PDF documents.
PDF/UA specifies the technical requirements for assistive technology such as screen readers to fully interact with PDF documents. Adhering to these requirements helps in creating a universally accessible PDF/UA document, which a person with disabilities can make use of just as effectively as any user without disabilities.
One of the key requirements of the PDF/UA is to create documents that are tagged, and the structure tree created by the document tags must reflect the document’s logical reading order. The ordinary PDF export format of paginated report isn't tagged, so it's important that you select the Accessible PDF export option when you export your paginated report to PDF.
Screen-reader preview of the Structure Tree of an Accessible PDF paginated report
The PDF Accessibility Checker (PAC Tool) is a digital tool for validating that a PDF document is in full compliance with PDF/UA. After exporting your Accessible PDF report document, use this tool to make sure your PDF document is compliant with PDF/UA, and make appropriate adjustments if the tool detects errors.
Note
The Accessible PDF isn't in full conformance to ISO 14289-1(PDF/UA). For detailed documentation, see PDF Rendering Extension conformance to ISO 14289-1: paginated reports.
When you create a well formatted Accessible PDF paginated report based on accessibility requirements, you still get an error from the PAC tool stating that the PDF/UA identifier is missing. The PDF/UA identifier isn't automatically written on the Accessible PDF, because there’s no guarantee that the report creator has taken the necessary steps to ensure that the PDF is in full compliance with PDF/UA.
To correct this error, you need to add the appropriate PDF/UA identifier to your Accessible PDF to indicate that you've done the necessary work to make the PDF entirely PDF/UA compliant. You add the identifier by using Adobe Acrobat Pro, as described in the article ACCESSIBLE PDFs: How to Add a PDF/UA Identifier.
Built-in accessibility features requiring configuration
This section identifies and discusses accessibility features that are built into Power BI Report Builder and require configuration by the report author. These features include the following:
- Set row and text box properties.
- Provide Alt text.
- Set color contrast.
Set row and text box properties
Report authors and report consumers benefit from having accessibility tagging for tables, matrixes and text box properties in paginated reports. Report authors can enable headings for text box properties, and column headers for row properties in just a few clicks in Power BI Report Builder. When you add this tagging to a row property or a text box property, you provide a better report navigation user experience for report consumers who use screen-readers.
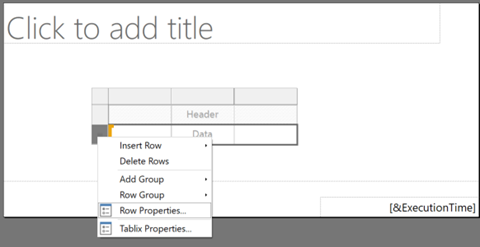
Enable row properties on a header or data cell
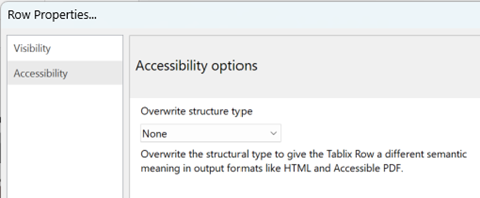
To enable row properties on a header or data cell, right-click a table row and select Row properties.
Select the Accessibility menu, and decide which structure type you wish to overwrite.
Enable text box properties
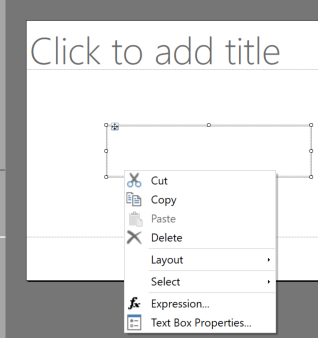
To enable text box properties, right-click a text box and select Text Box Properties.
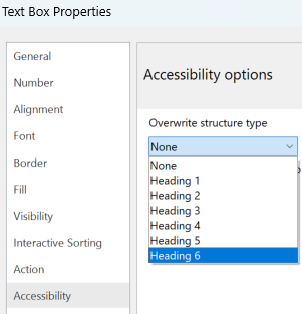
Select the Accessibility menu and decide which structure type you wish to overwrite. You can add tags for Heading H1-H6 to give the textbox a different semantic meaning in output formats like HTML and Accessible PDF.
Provide Alt text
Alt text, which is short for alternative text, is used to describe every object in the paginated report. As a report author you need to provide Alt text for every object in your report, including tables, matrixes, charts, images, and text boxes. Providing Alt text for report objects helps a report consumer who's using a screen reader or other assistive technology to understand what you're trying to communicate regarding that report object, even if they can't see the object.
To provide Alt text for an object in the Power BI Report Builder, select the object. In the Properties pane, select the Tooltip property, and type in the tooltip text in the property grid.
Be sure to use descriptive Alt text for your report objects. Make sure the texts are clear, descriptive, and free of abbreviations, making it easier for the screen reader to read. Descriptive Alt text helps ensure your report is more understandable to the end user, which is in alignment with one of the WCAG principles.
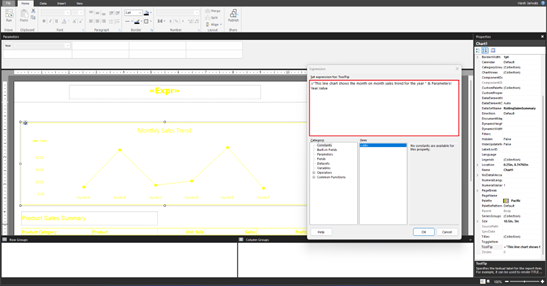
In Power BI paginated reports, data visualization components are interpreted as images. It's important to add Alt texts that describe your chart and the information you’re trying to convey. For example, here are the steps for writing Alt text for a line chart.
Select the line chart, and in the Properties pane, select the Tooltip property.
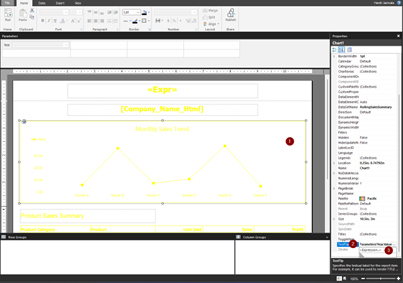
Select Expression from the drop-down options, then write the Alt text you want to use.
The following image shows how the Alt text appears in the report. A screen reader reads the Alt text, providing the description of the image to people who are blind and people with other physical disabilities.
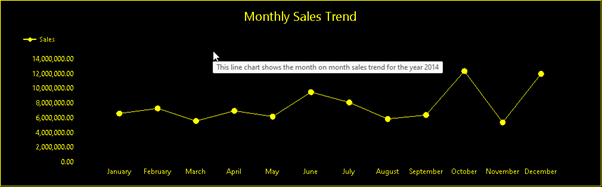
Note
A screen reader doesn't read the Alt texts in Power BI Report Builder, but the screen reader does read the Alt text in the Power BI service and Accessible PDF. However, screen readers don't read out Alt texts for text boxes in the Power BI service.
Set color contrast
When you're designing your report for accessibility, pairing a light color and dark color provides the right color contrast to make your report more accessible. They should be enough contrast between text or object and any background color according to the WCAG guidelines. The WCAG 2.1 success criterion 1.4.3 delineates that text and background color should have a contrast ratio of at least 4.5:1.
Unlike for Power BI reports, when you use high contrast mode in Windows, the high contrast theme isn't automatically applied to your report, so you must choose high contrast colors for your report.
You can design your report and then check your report colors for accessibility. Here are some external tools you can try:
Another option is to use an Accessible color palette generator such as the Venngage Accessible Color Palette Generator to generate accessible colors you can then choose from to use in your report.
Apply colors to report objects
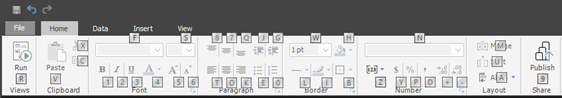
To apply colors to your report objects, select the object. In the Properties pane, choose the color you want for the format option, such as the fonts, background, and border.
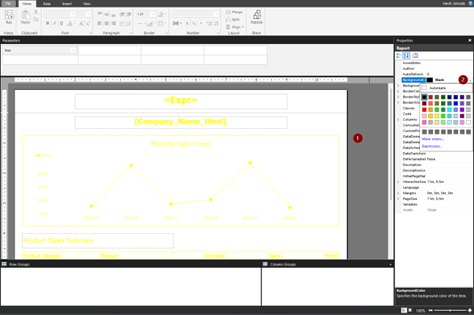
The following image uses black for formatting the report background, and yellow for formatting every other element in the report.

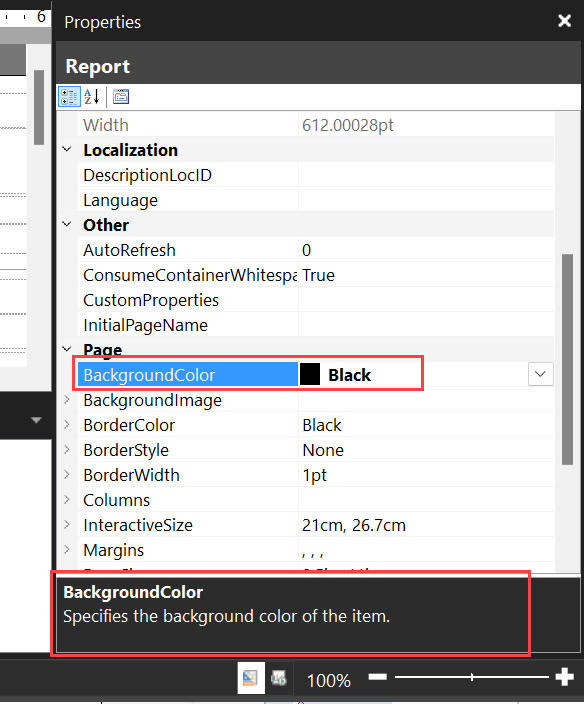
To achieve the black background for the body, select the body. In the Properties pane, under the formatting options select the drop-down for background color and pick the black color.
The following image shows the result of the black background formatting.
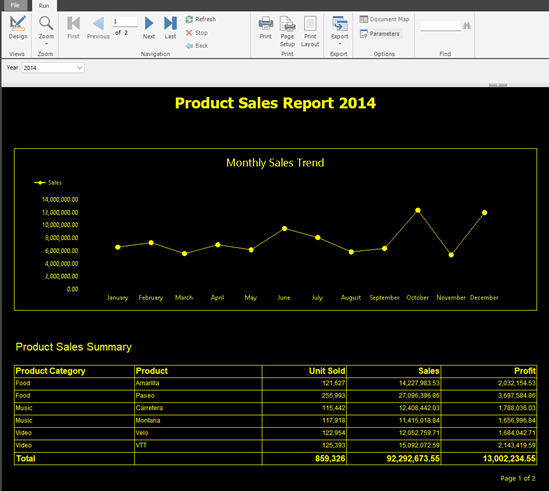
The other report objects have yellow formatting, following the same steps as above. You can also apply colors to an object by writing the hex code of the color on the color format option in the Properties pane.
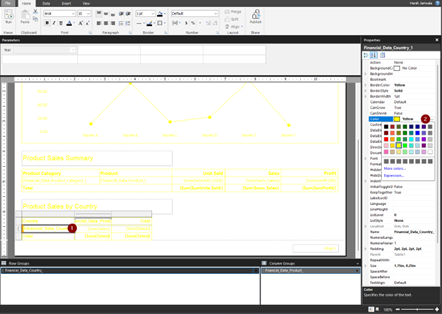
Steps for color formatting a matrix
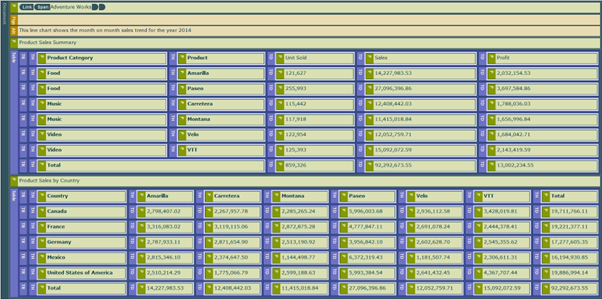
This image shows how the color yellow is applied to a matrix by selecting cells in the matrix and selecting Font color and BorderColor set to Yellow.
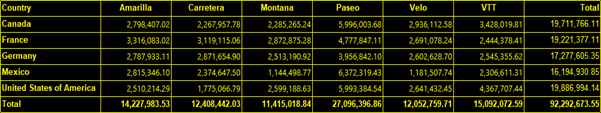
You see the result of the formatting in the following image.
Tips and considerations
Here are some tips and considerations to help when you're creating accessible paginated reports.
Provide table caption/summary
Creating a table caption or summary provides context on the information displayed in the table. You can add the caption by using the Tooltip property. It provides the perfect summary of the information that the table is conveying for screen reader users.
Note
The WCAG 2.0 guideline 1.3.1 Info and Relationships is partially supported as Tables contain an extra blank row and column to ensure correct row heights and column widths. This guideline ensures that structures can be programmatically determined and the logical relationship among the table headers and data cells is preserved.
Tagging elements
You can insert HTML-formatted text from a field in your dataset into your paginated report by using a text box.
An example of a supported HTML tag is a hyperlink. The following images show the steps required to adding a hyperlink of a company website to the report. The screen reader reads it out, letting the user know it’s a link that can take them to a website that provides more information on the company.
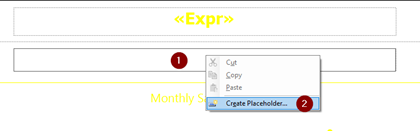
To add a hyperlink, first create a text box.
Right-click in the text box, and select Create Placeholder.
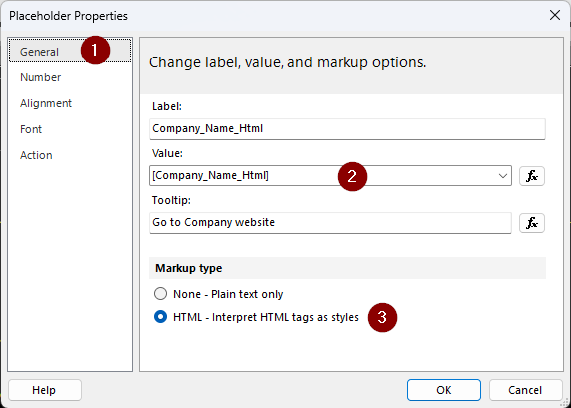
In the Placeholder Properties dialog box, on the General tab, provide the placeholder in the label.
In the Value box, provide the field from the dataset that contains HTML tags.
In the Tooltip box, write your Alt text.
The following image shows how the hyperlink and Alt text appear in the report.

For detailed documentation on using HTML, see Importing HTML into a paginated report (Report Builder).
Add a descriptive header to a table
Using descriptive table headers makes the data in the table more understandable. These headers become readable by the screen reader used by the report consumer. The headers are tagged in the PDF. The following image shows what the tree structure of a table looks like, and shows the logical structure of the table in the PAC tool. The table structure contains Table Row (TR) and Table Data Cell (TD) structures in proper reading order and hierarchy.

Note
For tables not built with the Power BI Report Builder table wizard, the table headers in Accessible PDF documents are tagged as the Table Data cells (TD). To correct this, open the file on Adobe Acrobat Pro. On the Tags tab, select each of the header cells and change the tags from Table Data (TD) to Table Headers (TH). You can find detailed description of how to modify table tags on the W3C website.
Add descriptive header to a matrix
When creating your matrix object for displaying data summaries, it's important to use descriptive headers to make the information that the matrix is conveying more understandable. This way the screen reader can describe the columns and rows in an understandable way. The following image shows the logical structure of a matrix in the PAC tool. The matrix structure contains the Table Header (TH), Table Row (TR) and Table Data Cell (TD) structures in proper reading order and hierarchy.

Note
For a matrix built with the Power BI Report Builder wizard, the column label for the first column is tagged as a Table Header (TH). This results in an error in the PAC tool, stating that the Table header has no associated subcells. To correct this, open the file in Adobe Acrobat Pro. On the Tags tab select the cell and change the tag from Table Header (TH) to Table Data Cell (TD). You can find a detailed description of how to modify table tags in the W3C website.
Use consistent formatting
You can achieve consistent report formatting across different report objects.
- Hold down the Ctrl key and select the report objects that you'd like to have consistent formatting.
- In the Properties pane, select each format option and select the format you'd like to apply. Whatever format you choose applies to all selected objects, giving it a consistent formatting.
Related content
Feedback
Coming soon: Throughout 2024 we will be phasing out GitHub Issues as the feedback mechanism for content and replacing it with a new feedback system. For more information see: https://aka.ms/ContentUserFeedback.
Submit and view feedback for