Note
Access to this page requires authorization. You can try signing in or changing directories.
Access to this page requires authorization. You can try changing directories.
Calculation groups can significantly reduce the number of redundant measures you have to create, by allowing you define Data Analysis Expressions (DAX) formulas as calculation items. Calculation items can be applied to existing measures in your model. More information about calculation groups is available in the Calculation groups article.
Add a new calculation group in model view
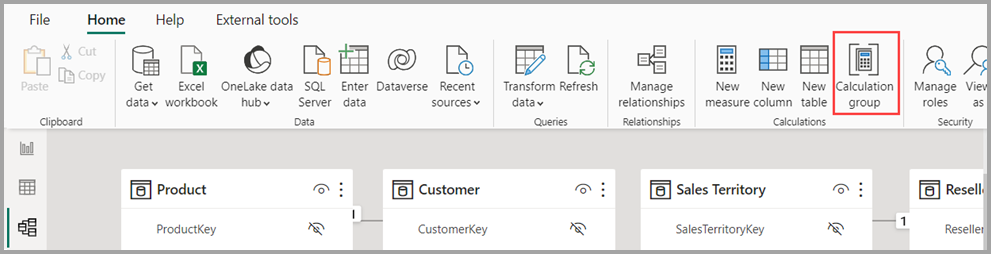
In Power BI, when editing a semantic model, navigate to Model view and select the Calculation group button in the ribbon. If you're not already in Model explorer, the Data pane opens to the Model view.
If the discourage implicit measures property is turned off, you're prompted with a dialog window to turn it on to enabling creation of the calculation group.
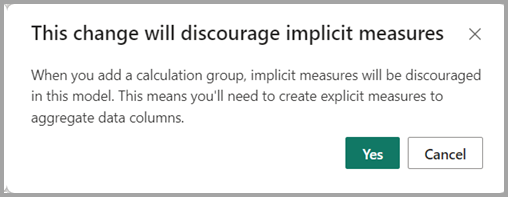
An implicit measure occurs when, in the Report view, you use a data column from the Data pane directly in the visual. The visual allows you to aggregate it as a SUM, AVERAGE, MIN, MAX, or some other basic aggregation, which becomes an implicit measure. When a calculation group is added to a model, Power BI discourages the creation of implicit measures by no longer showing the summation symbol next to the data columns in the Data pane, and blocks adding the data columns to the visuals directly as values. Existing implicit measures already created in visuals continue to work. The Discourage implicit measures property must be enabled because calculation items don't apply to implicit measures. Calculation items only apply to measures or explicit measures.

A measure or explicit measure occurs when you create a New measure and define the DAX expression to aggregate a data column. Explicit measures can also have conditional logic and filters, taking full advantage of what you can do with DAX. Tutorial: You can learn how to Create your own measures in Power BI Desktop.
Note
Calculation item expressions can be written to ignore a measure by the name, or by data type, for scenarios when you have measures you don't want the calculation item to change.
Once you select Yes to enable the discourage implicit measures property, a calculation group is added and you can start defining the DAX expression of the first calculation item in the DAX formula bar. The dialog won't show if you already have discourage implicit measures enabled.
SELECTEDMEASURE is a DAX function that acts as a placeholder for the measure in the calculation item expression. You can learn about the SELECTEDMEASURE DAX function from its article.

Add a calculation group by using Power BI TMDL view
You can create a calculation group in the Tabular Model Definition Language or TMDL view of Power BI Desktop. Edit the semantic model and use this TMDL script.
createOrReplace

	table 'Calculation group'

		calculationGroup
			precedence: 1

			calculationItem 'Calculation item' = SELECTEDMEASURE()

		column 'Calculation group column'
			dataType: string
			summarizeBy: none
			sourceColumn: Name
			sortByColumn: Ordinal

			annotation SummarizationSetBy = Automatic

		column Ordinal
			dataType: int64
			formatString: 0
			summarizeBy: sum
			sourceColumn: Ordinal

			annotation SummarizationSetBy = Automatic
Time intelligence example
There's a Time Intelligence example of a calculation group available at in the Calculation groups in Analysis Services tabular models article, which we can use to populate some calculation items. The example can be added to any model with a Date table, or you can download the Adventure Works DW 2020 PBIX from DAX sample model - DAX.
Rename a calculation group
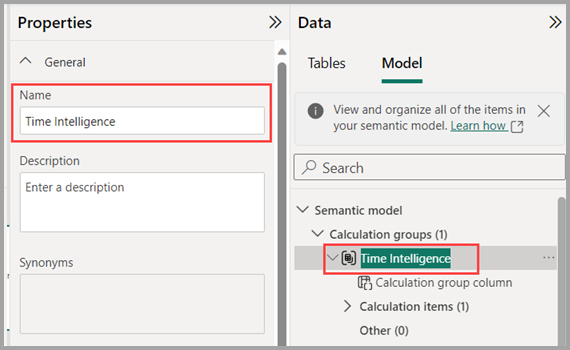
To rename the calculation group, double-click it in the Data pane, or you can select it and use the Properties pane.
Rename a calculation group column
To rename the calculation group column, double-click it in the Data pane, or you can select it and use the Properties pane. The column you select is the column you use on visuals or in slicers to apply a specific calculation item.
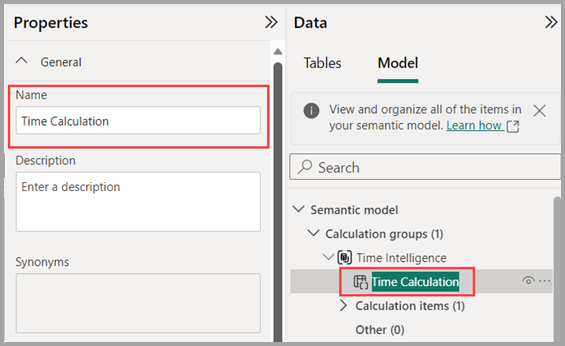
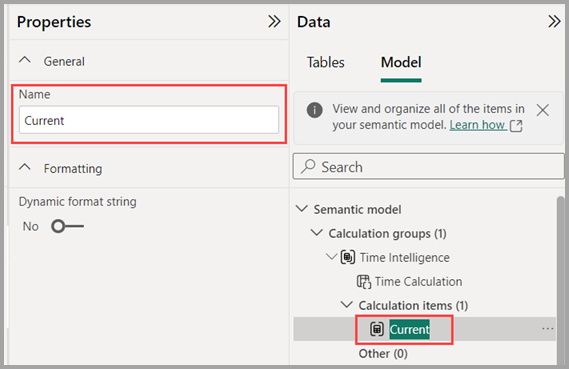
Rename a calculation item
The first calculation item was created as SELECTEDMEASURE() so it can be renamed by double-clicking or using the Properties pane as well.
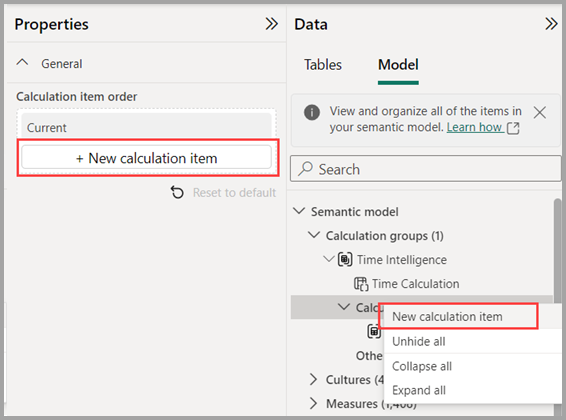
Create more calculation items
To create more calculation items, you can use the right-click context menu of the Calculation items section or the calculation group itself and choose New calculation item, or use the Properties pane of the Calculation items section.
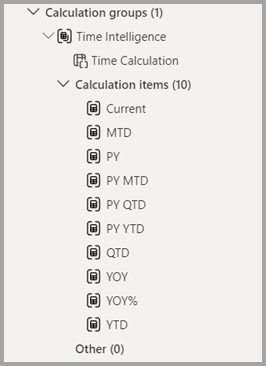
Once all the Time intelligence calculation items are added, the calculation group looks like the following image.
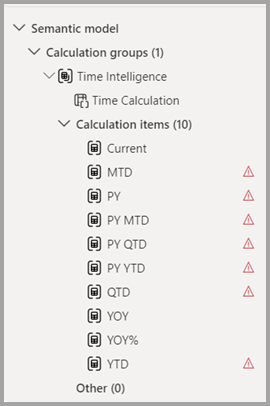
Notice the red triangle icons indicating errors. The errors are there because the example DAX expressions use the Date table called DimDate, so I need to update the DAX expressions to use the name Date instead. The following image shows the DAX expression before the correction.
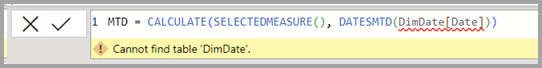
Once I make the correction to the DAX expression, the error disappears.

Once I make the corrections for each of the errors in the calculation items, the red triangle warning icons no longer appear.
Reorder calculation items
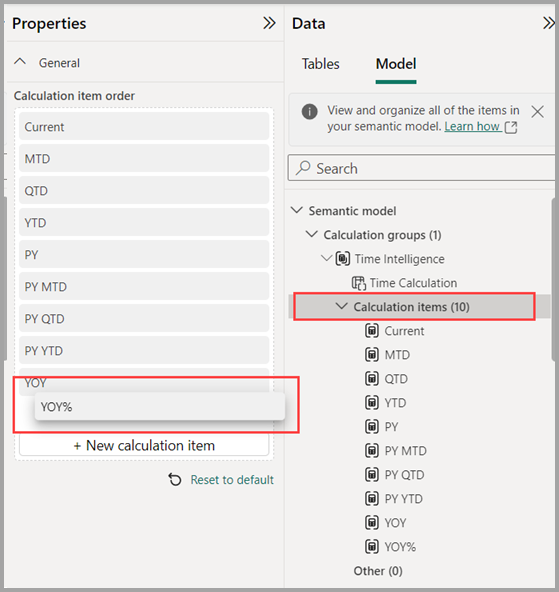
To reorder the calculation items in whatever logical way you prefer, you can select the Calculation items section in the Properties pane, or right-click context menu of the calculation item to move it up or down in the list.
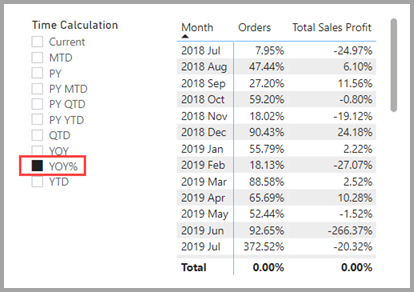
Add a dynamic format string to a calculation item
Calculation items use the underlying measure formatting by default. We might want to instead display YOY% as a percentage. To do so, select the YOY% calculation item, then turn on Dynamic format string in the properties pane, which allows you to specify a DAX expression to create a format string. For this example, it doesn’t require any conditional elements, so simply #,##0.00% changes the format to a percentage when this calculation item is applied, as shown in the following image.

Using the calculation group in reports
To use your new calculation group in a Report, go to the Report view, create a Matrix visual and add the following:
- Month column from the Date table to the Rows
- Time Calculation from the Time Intelligence calculation group to the Columns
- Orders measure to the Values
Note
If the measure Orders is not created in the model, you can use a different measure or go to the ribbon and choose New Measure to create it with this DAX expression.
Orders = DISTINCTCOUNT('Sales Order'[Sales Order])
The following image shows building a visual.

Calculation items on the Columns in the Matrix visual are showing the measure Orders grouped by each of the calculation items. You can also apply an individual calculation item to multiple measures by adding the calculation group column to a Slicer visual.
Using the calculation item in measures
You can create a new measure with an expression utilizing a calculation item on a specific measure.
To create an [Orders YOY%] measure, you can use the calculation item with CALCULATE.
Orders YOY% =
    CALCULATE(
        [Orders],
        'Time Intelligence'[Time Calculation] = "YOY%"
    )
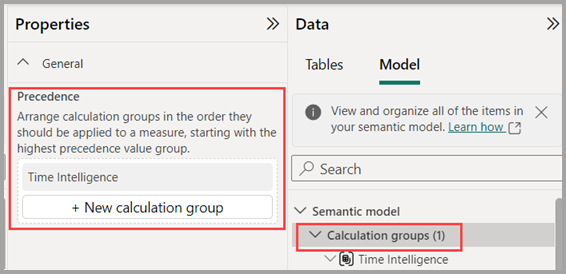
Setting calculation group precedence
Finally, if you add more calculation groups to the model you can specify the order in which they apply to a measure with the precedence property. You can adjust the calculation group precedence in the Calculation groups section properties pane, as shown in the following image.
You can learn more about calculation groups precedence in the Calculation groups in Analysis Services tabular models article.
Selection expressions for calculation groups
You can set selection expressions for calculation groups to get fine-grained control over what the calculation group returns if users make multiple, invalid or no selections on the calculation group. See selection expressions.
Considerations
Model measures change to variant data type
As soon as a calculation group is added to a semantic model, Power BI reports use the variant data type for all measures. If afterwards, all calculation groups are removed from the model the measures revert to their original data types again.
The variant data type may cause dynamic format strings for measures using a measure for re-use to show an error. Use the FORMAT DAX function to force the variant measure to be recognized as a string data type again.
FORMAT([Dynamic format string], "")
Alternatively, you can re-use your expression for dynamic format strings with a DAX user-defined function instead.
Visuals error when a calculation item applies a math operation on a non-numeric measure
Non-numeric measures are commonly used for dynamic titles in visuals and in dynamic format strings for measures. The error Cannot convert value ... of type Text to type Numeric shows on visuals impacted. The calculation item expression can avoid this error by adding a check to see if the measure is numeric before applying the math operation. Use the ISNUMERIC in the calculation item.
Calculation item safe =
    IF (
        // Check the measure is numeric
        ISNUMERIC( SELECTEDMEASURE() ),
            SELECTEDMEASURE() * 2,
            // Don't apply the calculation on a non-numeric measure
            SELECTEDMEASURE()
        )
Related content
The following articles describe more about data models, and also describe DirectQuery in detail.
- Calculation groups in Analysis Services tabular models
- Work with Model Explorer in Power BI
- Work with Modeling view in Power BI
- Automatic aggregations
- Use composite models in Power BI Desktop
- Manage storage mode in Power BI Desktop
- Many-to-many relationships in Power BI Desktop
DirectQuery articles: