Note
Access to this page requires authorization. You can try signing in or changing directories.
Access to this page requires authorization. You can try changing directories.
Analytics for the environment admin is available at the Microsoft Power Platform admin center. The admin reports provide a view into environment level usage, errors, service performance to drive governance, and change management services to users. These reports are available for canvas apps only and not available for model-driven apps.
To access these Power Apps analytics reports:
- Sign in to the Power Platform admin center.
- In the navigation pane, select Manage.
- In the Manage pane, under Products, select Power Apps.
- View the reports on the Power Apps analytics page.
Who can view these reports?
Admins with the these roles and a license can view the reports in Power Apps analytics:
- Environment Admin - can view reports for the environments that the admin has access to.
- Power Platform admin – can view reports for all environments.
- Dynamics 365 admin - can view reports for multiple environments.
- Microsoft 365 Global admin – can view reports for all environments.
Important
Be sure to review the article, Use service admin roles to manage your tenant to ensure all considerations are understood.
Data storage
When a user first creates an environment from a region, the environment is always hosted in that region. The data is stored only in the region that an environment is hosted in. Data is stored for a maximum of 28 days. The data refresh cycle is about 24 hours and the last refresh time in UTC time standard is displayed on the upper-right corner of the page.
What are the available reports?
There are six reports available for Power Apps admins. The last viewed environment is selected by default.
Usage report is the default report available to environment admins. It provides total app launches and daily active users across all apps in the environment. As an admin, you can filter the view with attributes like device platform, player version, country/region, state, and city.
Toast Errors report provides insights into the toast error trends, types, and counts per app to help drive improvements in app quality. The toast errors are errors displayed to the end users of the app.
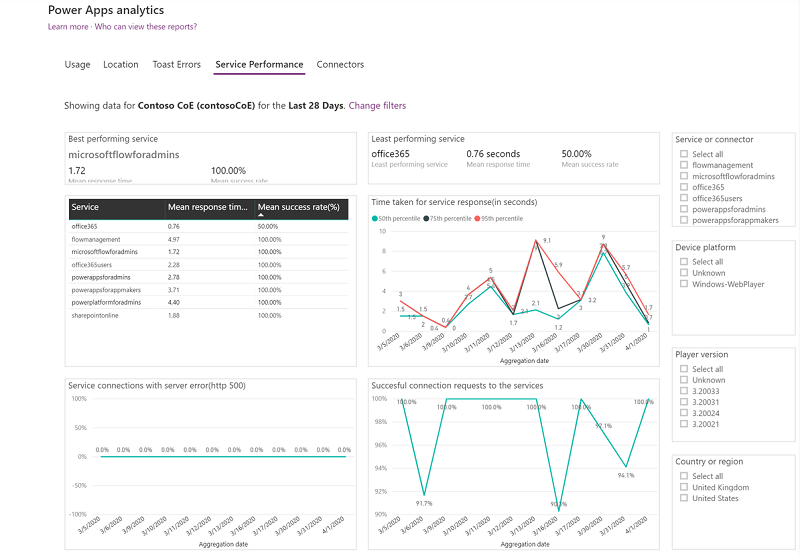
Service Performance report provides details of all standard and custom connectors to understand performance bottlenecks and client versus service API issues. As an environment admin, you get insights into:
- Connectors used in the environment.
- Best and least performant service and the API service response times.
- Success rates for each service to determine areas that need attention.
- The 50th, 75th, and 90th percentile response times for each service.
- The number of HTTP 500 error codes of connectors indicating issues around the server not responding to calls from the client.
- The number of successful connection requests.
Service performance KPIs are filterable by attributes such as service, connector, device platform, player version, and location (country, state, or city) to enhance API analysis.
Connectors report provides visibility into the standard and custom connectors used by canvas apps. The last 28 days of data are visible at the environment level.
As an admin, you can analyze the number of connectors linked to each app, the specific connectors in use, and their respective owners. Additionally, you can track app-sharing frequency, total sessions, and last accessed time to identify high-usage apps and connectors. Currently, this functionality is limited to connections owned by the admin/admin team and activity within those specific connections.
A sample scenario: An admin can monitor the number of shares and usage of a specific finance app that utilizes one or more connectors. This enables the admin to collaborate with the app owner to ensure no sensitive data is inadvertently shared through the app.
The current iteration of this specific report doesn't have a download report feature.
How do I change environments?
You can change environments by selecting Change Filter on the page.
Select the environment and time period from the drop-down lists, and then select Apply to save the changes. All Power Apps analytics reports now reflect this selection.
Limitations of downloaded reports
Currently, Power Apps analytics reports don't display model-driven apps data. Only canvas apps related data is displayed.
Some fields, such as the creator's email address and the app or flow display name, may appear blank in exported reports. This is expected behavior, as these values are resolved at runtime and are not part of the underlying stored dataset.
Related content
Tenant-level analytics (default)
Tenant-level Analytics for Power Apps (preview)
Set up Microsoft Power Platform self-service analytics to export inventory and usage data


