Note
Access to this page requires authorization. You can try signing in or changing directories.
Access to this page requires authorization. You can try changing directories.
With Power Query, you can connect to many different data sources and transform the data into the shape you want.
In this article, you learn how to create queries with Power Query by discovering:
- How the "Get Data" experience works in Power Query.
- How to use and take advantage of the Power Query user interface.
- How to perform common transformations like grouping and merging data.
If you're new to Power Query, you can sign up for a free trial of Power BI before you begin. You can use Power BI dataflows to try out the Power Query Online experiences described in this article.
You can also download Power BI Desktop for free.
Examples in this article connect to and use the Northwind OData feed.
https://services.odata.org/V4/Northwind/Northwind.svc/
Connect to an OData feed
Note
To learn more about where to get data from each of the Microsoft products that include Power Query, go to Where to get data.
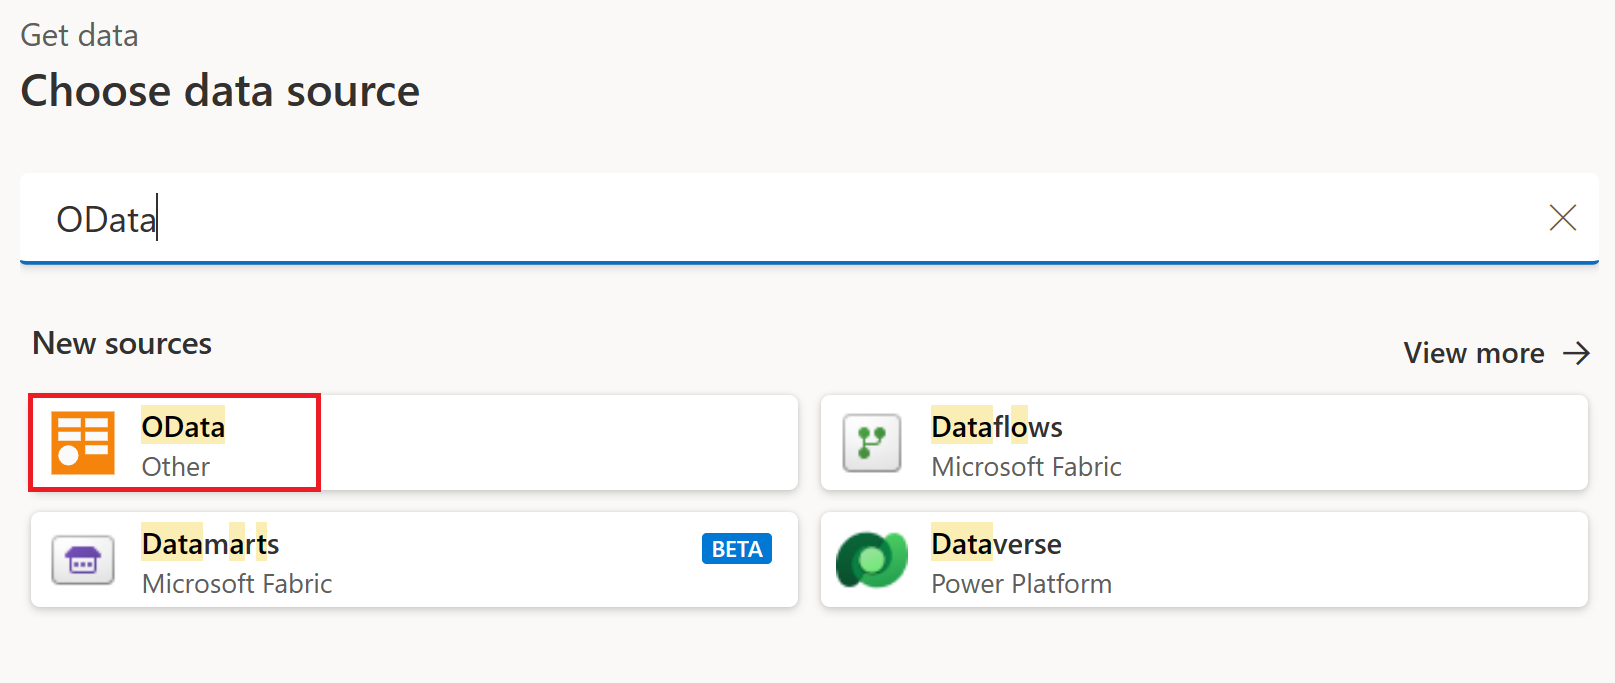
To start, locate the OData feed connector from the "Get Data" experience. You can search for OData in the search bar in the top-right corner.
Once you select this connector, the screen displays the connection settings and credentials.
- For URL, enter the URL to the Northwind OData feed shown in the previous section.
- For On-premises data gateway, leave as none.
- For Authentication kind, leave as anonymous.
Select the Next button.
The Navigator now opens, where you select the tables you want to connect to from the data source. Select the Customers table to load a preview of the data, and then select Transform data.
The dialog then loads the data from the Customers table into the Power Query editor.
The experience of connecting to your data, specifying the authentication method, and selecting the specific object or table to connect to is called the get data experience. This experience is documented with further detail in the Getting data overview article.
Note
To learn more about the OData feed connector, go to OData Feed.
The Power Query editor user experience
Tip
To find the Power Query editor in Power BI, under Queries select Transform data.

The Power Query editor represents the Power Query user interface. In this user interface, you can add or modify queries, manage queries by grouping or adding descriptions to query steps, or visualize your queries and their structure with different views. The Power Query user interface has five distinct components.
- Ribbon: the ribbon navigation experience, which provides multiple tabs to add transforms, select options for your query, and access different ribbon buttons to complete various tasks.
- Queries pane: a view of all your available queries.
- Current view: your main working view, which by default, displays a preview of the data for your query. You can also enable the diagram view along with the data preview view. You can also switch between the schema view and the data preview view while maintaining the diagram view.
- Query settings: a view of the currently selected query with relevant information, such as query name, query steps, and various indicators.
- Status bar: a bar displaying relevant important information about your query, such as execution time, total columns and rows, and processing status. This bar also contains buttons to change your current view.
Note
The schema and diagram view are currently only available in Power Query Online.
Using the Power Query editor
In this section, you begin transforming your data using Power Query. But before you start working on transforming the data, we discuss some of the UI panes that can be expanded or collapsed depending on their context. Selecting the appropriate panes lets you focus on the view that matters the most to you. We also discuss the different views that are available in the Power Query UI.
The ribbon
The ribbon is the component where you find most of the transforms and actions that you can do in the Power Query editor. It has multiple tabs, whose values depend on the product integration. Each of the tabs provides specific buttons and options, some of which might be redundant across the whole Power Query experience. These buttons and options provide you with easy access to the transforms and actions that you might need.
The Power Query interface is responsive and tries to adjust your screen resolution to show you the best experience. In scenarios where you'd like to use a compact version of the ribbon, there's also a collapse button at the bottom-right corner of the ribbon to help you switch to the compact ribbon.
You can switch back to the standard ribbon view by selecting the expand icon at the bottom-right corner of the ribbon.
Expand and collapse panes
You might notice that throughout the Power Query user interface, there are icons that help you collapse or expand certain views or sections. For example, there's an icon on the top right-hand corner of the Queries pane that collapses the queries pane when selected, and expands the pane when selected again.
Switch between views
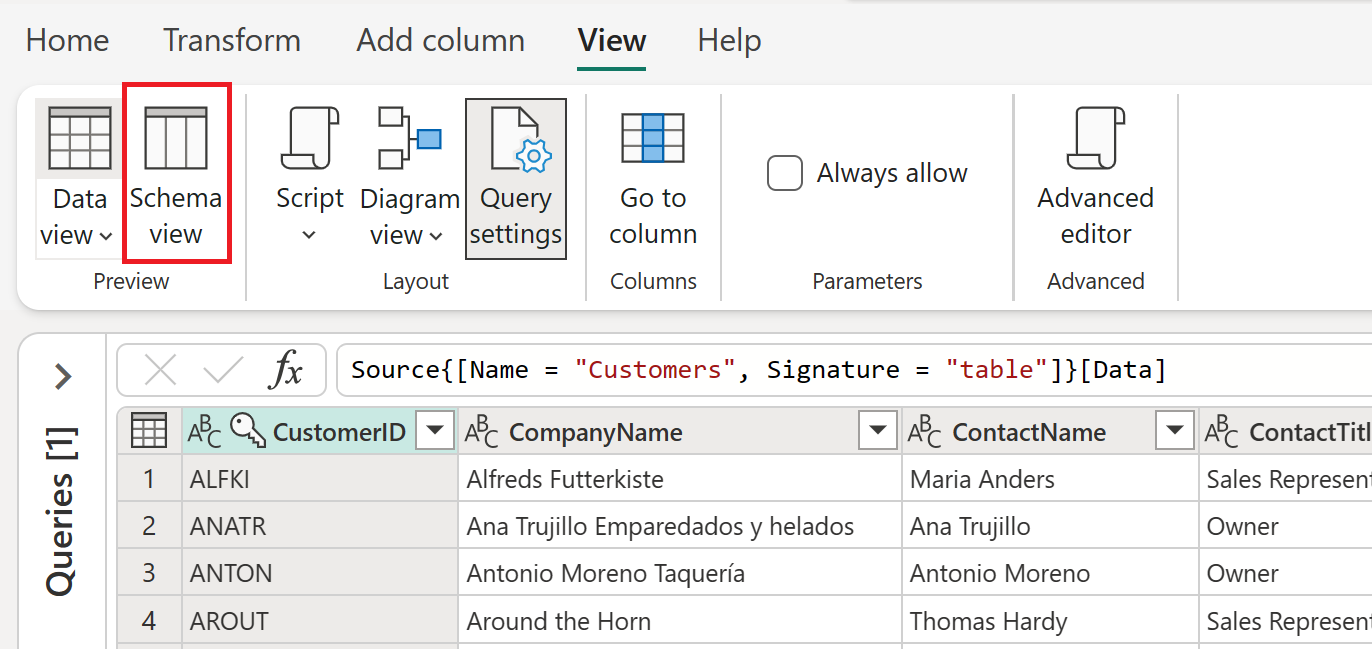
Apart from being able to collapse certain panes and sections in the Power Query user interface, you can also switch what views are displayed. To switch views, go to the View tab in the ribbon where you find the Preview and Layout groups, which control how the Power Query user interface looks.
You're encouraged to try all of these options to find the view and layout that you feel most comfortable working with. As an example, select Schema view from the ribbon.
The right side of the status bar also contains icons for the diagram, data, and schema views. You can use these icons to change between views. You can also use these icons to enable or disable the view of your choice.
What is schema view
The schema view offers you a quick and straightforward way to interact only with the components of the schema for your table, such as the column names and data types. We recommend the schema view when you want to do schema-related actions. These actions could be removing columns, renaming columns, changing column data types, reordering columns, or duplicating columns.
Note
To learn more about schema view, go to Using Schema view.
For example, in schema view, select the check mark next to the Orders and CustomerDemographics columns, and from the ribbon select the Remove columns action. This selection applies a transformation to remove these columns from your data.
What is diagram view
You can now switch back to the data preview view and enable the diagram view to use a more visual perspective of your data and query.
The diagram view helps you visualize how your query is structured and how it might interact with other queries in your project. Each step in your query has a distinct icon to help you recognize the transform that was used. There are also lines that connect steps to illustrate dependencies. Since both the data preview view and diagram view are enabled, the diagram view displays on top of the data preview.
Note
To learn more about diagram view, go to Diagram view.
Begin transforming your data
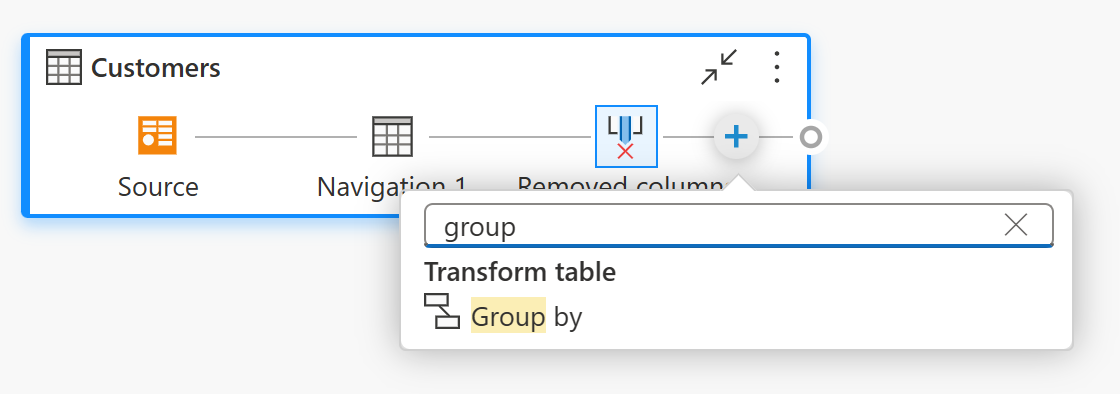
With diagram view enabled, select the plus sign. You can search for a new transform to add to your query. Search for Group by and select the transform.
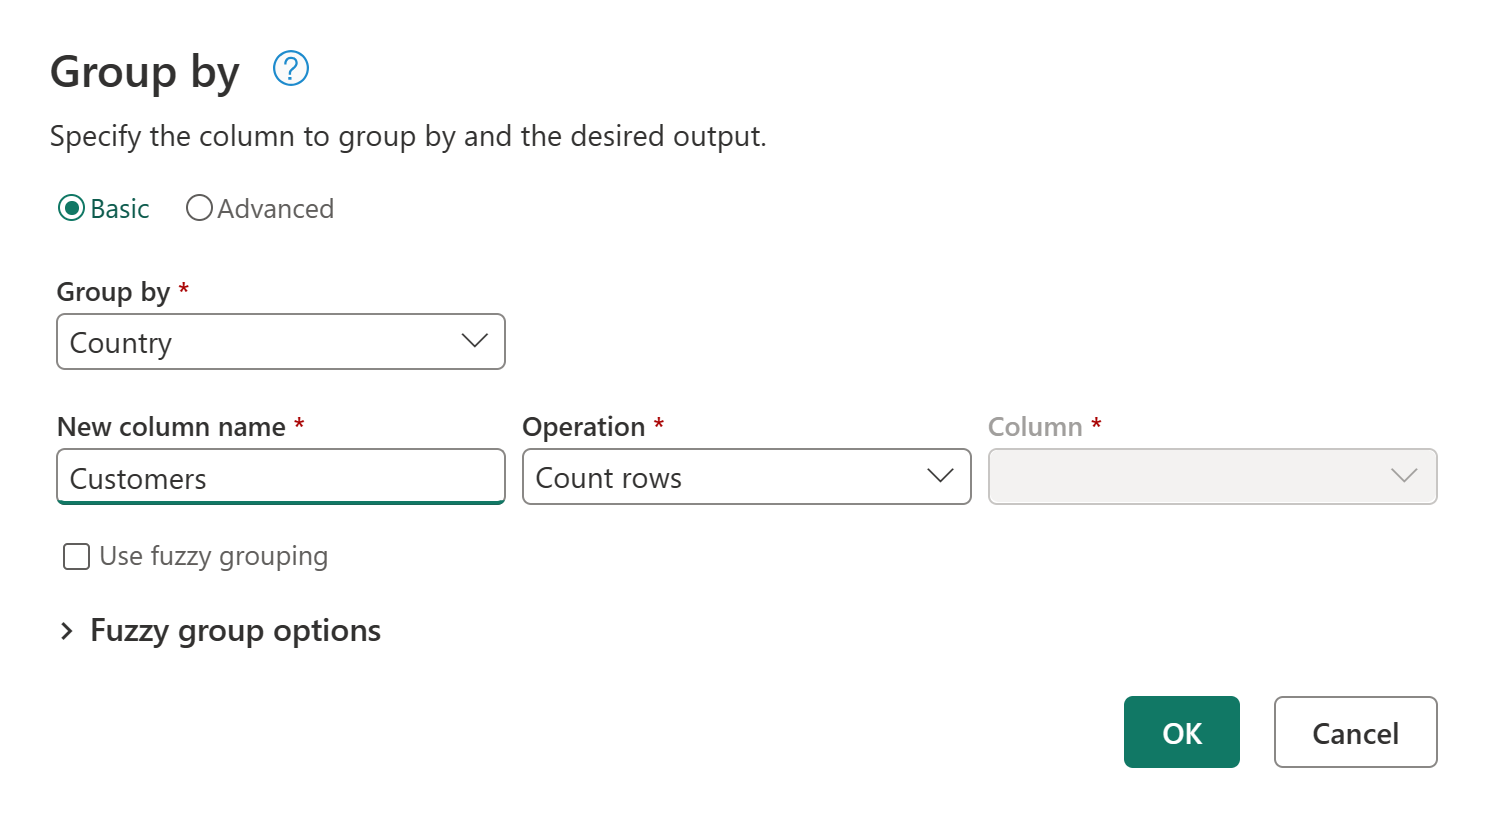
The Group by dialog then appears. You can set the Group by operation to group by country and count the number of customer rows per country.
- Keep the Basic radio button selected.
- Select Country to group by.
- Enter Customers as the new column name and select Count rows as the operation.
Select OK to perform the operation. Your data preview refreshes to show the total number of customers by country.
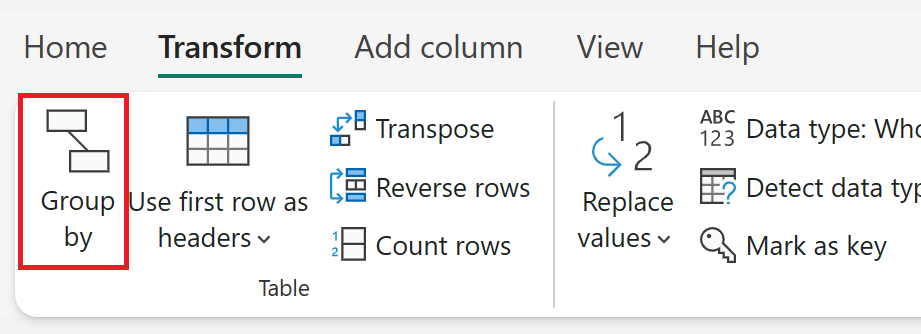
An alternative way to launch the Group by dialog would be to use the Group by button in the ribbon or to select and hold (right-click) the Country column.
For convenience, transforms in Power Query can often be accessed from multiple places, so users can opt to use the experience they prefer.
Adding a new query
Now that you have a query that provides the number of customers per country, you can add context to this data by finding the total number of suppliers for each territory.
First, you need to add the Suppliers data. Select Get Data. In Choose data source, search for OData. Then select the OData connector.
The OData connection experience reappears. Enter the connection settings as described in Connect to an OData feed to connect to the Northwind OData feed. In the Navigator experience, search for and select the Suppliers table.
Select Create to add the new query to the Power Query editor. Expand the Queries pane, which now displays both the Customers and the Suppliers query.
Open the Group by dialog again, this time by selecting the Group by button on the ribbon under the Transform tab.
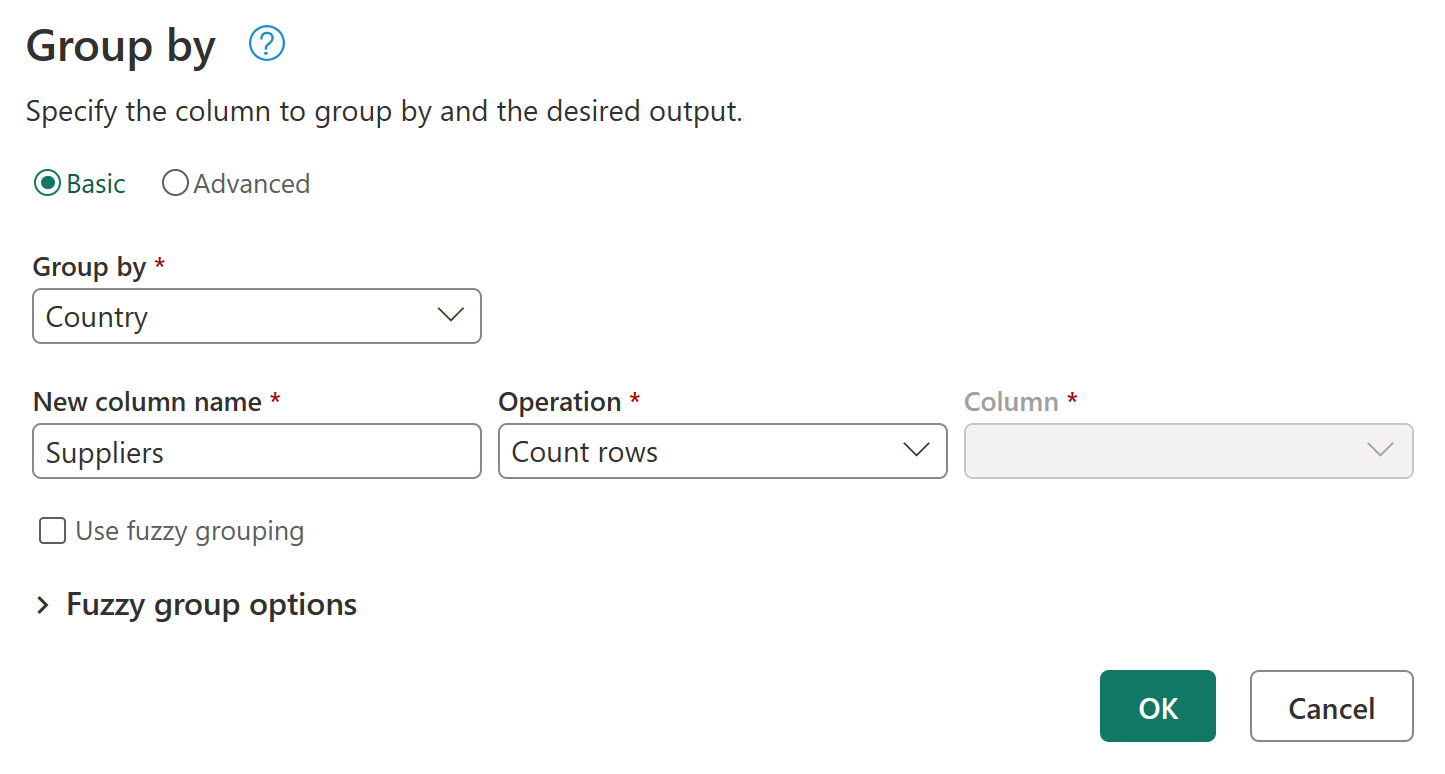
In the Group by dialog, set the Group by operation to group by country and count the number of supplier rows per country.
- Keep the Basic radio button selected.
- Select Country to group by.
- Enter Suppliers in New column name and select Count rows in Operation.
Note
To learn more about the Group by transform, go to Grouping or summarizing rows.
Referencing queries
Now that you have a query for customers and a query for suppliers, your next goal is to combine these queries into one. There are many ways to accomplish this, including using the Merge option in the Customers table, duplicating a query, or referencing a query. For this example, you create a reference by selecting and holding (right-clicking) the Customers table and selecting Reference, which effectively creates a new query that references the Customers query.
After creating this new query, change the name of the query to Country Analysis and disable the load of the Customers table by clearing the Enable load option from the Suppliers query.
Merging queries
A merge queries operation joins two existing tables together based on matching values from one or multiple columns. In this example, the goal is to join both the Customers and Suppliers tables into one table only for the countries/regions that have both Customers and Suppliers.
Inside the Country Analysis query, select the Merge queries option from the Home tab in the ribbon.
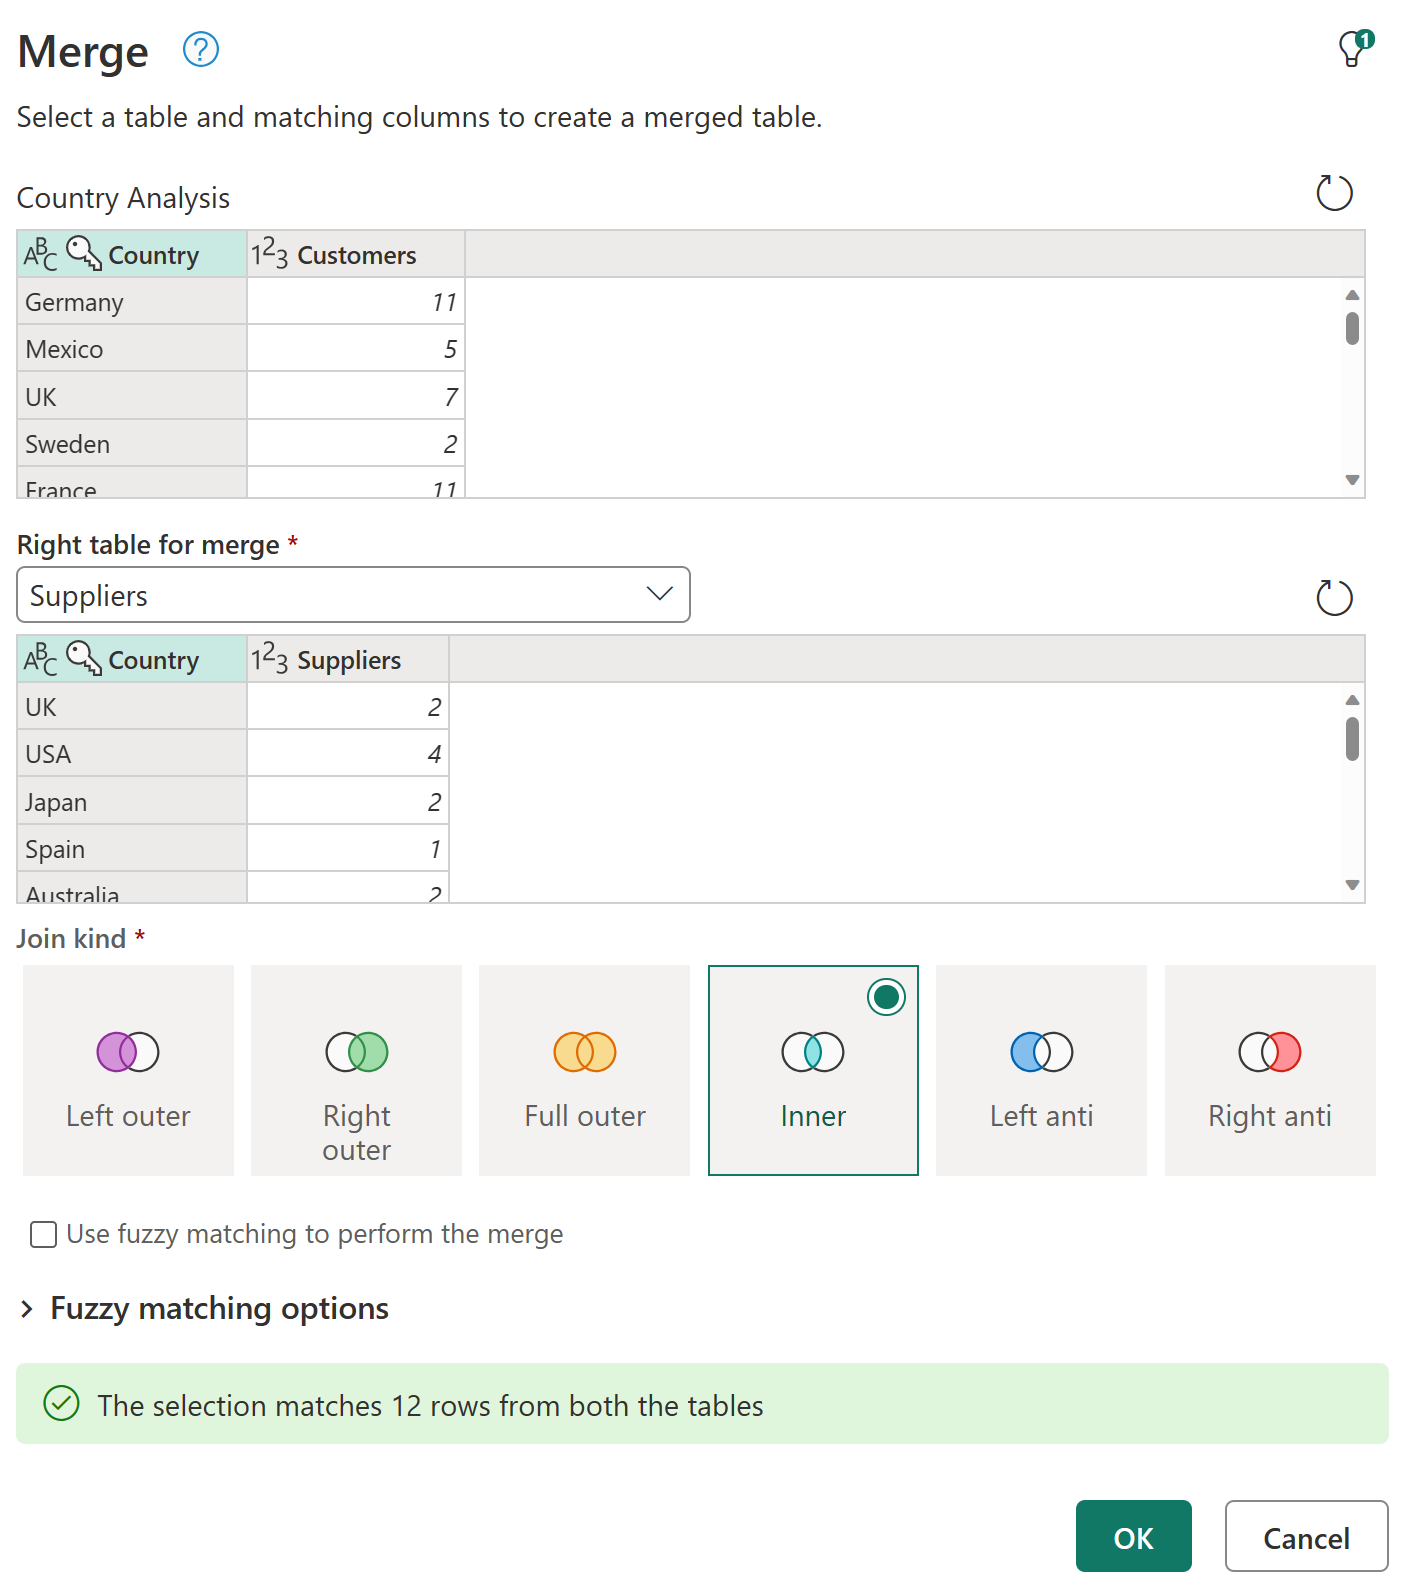
A new dialog for the merge operation appears. You can then select the query to merge with your current query. In the Right table for merge, select the Suppliers query, and then select the Country field from both queries. Finally, select the Inner join kind, as you only want the countries/regions where you have Customers and Suppliers for this analysis.
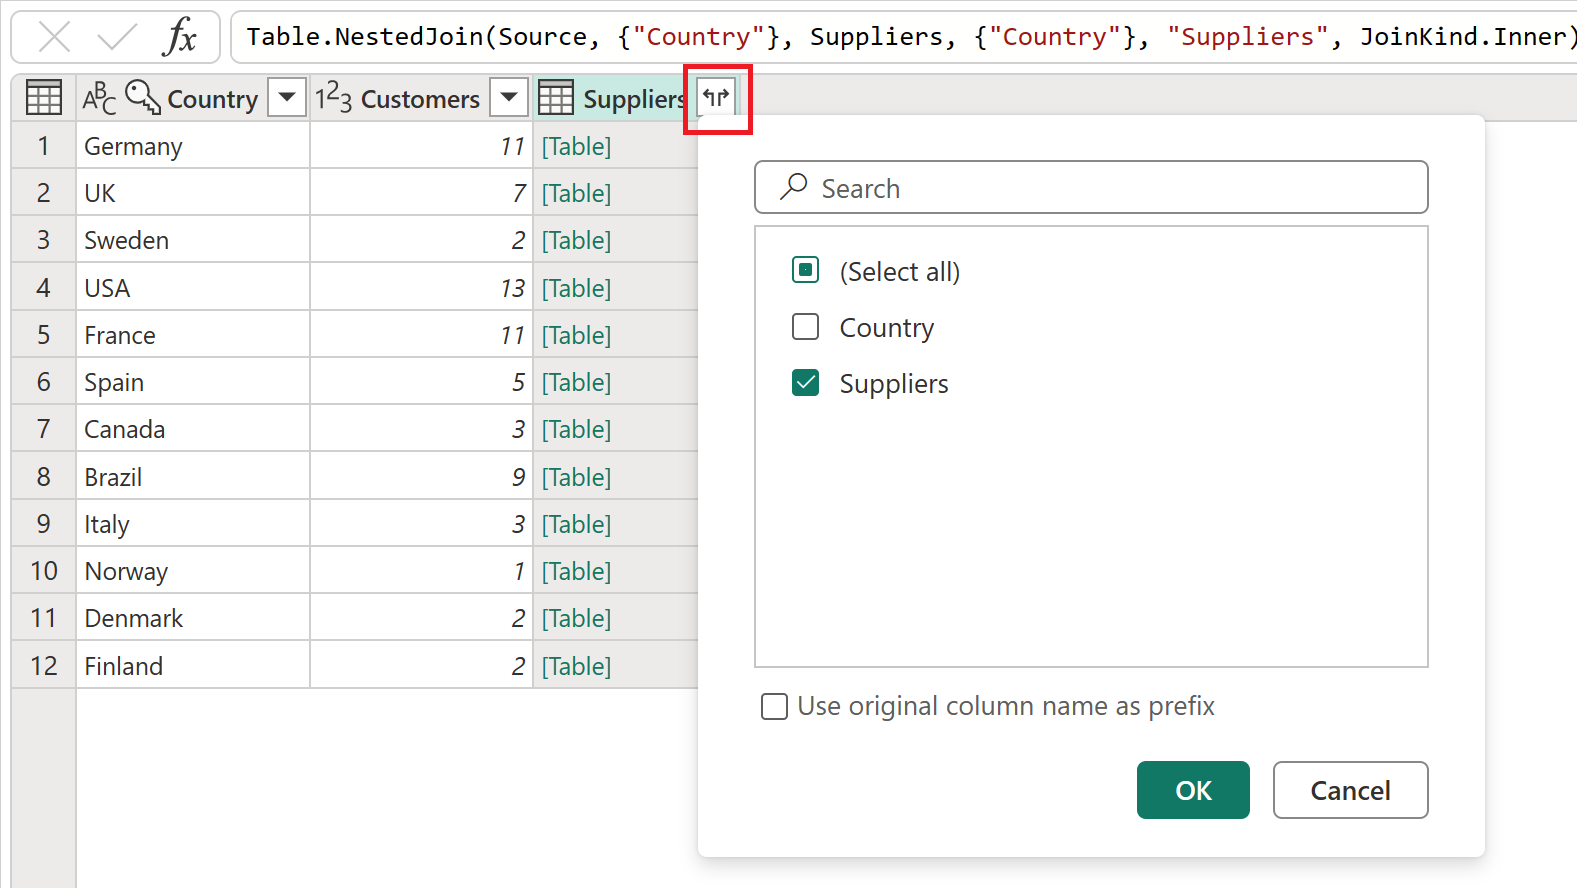
After you select the OK button, a new column is added to your Country Analysis query that contains the data from the Suppliers query. Select the icon next to the Suppliers field, which displays a menu where you can select which fields you want to expand. Select only the Suppliers field, and then select the OK button.
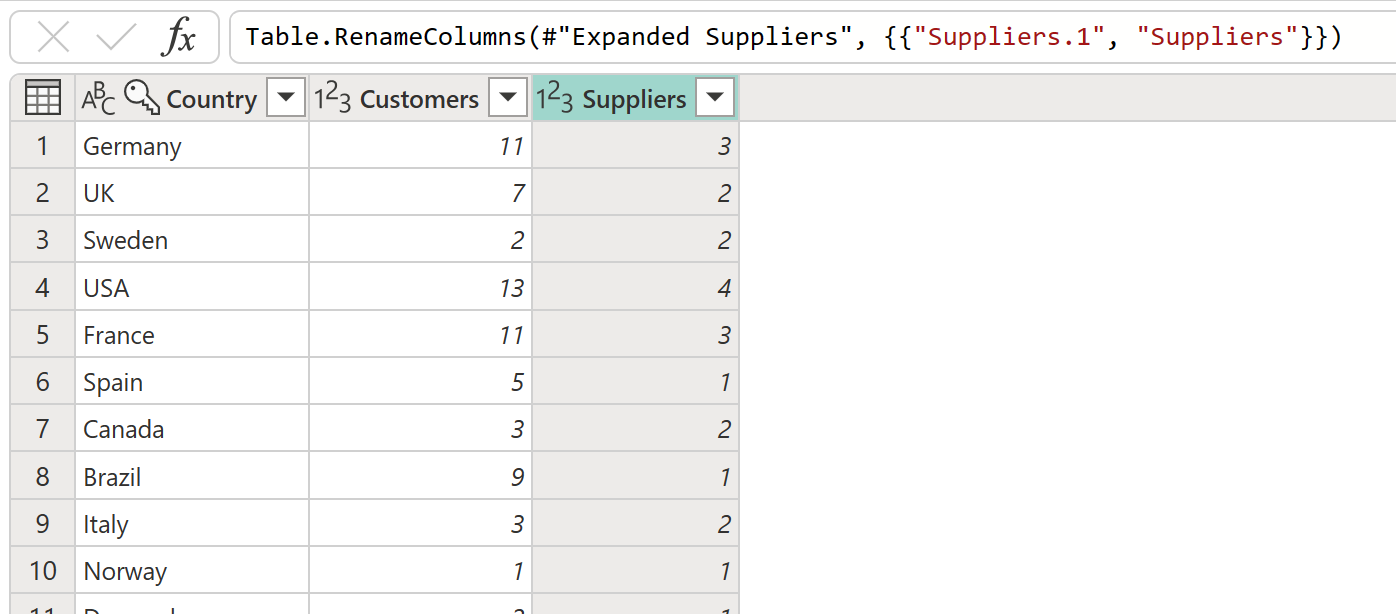
The result of this expand operation is a table with only 12 rows. Rename the Suppliers.1 field to just Suppliers by double-clicking the field name and entering the new name.
Note
To learn more about the Merge queries feature, go to Merge queries overview.
Applied steps
Every transformation that is applied to your query is saved as a step in the Applied steps section of the query settings pane. If you ever need to check how your query is transformed from step to step, you can select a step and preview how your query resolves at that specific point.
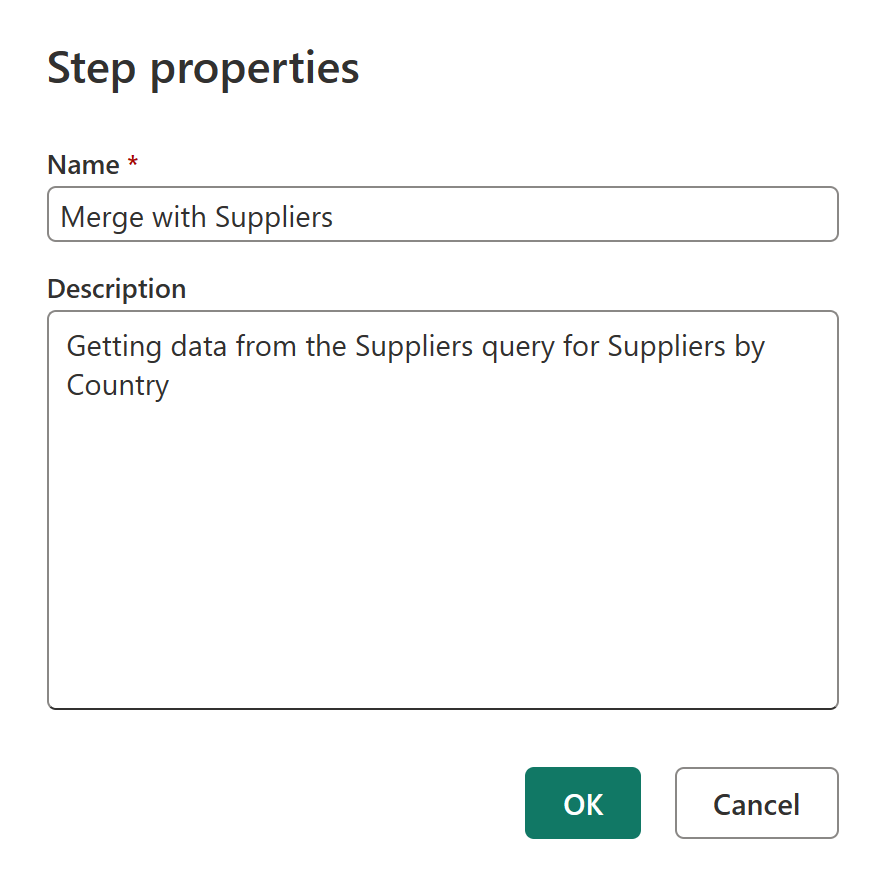
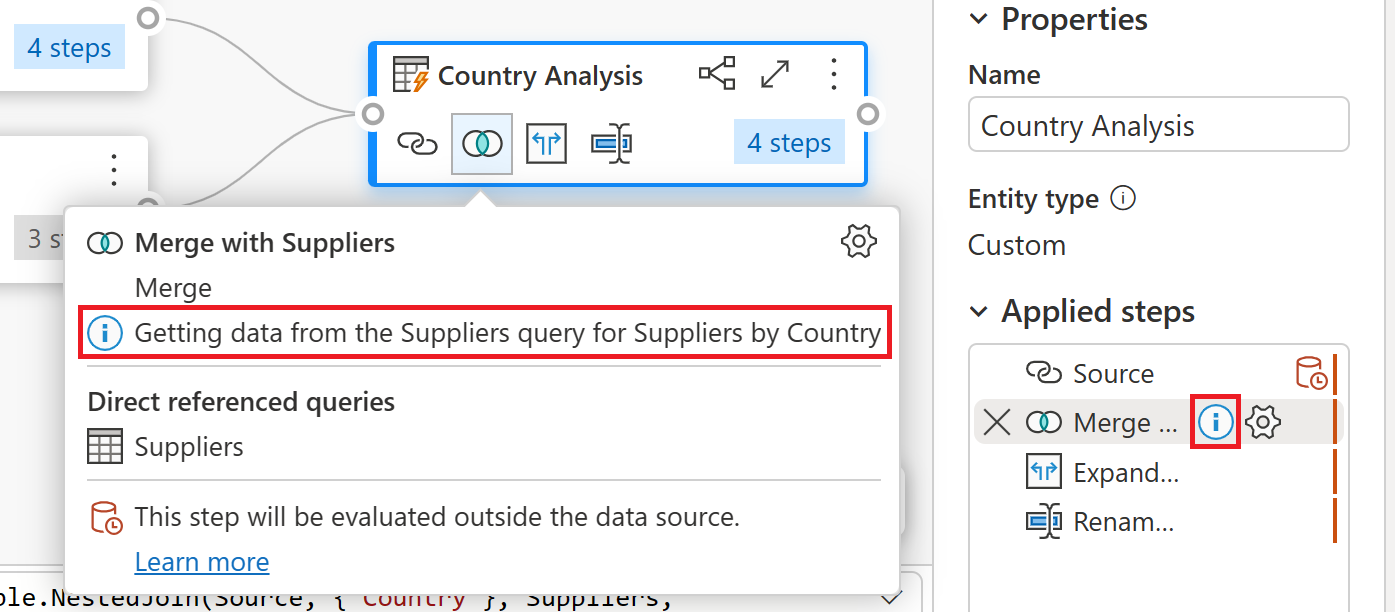
You can also select and hold (right-click) a query and select the Properties option to change the name of the query or add a description for the query. For example, select and hold (right-click) the Merge queries step from the Country Analysis query and change the name of the query to Merge with Suppliers and the description to Getting data from the Suppliers query for Suppliers by Country.
After this change, you can hover over the merge query icon in the diagram view or hover over the new icon next to your step in the Applied steps pane to read its description.
Note
To learn more about Applied steps, go to Using the Applied Steps list.
Before moving on to the next section, disable the Diagram view to only use the Data preview.
Adding a new column
With the data for customers and suppliers in a single table, you can now calculate the ratio of customers-to-suppliers for each country. Select the last step of the Country Analysis query, and then select both the Customers and Suppliers columns. In the Add column tab in the ribbon and inside the From number group, select Standard, and then Divide (Integer) from the dropdown list.
This change creates a new column called Integer-division that you can rename to Ratio. This change is the final step of your query, and provides the customer-to-supplier ratio for the countries/regions where the data has customers and suppliers.
Data profiling
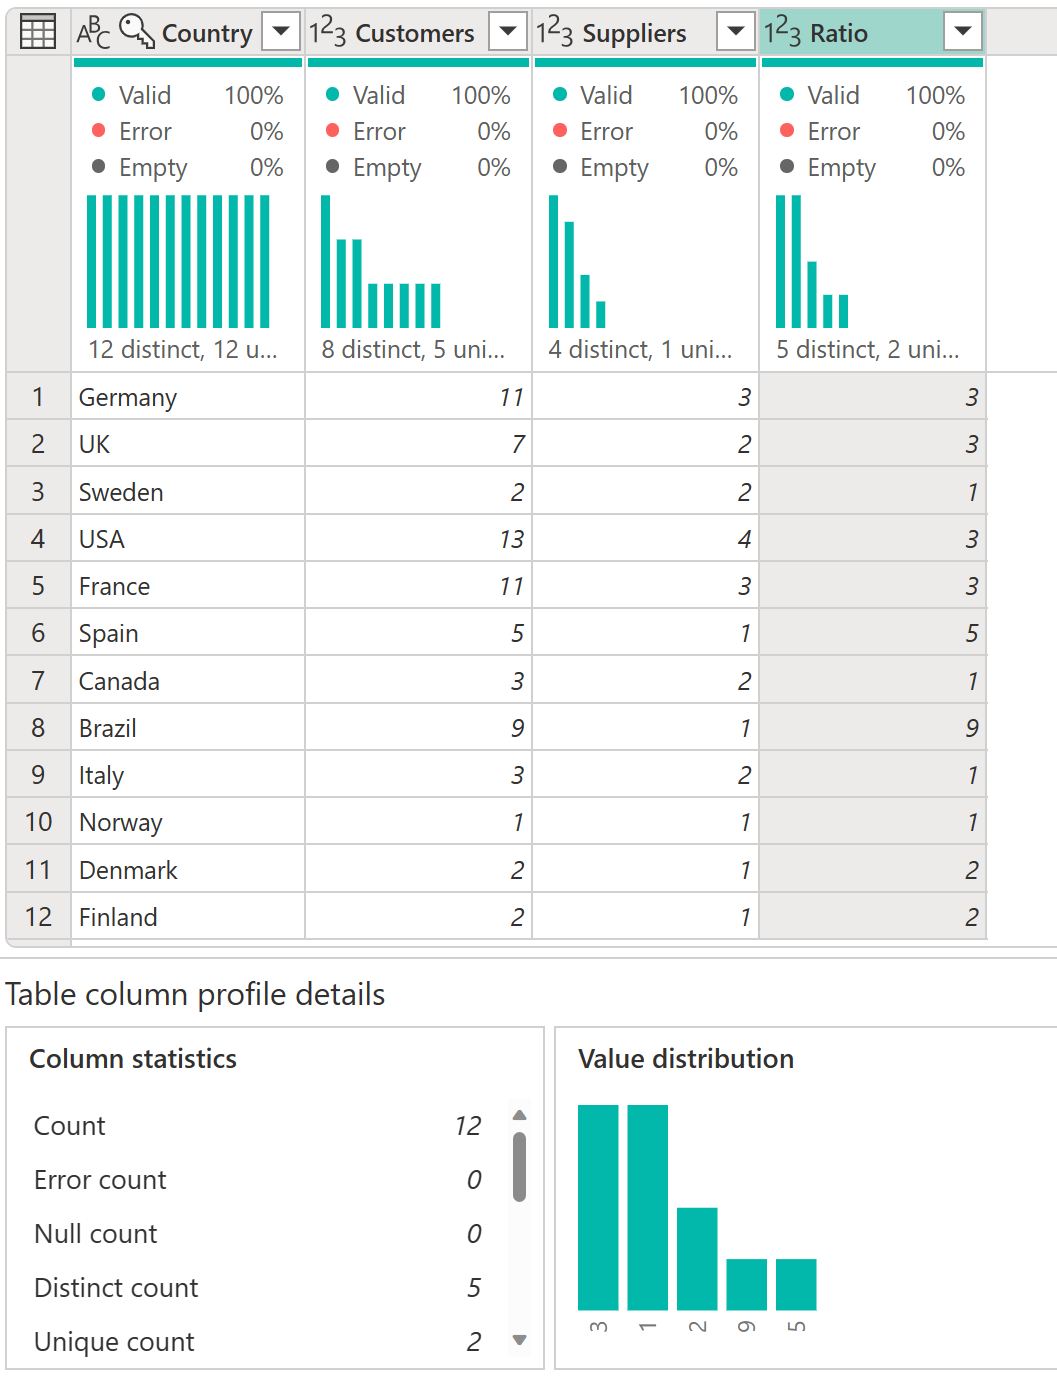
Another Power Query feature that can help you better understand your data is Data Profiling. By enabling the data profiling features, you get feedback about the data inside your query fields, such as value distribution, column quality, and more.
We recommend that you use this feature throughout the development of your queries, but you can always enable and disable the feature at your convenience. The following image shows all the data profiling tools enabled for your Country Analysis query.
Note
To learn more about Data profiling, go to Using the data profiling tools.
The advanced editor
If you want to observe the code that the Power Query editor is creating with each step, or want to create your own shaping code, you can use the advanced editor. To open the advanced editor, select the View tab on the ribbon, and then select Advanced Editor. A window appears, showing the existing query code.
You can directly edit the code in the Advanced Editor window. The editor indicates if your code is free of syntax errors. To close the window, select the Done or Cancel button.
Accessing Power Query help
There are various levels of help that can be accessed in the Microsoft apps that use Power Query. This section describes these help levels.
Power Query help in Excel
There are a couple of ways to access Power Query help information that specifically applies to Power Query in Excel. One way to access the online Excel Power Query documentation is to select File > Help > Help in the Power Query editor.
To access the inline Power Query help information in Excel, select the Help tab on the Excel ribbon, and then enter Power Query in the search text box.
Power Query help in Power BI Desktop
There's a Help tab in the Power Query editor running on Power BI Desktop, but at this time all of the options go to locations that supply Power BI information. You can also reach this same Power BI Help information in the Power Query editor in Power BI Desktop by selecting File > Help, and then selecting one of the help options.
Power Query help in Power BI service, Power Apps, Customer Insights, and Azure Data Factory
The Power Query Help tab in Power BI service, Power Apps, Dynamics 365 Customer Insights, and Azure Data Factory contains links to important sources of information about Power Query.
The options in the help tab include links to:
- Power Query documentation: Links to the Power Query documentation
- Keyboard shortcuts: Links to the keyboard shortcuts article in the Power Query documentation.
- Support: Links to the support website of the Microsoft product that Power Query is currently running in.
- Power Query website: Links to the Power Query website.
- Power Query blog: Links to the Power Query blog
- Power Query community: Links to the Power Query community.
- Submit an idea: Links to the ideas website of the Microsoft product that Power Query is currently running in.
- Send feedback: Opens a window in Power Query. The window asks you to rate your experience with Power Query and to provide any additional information you would like to supply.
Note
Currently, Azure Analysis Services doesn't contain any inline Power Query help links. However, you can get help for Power Query M functions. More information is contained in the next section.
Help for Power Query M functions
In addition to the Power Query help functions listed in the previous sections, you can also get help for individual M functions from inside the Power Query editor. The following steps describe how to get to this inline help.
- With the Power Query editor open, select the insert step (
 ) button.
 - In the formula bar, enter the name of a function you want to check.
- If you're using Power Query Desktop, enter an equal sign, a space, and the name of a function.
- If you're using Power Query Online, enter the name of a function.
- Select the properties of the function.
- If you're using Power Query Desktop, in the Query Settings pane, under Properties, select All properties.
- If you're using Power Query Online, in the Query Settings pane, select Properties.
These steps open the inline help information for your selected function, and let you enter individual properties used by the function.
Summary
In this article, you created a series of queries with Power Query that provides a customer-to-supplier ratio analysis at the country level for the Northwind corporation.
You learned the components of the Power Query user interface, how to create new queries inside the query editor, reference queries, merge queries, understand the applied steps section, and add new columns. You also learned how to use the data profiling tools to better understand your data.
Power Query is a powerful tool used to connect to many different data sources and transform the data into the shape you want. The scenarios outlined in this article are examples to show you how you can use Power Query to transform raw data into important actionable business insights.
