In this tutorial, you use Power BI Desktop to connect to the adventureworks sample model database on your server. The tasks you complete simulate a typical user connection to the model and creating a basic report from model data.
In order to connect to your server from Power BI Desktop, you first need the server name.
In Azure portal > server > Overview > Server name, copy the server name.
Connect in Power BI Desktop
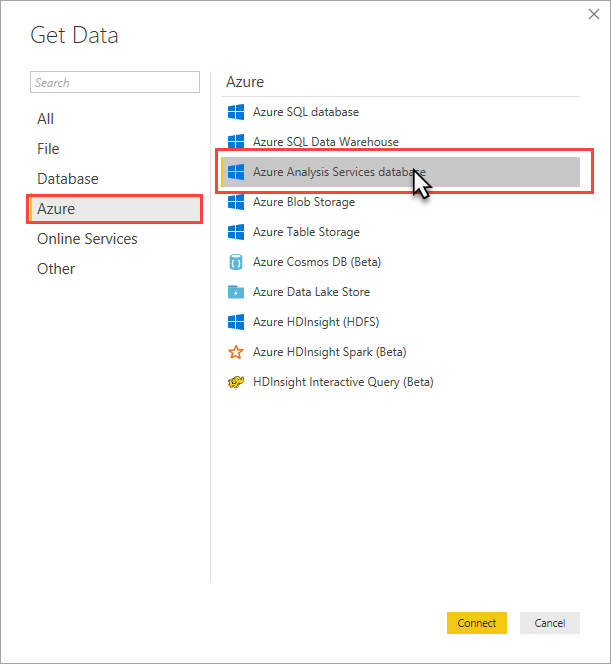
In Power BI Desktop, click Get Data > Azure > Azure Analysis Services database.
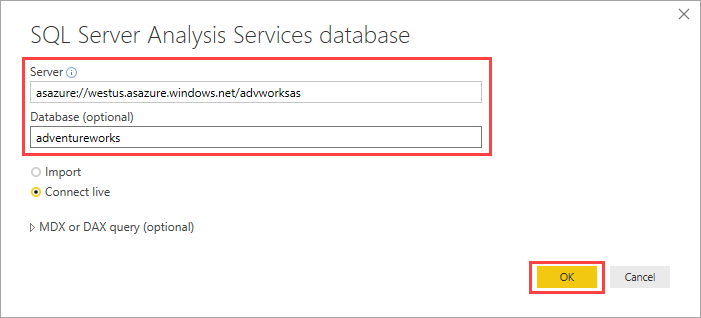
In Server, paste the server name, then in Database, enter adventureworks, and then click OK.
When prompted, enter your credentials. The account you enter must have at least read permissions for the adventureworks sample model database.
The adventureworks model opens in Power BI Desktop with a blank report in Report view. The Fields list displays all non-hidden model objects. Connection status is displayed in the lower-right corner.
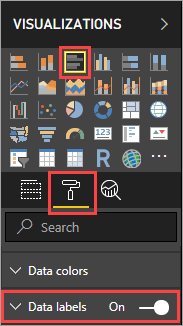
In VISUALIZATIONS, select Clustered Bar Chart, then click Format (paint roller icon), and then turn on Data labels.
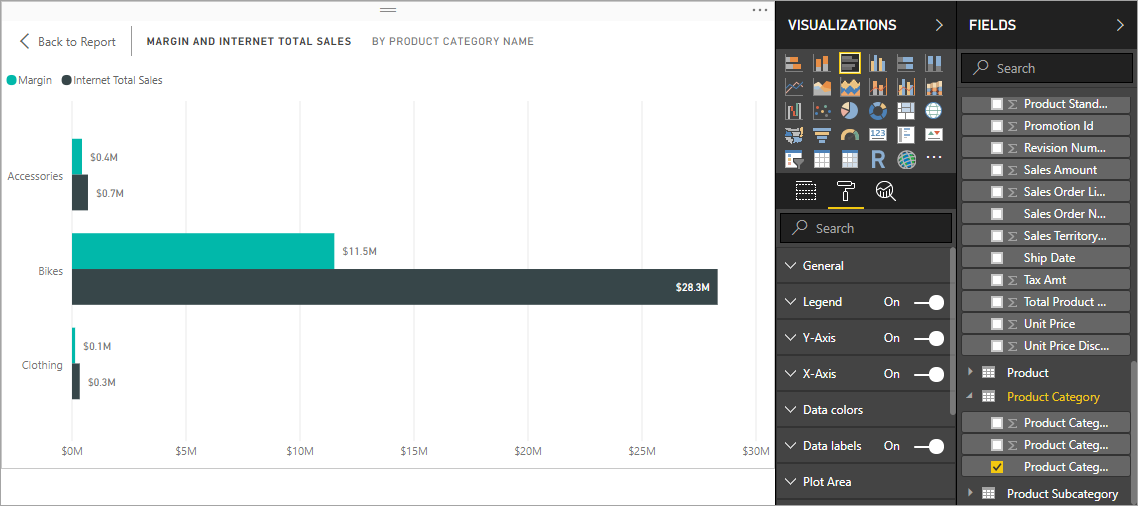
In FIELDS > Internet Sales table, select Internet Sales Total and Margin measures. In Product Category table, select Product Category Name.
Take a few minutes to explore the adventureworks sample model by creating different visualizations and slicing on data and metrics. When you're happy with your report, be sure to save.
Clean up resources
If no longer needed, do not save your report or delete the file if you did save.
Next steps
In this tutorial, you learned how to use Power BI Desktop to connect to a data model on a server and create a basic report. If you're not familiar with how to create a data model, see the Adventure Works Internet Sales tabular data modeling tutorial in the SQL Server Analysis Services docs.
With Power BI, you can create compelling visuals and reports. In this module, you learn how to use Power BI Desktop to connect to data, build visuals, and create a report that you can share with others in your organization. You then learn how to publish the report to the Power BI service, so that others can see your insights and benefit from your work.
Demonstrați metode și cele mai bune practici care se aliniază cu cerințele de afaceri și tehnice pentru modelarea, vizualizarea și analiza datelor cu Microsoft Power BI.
In this tutorial, learn how to configure Azure Analysis Services administrator and user roles by using the Azure portal or SQL Server Management Studio.