Notă
Accesul la această pagină necesită autorizare. Puteți încerca să vă conectați sau să modificați directoarele.
Accesul la această pagină necesită autorizare. Puteți încerca să modificați directoarele.
Fine-grained access control allows you to restrict access to specific data using views, row filters, and column masks. This page explains how serverless compute is used to enforce fine-grained access controls on dedicated compute resources.
Note
Dedicated compute is all-purpose or jobs compute configured with Dedicated access mode (formerly single user access mode). See Access modes.
Requirements
To use dedicated compute to query a view or table with fine-grained access controls:
- The dedicated compute resource must be on Databricks Runtime 15.4 LTS or above.
- The workspace must be enabled for serverless compute.
If your dedicated compute resource and workspace meet these requirements, then data filtering is run automatically.
How data filtering works on dedicated compute
Whenever a query accesses a database object with fine-grained access controls, the dedicated compute resource passes the query to your workspace's serverless compute to perform the data filtering. The filtered data is then transferred between the serverless and dedicated compute using temporary files on workspace-internal cloud storage.
Azure Databricks transfers the filtered data using Cloud Fetch, a capability that writes temporary result sets to internal workspace storage (your workspace's DBFS root). Azure Databricks automatically garbage collects these files, marking them for deletion after 24 hours and permanently deleting them after an additional 24 hours.
This functionality applies to the following database objects:
- Dynamic views
- Tables with row filters or column masks
- Views built over tables that the user does not have the
SELECTprivilege on - Materialized views
- Streaming tables
In the following diagram, a user has the SELECT privilege on table_1, view_2, and table_w_rls, which has row filters applied. The user does not have the SELECT privilege on table_2, which is referenced by view_2.

The query on table_1 is handled entirely by the dedicated compute resource, because no filtering is required. The queries on view_2 and table_w_rls require data filtering to return the data that the user has access to. These queries are handled by the data filtering capability on serverless compute.
Support for write operations
In Databricks Runtime 16.3 and above, you can write to tables that have row filters or column masks applied, using these options:
- The MERGE INTO SQL command, which you can use to achieve
INSERT,UPDATE, andDELETEfunctionality. - The Delta merge operation.
- The
DataFrame.write.mode("append")API.
To achieve INSERT, UPDATE, and DELETE functionality, you can use a staging table and the MERGE INTO statement’s WHEN MATCHED and WHEN NOT MATCHED clauses.
The following is an example of an UPDATE using MERGE INTO:
MERGE INTO target_table AS t
USING source_table AS s
ON t.id = s.id
WHEN MATCHED THEN
  UPDATE SET
    t.column1 = s.column1,
    t.column2 = s.column2;
The following is an example of an INSERT using MERGE INTO:
MERGE INTO target_table AS t
USING source_table AS s
ON t.id = s.id
WHEN NOT MATCHED THEN
INSERT (id, column1, column2) VALUES (s.id, s.column1, s.column2);
The following is an example of a DELETE using MERGE INTO:
MERGE INTO target_table AS t
USING source_table AS s ON t.id = s.id
WHEN MATCHED AND s.some_column = TRUE THEN DELETE;
Support for DDL, SHOW, DESCRIBE, and other commands
In Databricks Runtime 17.1 and above, you can use the following commands in combination with fine-grained access-controlled objects on dedicated compute:
- DDL statements
- SHOW statements
- DESCRIBE statements
- OPTIMIZE
- DESCRIBE HISTORY
- FSCK REPAIR TABLE (Databricks Runtime 17.2 and above)
If required, these commands automatically run on serverless compute.
Some commands are not supported, including VACCUM, RESTORE, and REORG TABLE.
Serverless compute costs
Customers are charged for the serverless compute resources that perform data filtering operations. For pricing information, see Platform Tiers and Add-Ons.
Users with access can query the system.billing.usage table to see how much they've been charged. For example, the following query breaks down compute costs by user:
SELECT usage_date,
sku_name,
 identity_metadata.run_as,
SUM(usage_quantity) AS `DBUs consumed by FGAC`
FROM system.billing.usage
WHERE usage_date BETWEEN '2024-08-01' AND '2024-09-01'
 AND billing_origin_product = 'FINE_GRAINED_ACCESS_CONTROL'
GROUP BY 1, 2, 3 ORDER BY 1;
View query performance when data filtering is engaged
The Spark UI for dedicated compute displays metrics that you can use to understand the performance of your queries. For each query that you run on the compute resource, the SQL/Dataframe tab displays the query graph representation. If a query was involved in data filtering, the UI displays a RemoteSparkConnectScan operator node at the bottom of the graph. That node displays metrics that you can use to investigate query performance. See View compute information in the Spark UI.
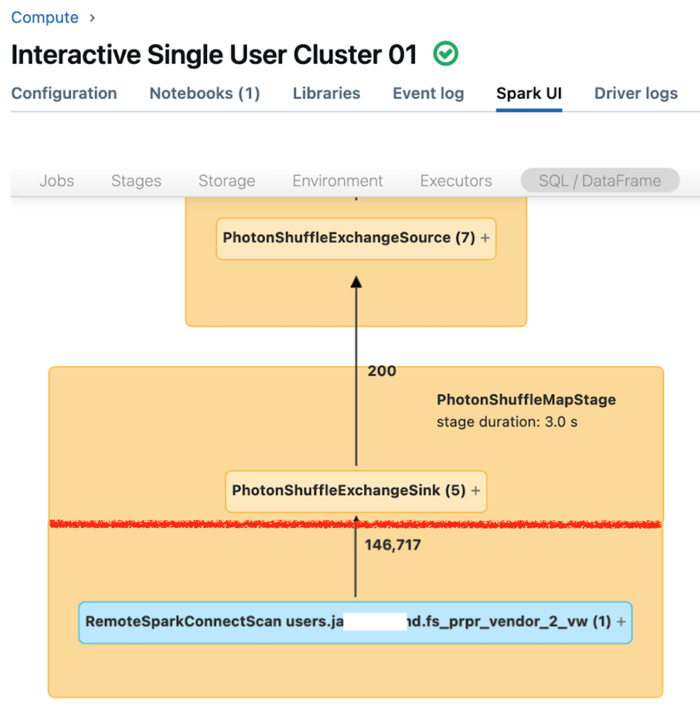
Expand the RemoteSparkConnectScan operator node to see metrics that address such questions as the following:
- How much time did data filtering take? View “total remote execution time.”
- How many rows remained after data filtering? View “rows output.”
- How much data (in bytes) was returned after data filtering? View “rows output size.”
- How many data files were partition-pruned and did not have to be read from storage? View “Files pruned” and “Size of files pruned.”
- How many data files could not be pruned and had to be read from storage? View “Files read” and “Size of files read.”
- Of the files that had to be read, how many were already in the cache? View “Cache hits size” and “Cache misses size.”
Limitations
Only batch reads are supported on streaming tables. Tables with row filters or column masks don't support streaming workloads on dedicated compute.
The default catalog (
spark.sql.catalog.spark_catalog) cannot be modified.spark.catalog.listColumns()is not supported. Instead, you can useSHOW COLUMNS INto list column names,SHOW PARTITIONSto list partition columns, orDESCRIBE TABLE [EXTENDED [AS JSON]]to get a detailed table description.In Databricks Runtime 16.2 and below, there is no support for write or refresh table operations on tables that have row filters or column masks applied.
Specifically, DML operations, such as
INSERT,DELETE,UPDATE,REFRESH TABLE, andMERGE, are not supported. You can only read (SELECT) from these tables.In Databricks Runtime 16.3 and above, write table operations such as
INSERT,DELETE, andUPDATEare not supported, but can be done usingMERGE, which is supported.When using
DeltaTable.forName()orDeltaTable.forPath()on dedicated compute with FGAC-enabled tables, only themerge()andtoDF()operations are supported. For other DeltaTable operations, use the corresponding SQL commands instead. For example, instead ofhistory(), useDESCRIBE HISTORYand instead ofclone(), useSHALLOW CLONEorDEEP CLONE.In Databricks Runtime 16.2 and below, self-joins are blocked by default when data filtering is called because these queries might return different snapshots of the same remote table. However, you can enable these queries by setting
spark.databricks.remoteFiltering.blockSelfJoinstofalseon compute you are running these commands on.In Databricks Runtime 16.3 and above, snapshots are automatically synchronized between dedicated and serverless compute resources. Because of this synchronization, self-join queries that use the data filtering functionality return identical snapshots and are enabled by default. The exceptions are materialized views and any views, materialized views, and streaming tables shared using Delta Sharing. For these objects, self-joins are blocked by default, but you can enable these queries by setting
spark.databricks.remoteFiltering.blockSelfJoinsto false on compute you are running these commands on.If you enable self-join queries for materialized views and any views, materialized views, and streaming tables, you must ensure that there are no concurrent writes to the objects being joined.
- No support in Docker images.
- No support when using Databricks Container Services.
- You must open ports 8443 and 8444 to enable fine-grained access control on dedicated compute. See Deploy Azure Databricks in your Azure virtual network (VNet injection).