Azure Operator Nexus observability
The Operator Nexus observability framework provides operational insights into your on-premises instances. The framework supports logging, monitoring, and alerting (LMA), analytics, and visualization of operational (platform and workloads) data and metrics.
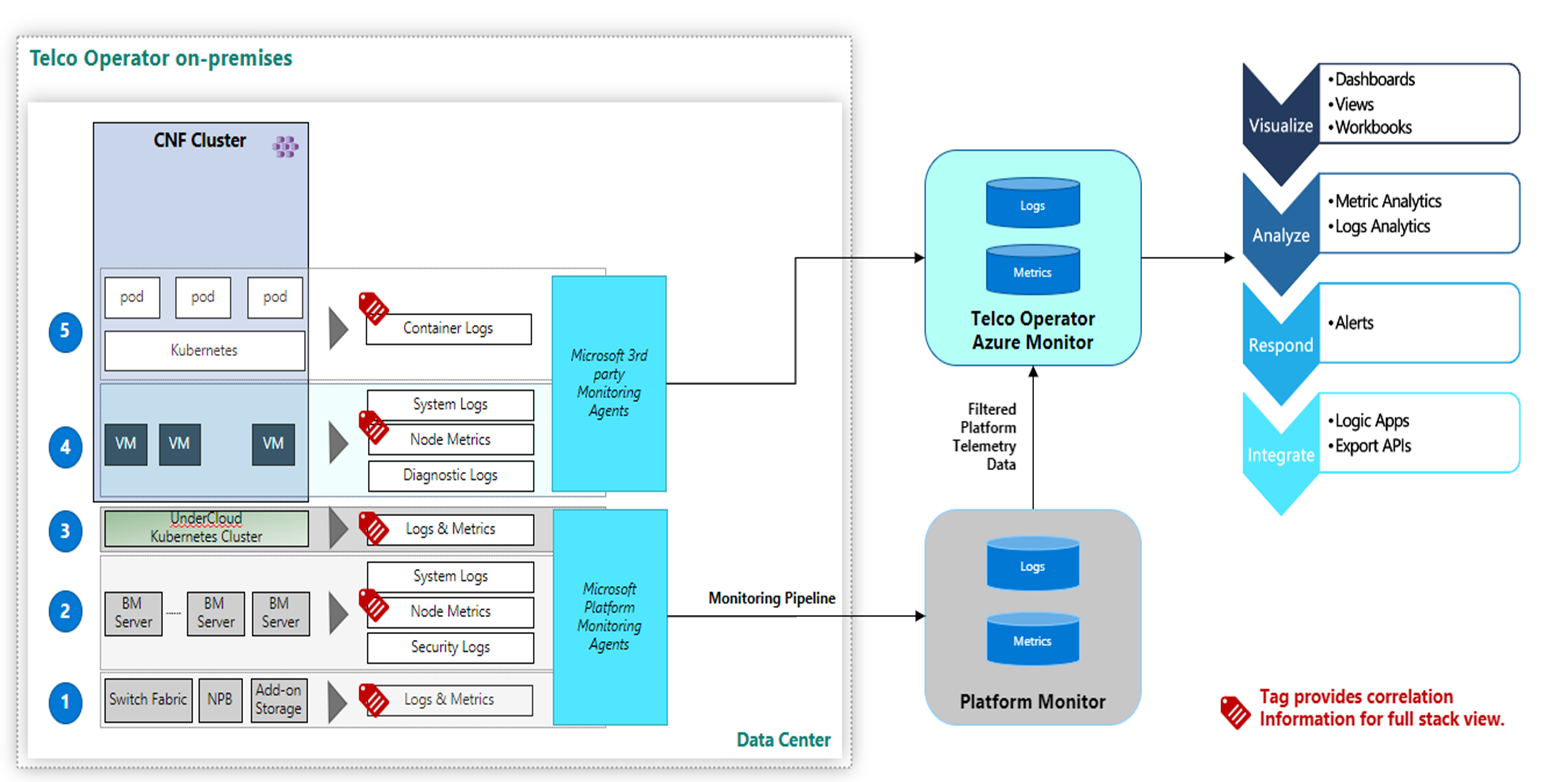
Figure: Operator Nexus Logging, Monitoring and Alerting (LMA) Framework
The key highlights of Operator Nexus observability framework are:
- Centralized data collection: Operator Nexus observability solution is based on a collection of all the data in a central place. In this place, you can observe the monitoring data from all of your on-premises instances.
- Well-defined and tested tooling: The solution relies on Azure Monitor that collects, analyzes, and acts on telemetry data from your cloud and on-premises instances.
- Easy to learn and use: The solution makes it easy for you to analyze and debug problems with the ability to search the data from within or across all of your cloud and on-premises instances.
- Visualization tools: You create customized dashboards and workbooks per your needs.
- Integrated Alert tooling: You create alerts based on custom thresholds. You can create and reuse alert templates across all of your instances.
This article helps you understand Operator Nexus observability framework that consists of a stack of components:
- Azure Monitor collects and aggregates logging data from the Operator Nexus components
- Azure Log Analytics Workspace (LAW) collects and aggregates logging data from multiple Azure subscriptions and tenants
- Analysis, visualization, and alerting are performed on the aggregated log data.
Platform Monitoring
Operator Nexus gives you visibility into the performance of your deployments that consist of infrastructure resources. You need the logs and metrics to be collected and analyzed from these platform resources. You gain valuable insights from the centralized collection and aggregation of data from all sources, compared with from dis-aggregated data.
These logs and metrics are used to observe the state of the platform. You can see the performance and analyze what's wrong. You can analyze what caused the situation. Visualization helps you configure the required alerts and under what conditions. For example, you can configure the alerts to be generated when resources are behaving abnormally, or when thresholds have been reached. You can use the collected logs and analytics to debug any problems in the environment.
Monitoring Data
Operator Nexus observability allows you to collect the same kind of data as other Azure resources. The data collected from each of your instances can be viewed in your LAW.
You can learn about monitoring Azure resources here.
Collection and Routing
Operator Nexus observability allows you to collect data for each infrastructure resource. The set of infrastructure components includes:
- Network fabric that includes CEs, TORs, NPBs, management switches, and the terminal server.
- Compute that includes Bare Metal Servers.
- Undercloud Control Plane (Kubernetes cluster responsible for deployment and managing lifecycle of overall Platform).
Collection of log data from these layers is enabled by default during the creation of your Operator Nexus instance. These collected logs are routed to your Azure Monitor LAW.
You can also collect data from the tenant layers created for running Containerized and Virtualized Network Functions. The log data that can be collected includes:
- Collection of syslog from Virtual Machines (used for either VNFs or CNF workloads).
- Collection of logs from Kubernetes clusters and the applications deployed on top.
You'll need to enable the collection of the logs from the tenant Kubernetes clusters and Virtual Machines. You should follow the steps to deploy the Azure monitoring agents. The data would be collected in your Azure LAW.
Operator Nexus Logs storage
Data in Azure Monitor Logs is stored in tables where each table has its own set of unique properties.
All resource logs in Azure Monitor have the same fields followed by service-specific fields; see the common schema.
The logs from Operator Nexus platform are stored in the following tables:
| Table | Description |
|---|---|
| Syslog | Syslog events on Linux computers using the Log Analytics agent |
| ContainerInventory | Details and current state of each container. |
| ContainerLog | Log lines collected from stdout and stderr streams for containers |
| ContainerNodeInventory | Details of nodes that serve as container hosts. |
| InsightMetrics | Metrics collected from Server, K8s, Containers. |
| KubeEvents | Kubernetes events and their properties. |
| KubeMonAgentEvents | Events logged by Azure Monitor Kubernetes agent for errors and warnings. |
| KubeNodeInventory | Details for nodes that are part of Kubernetes cluster |
| KubePodInventory | Kubernetes pods and their properties |
| KubePVInventory | Kubernetes persistent volumes and their properties. |
| KubeServices | Kubernetes services and their properties |
| Heartbeat | Records logged by Log Analytics agents once per minute to report on agent health |
Operator nexus metrics
The 'InsightMetrics' table in the Logs section contains the metrics collected from Bare Metal Machines and the undercloud Kubernetes cluster. In addition, a few selected metrics collected from the undercloud can be observed by opening the Metrics tab from the Azure Monitor menu.
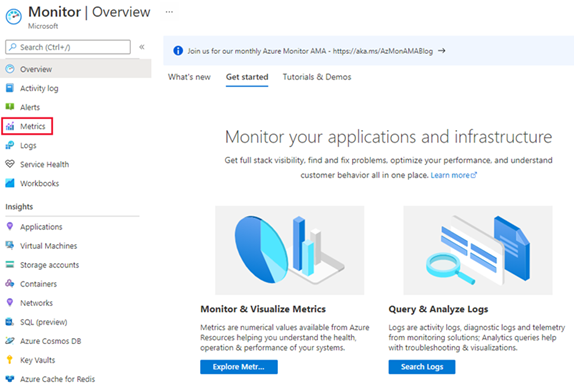
Figure: Azure Monitor Metrics Selection
See Analyze metrics with Azure Monitor metrics explorer for details on using this tool.
Workbooks
Workbooks combine text, log queries, metrics, and parameters for data analysis and the creation of multiple kinds of rich visualizations. You can use the sample Azure Resource Manager workbook templates for Operator Nexus Logging and Monitoring to deploy Azure Workbooks within your Azure LAW.
Alerts
You can use the sample Azure Resource Manager alarm templates for Operator Nexus alerting rules. You should specify thresholds and conditions for the alerts. You can then deploy these alert templates on your on-premises environment.
Log Analytic Workspace
A Log Analytics Workspace (LAW) is a unique environment to log data from Azure Monitor and other Azure services. Each workspace has its own data repository and configuration but may combine data from multiple services. Each workspace consists of multiple data tables.
A single LAW can be created to collect all relevant data or multiple workspaces based on operator requirements.
Feedback
În curând: Pe parcursul anului 2024, vom elimina treptat Probleme legate de GitHub ca mecanism de feedback pentru conținut și îl vom înlocui cu un nou sistem de feedback. Pentru mai multe informații, consultați: https://aka.ms/ContentUserFeedback.
Trimiteți și vizualizați feedback pentru