Notă
Accesul la această pagină necesită autorizare. Puteți încerca să vă conectați sau să modificați directoarele.
Accesul la această pagină necesită autorizare. Puteți încerca să modificați directoarele.
The C++ code editor and Visual Studio IDE provide many coding aids. Some are unique to C++, and some are essentially the same for all Visual Studio languages. For more information about the shared features, see Writing Code in the Code and Text Editor.
Colorization
Visual Studio colorizes syntax elements to differentiate between types of symbols such as language keywords, type names, variable names, function parameters, string literals, and so on.

Unused code (such as code under an #if 0) is more faded in color.

You can customize the colors by typing "Fonts" in Quick Launch, and then choosing Fonts and Colors. In the Fonts and Colors dialog, scroll down to the C/C++ options and then choose a custom font and/or color.
Outlining
Right-click anywhere in a source code file and choose Outlining to collapse or expand code blocks and/or custom regions to make it easier to browse only the code you're interested in. For more information, see Outlining.
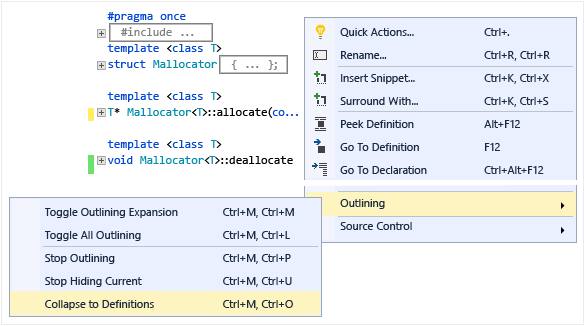
When you place your cursor in front of a curly brace, '{' or '}', the editor highlights its matching counterpart.
Other outlining options are located under Edit > Outlining in the main menu.
Line numbers
You can add line numbers to your project by going to Tools > Options > Text Editor > All Languages > General or by searching for "line num" with Quick Launch (Ctrl + Q). Line numbers can be set for all languages or for specific languages only, including C++.
Scroll and zoom
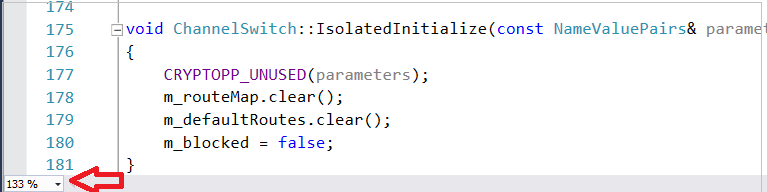
You can zoom in or out in the editor by pressing the Ctrl key and scrolling with your mouse wheel. You can also zoom by using the zoom setting in the bottom left corner.
Scrollbar Map Mode enables you to quickly scroll and browse through a code file without leaving your current location. You can click anywhere on the code map to go directly to that location.
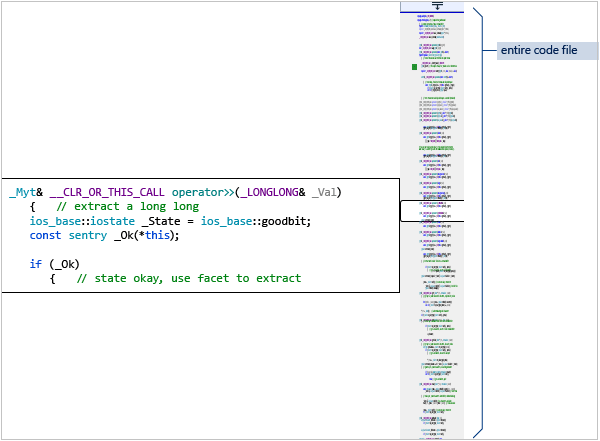
To turn on Map Mode, type "map" in the Quick Launch search box in the main toolbar and choose Use scroll map mode. For more information, see How to: Track your code by customizing the scrollbar.
When Map Mode is off, the scroll bar still highlights the changes you have made in the file. Green indicates saved changes and yellow indicates unsaved changes.
Quick Info and Parameter Info
Hover over any variable, function, or other symbol to get information about it, including the declaration, and any comments that are located just preceding it.

The Quick Info tooltip has a Search Online link. Go to Tools > Options > Text Editor > C++ > View to specify the search provider.
If there's an error in your code, you can hover over it, and Quick Info will display the error message. You can also find the error message in the Error List window.


If there's an error in your code, you can hover over it, and Quick Info will display the error message. You can also find the error message in the Error List window.
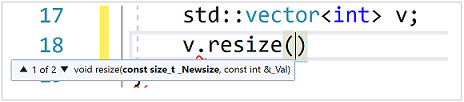
When you call a function, Parameter Info shows the types of parameters and the order in which they're expected.
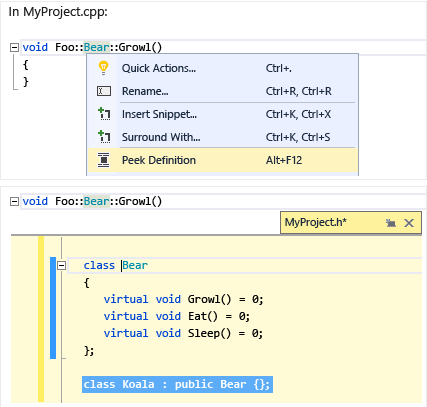
Peek Definition
Hover over a variable or function declaration, right-click, then choose Peek Definition to see an inline view of its definition without navigating away from your current location. For more information, see Peek Definition (Alt+F12).
F1 Help
Place the cursor on or just after any type, keyword or function and press F1 to go directly to the relevant reference topic on Microsoft Learn. F1 also works on items in the error list and in many dialog boxes.
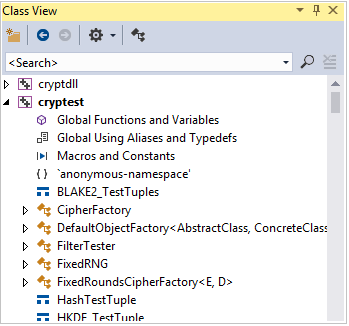
Class View
Class View displays a searchable set of trees of all code symbols and their scope and parent/child hierarchies, organized on a per-project basis. You can configure what Class View displays from Class View Settings (click the gear box icon at the top of the window).
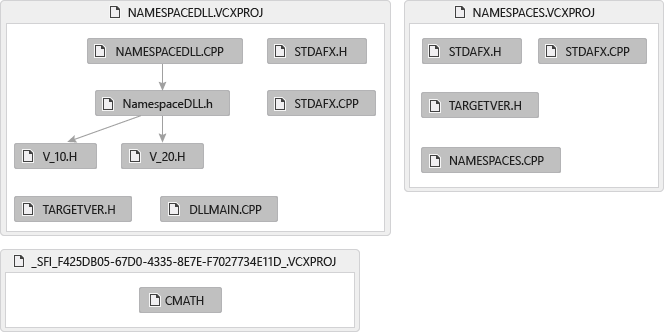
Generate graph of include files
Right click on a code file in your project and choose Generate graph of include files to see a graph of which files are included by other files.
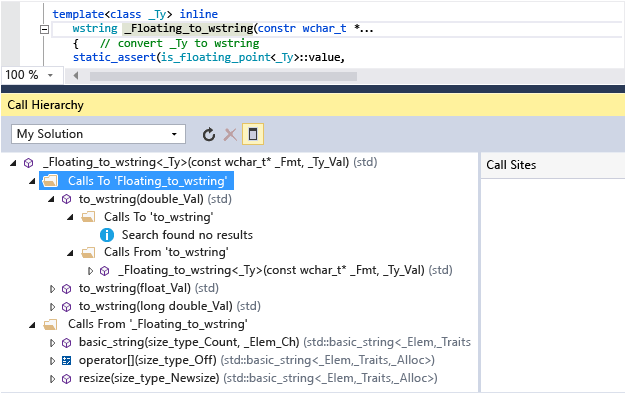
View Call Hierarchy
Right click on any function call and view a recursive list of all the functions that it calls, and all the functions that call it. Each function in the list can be expanded in the same way. For more information, see Call Hierarchy.
See also
Edit and refactor code (C++)
Navigate your C++ code base in Visual Studio
Collaborate with Live Share for C++