Notă
Accesul la această pagină necesită autorizare. Puteți încerca să vă conectați sau să modificați directoarele.
Accesul la această pagină necesită autorizare. Puteți încerca să modificați directoarele.
Applies to: ✅ SQL analytics endpoint and Warehouse in Microsoft Fabric
Fabric Data Warehouse uses a consumption-based model that measures the compute resources allocated to warehouse workloads over time.
This article explains how warehouse consumption is measured and how billing is calculated. For more information on monitoring utilization, see How to: Observe Fabric Data Warehouse utilization trends.
How warehouse consumption is measured
In the capacity-based SaaS model, Fabric Data Warehouse consumption is measured based on the compute resources allocated to support workload activity.
Fabric allocates compute resources to the workload during read and write activity against a warehouse, and read activity against the SQL analytics endpoint of a lakehouse.
Fabric Data Warehouse measures consumption using vNodes (virtual nodes). A vNode is a collection of four vCores and serves as the unit of resource allocation and consumption measurement. For information about the CU consumption rate associated with warehouse compute resources, see Fabric Operations. As workload demand changes, Fabric dynamically allocates and releases vNodes.
Compute resources are allocated using a one-minute baseline allocation window. Consumption is then measured and reported per second based on the number of allocated vNodes. As workload demand increases or decreases, vNode allocations adjust accordingly.
Understand the billing model
Conceptually, you can understand warehouse consumption as: Consumption = Active vNodes × Active Time.
This simplified model helps explain consumption behavior. Actual reporting reflects the compute resources allocated over time across warehouse operations.
Warehouse automatically scales compute resources in response to workload demand. The Fabric capacity SKU determines the burstable vNode resources available to warehouse workloads.
Warehouse operation categories
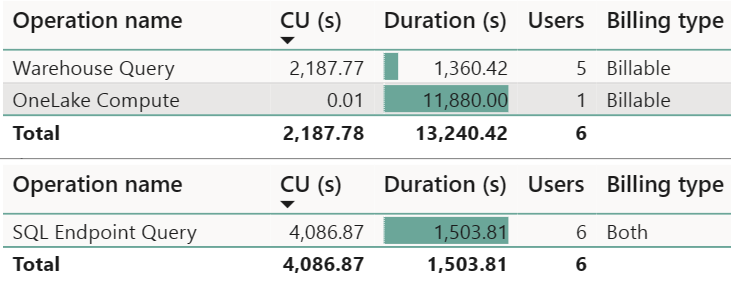
You can analyze universal compute capacity usage by workload category, across the tenant. Fabric tracks usage by total Capacity Unit Seconds (CUs). The table displayed shows aggregated usage across the last 14 days.
Both the Warehouse and SQL analytics endpoint roll up under Warehouse in the Metrics app, as they both use SQL compute. The operation categories you see in this view are:
- Warehouse Query: Compute charge for all user-generated and system-generated T-SQL statements within a warehouse.
- SQL Endpoint Query: Compute charge for all user-generated and system-generated T-SQL statements within a SQL analytics endpoint.
- Warehouse Snapshot Query: Compute charge for all user generated and system generated T-SQL statements on a warehouse snapshot.
For example:
Timepoint explore graph
This graph in the Microsoft Fabric Capacity Metrics app shows utilization of resources compared to capacity purchased. 100% of utilization represents the full throughput of a capacity SKU and is shared by all Fabric workloads. This value is represented by the yellow dotted line. Selecting a specific timepoint in the graph enables the Explore - TimePoint Detail button, which opens a detailed drill-through page.
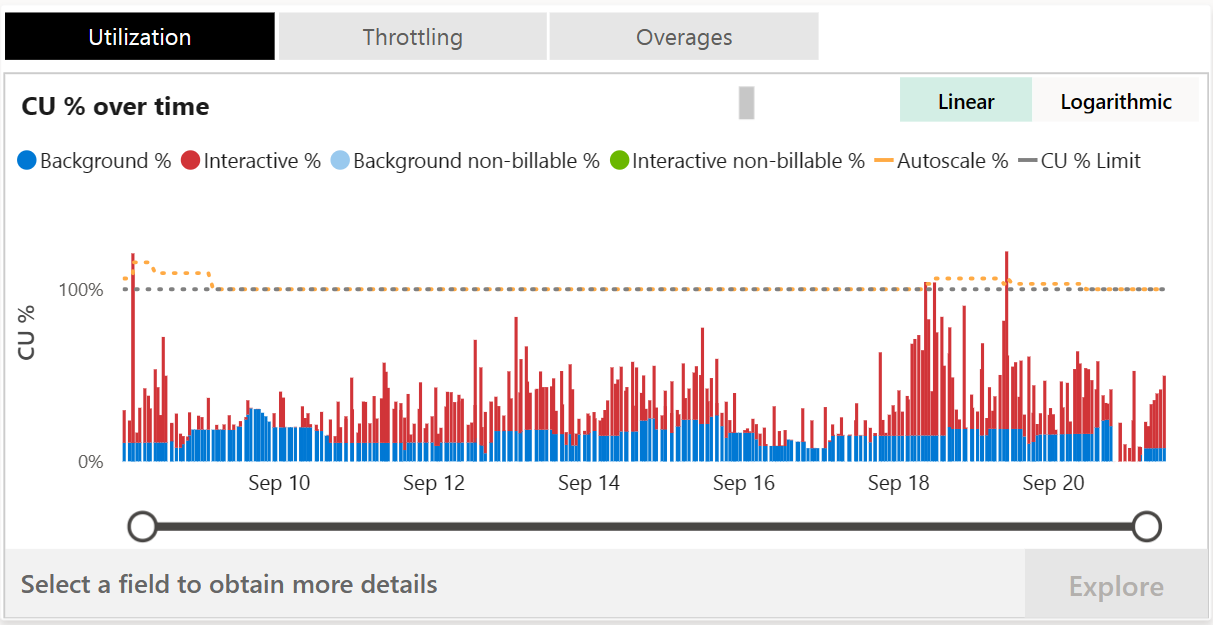
In general, similar to Power BI, operations are classified either as interactive or background, and denoted by color. Most operations in the Warehouse category are reported as background to take advantage of 24-hour smoothing of activity to allow for the most flexible usage patterns. Classifying warehouse activity as background reduces the frequency of peaks of CU utilization from triggering throttling.
Timepoint drill-through graph
The timepoint drill-through table in the Microsoft Fabric Capacity Metrics app provides a detailed view of utilization at specific timepoints. It shows the amount of capacity that the given SKU provides for each 30-second period, along with a breakdown of interactive and background operations. The interactive operations table lists the operations that run at that timepoint.
The Background operations table might appear to display operations that ran much earlier than the selected timepoint. This discrepancy occurs because background operations in a shared capacity (F SKU) undergo 24-hour smoothing. For example, the table displays all operations that ran and are still smoothing at the selected timepoint.
Top use cases for this view include:
Determine whether consumption is driven by user-initiated or system-initiated workloads.
- Examples of user-initiated workloads include running T-SQL queries or interacting with the Fabric portal, such as using the SQL Query Editor or Visual Query Editor.
- Examples of system-initiated workloads include data compaction and other background tasks that run automatically to optimize performance and improve query execution.
Identify the time periods that consumed the most resources.
- Sort the table by Total CU(s) in descending order to identify the most expensive time periods. Capture the corresponding Start and End timestamps.
- To identify queries that ran during the selected interval, use T-SQL queries on Query Insights views, specifically query insights.exec_requests_history. For example, to identify queries that were running during a specific interval:
DECLARE @Start_Time DATETIME2(0) = '2026-08-10 8:00:00'
        ,@End_Time DATETIME2(0) = '2026-08-10 9:00:00'

SELECT
        [database_name],
        sql_pool_name,
        distributed_statement_id,
        login_name,
        allocated_cpu_time_ms / 1000.0 AS vcore_seconds
FROM queryinsights.exec_requests_history
WHERE start_time < @End_Time
AND end_time > @Start_Time;
Monitor warehouse consumption
You can analyze warehouse consumption by using both the Fabric Capacity Metrics app and Query Insights. These tools answer different but complementary questions.
Fabric Capacity Metrics app
Use Capacity Metrics to understand:
- Warehouse consumption trends.
- Periods of high utilization.
- Consumption across workspaces and items.
- Consumption relative to other Fabric workloads on the same capacity.
- Time windows that might require investigation.
Capacity Metrics is the primary tool for determining when consumption occurred and how much consumption was reported during a given period.
Query Insights
Use Query Insights to understand:
- Which queries were active during periods of consumption.
- Which usage patterns were associated with activity.
- Query execution characteristics that might explain increased utilization.
- Potential workload optimization opportunities.
Query Insights helps explain what was running while Capacity Metrics helps identify when consumption occurred. Together, they provide a more complete picture of warehouse utilization.
Considerations
Consider the following usage reporting nuances:
- Cross database reporting: When a T-SQL query joins across multiple warehouses (or across a Warehouse and a SQL analytics endpoint), usage is reported against the originating resource.
- Queries on system catalog views and dynamic management views are billable queries.
Investigate unexpected consumption
To investigate a period of unexpected warehouse consumption:
- Identify the time window in Capacity Metrics.
- Review warehouse utilization during that period.
- Use T-SQL queries on Query Insights and warehouse dynamic management views (DMVs) to evaluate the associated activity.
- Determine whether utilization was related to user workloads, concurrency, or system-generated operations.
- Identify opportunities to optimize workload patterns or query performance.
- Consider features like warehouse workload management and data clustering.
- Review Performance guidelines in Fabric Data Warehouse.
Frequently asked questions
What is a vNode?
A virtual node (vNode) is the unit of warehouse compute used for resource allocation and consumption measurement.
Does background activity consume capacity?
Yes. Consumption can include both user-generated activity and system-generated operations such as maintenance and optimization tasks.
How does concurrency affect consumption?
As concurrent workload demand increases, Fabric might allocate extra vNodes. Increased allocation can result in higher consumption.
Where can I monitor warehouse consumption?
Use the Fabric Capacity Metrics app to understand consumption and utilization trends. Use Query Insights and T-SQL queries on DMVs to analyze the activity associated with those periods.