Evenimente
Campionatele Mondiale Power BI DataViz
14 feb., 16 - 31 mar., 16
Cu 4 șanse de a intra, ai putea câștiga un pachet de conferință și ai putea ajunge la Marea Finală LIVE din Las Vegas
Aflați mai multeAcest browser nu mai este acceptat.
Faceți upgrade la Microsoft Edge pentru a profita de cele mai noi funcții, actualizări de securitate și asistență tehnică.
APPLIES TO: ![]() Power BI service for business users
Power BI service for business users ![]() Power BI service for designers & developers
Power BI service for designers & developers ![]() Power BI Desktop
Power BI Desktop ![]() Requires Pro or Premium license
Requires Pro or Premium license
This article explains how to use the report Filters pane in the Power BI service. You can use filters to discover new insights in your data.
There are many different ways to filter data in Power BI. For example, you can filter data by selecting data points on a report visual to filter other visuals on the page—this is called cross-filtering and cross-highlighting. For more information, see How visuals cross-filter each other in a Power BI report.

When a colleague shares a report with you, make sure to look for the Filters pane. Sometimes it's collapsed along the right edge of the report. Select the Filers pane to expand it.
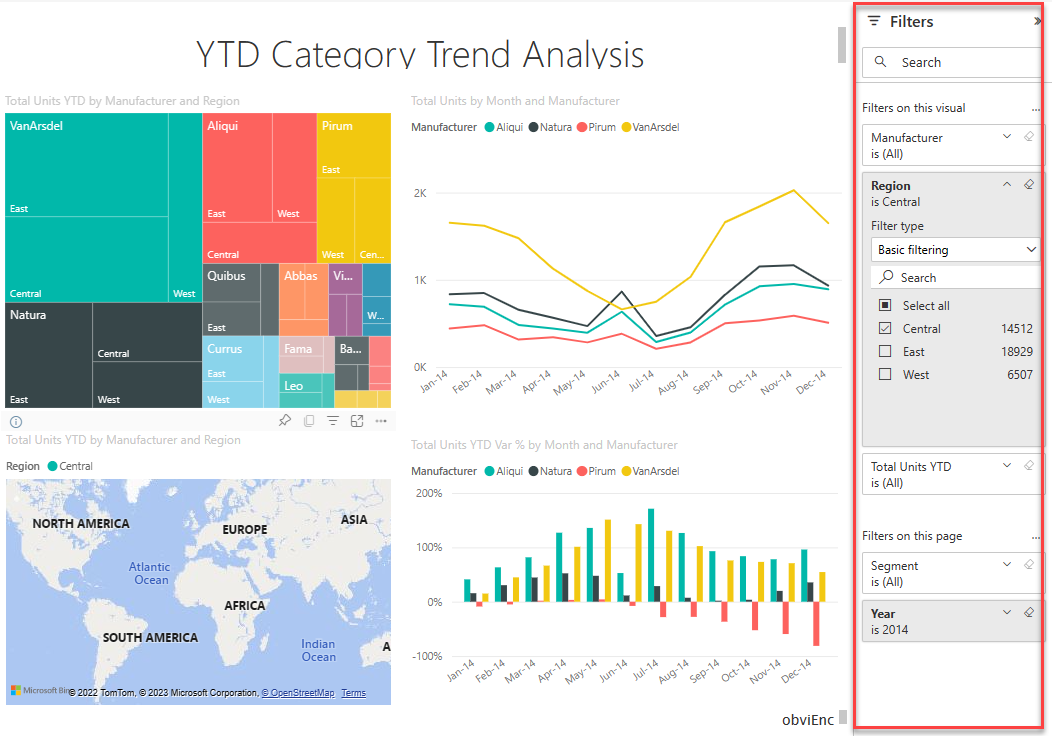
The Filters pane contains filters that the report designer adds to the report. Business users can interact with the existing filters and save changes. However, they can't add new filters to the report. In the previous example, the designer added three page-level filters: Segment is All, Year is 2014, and Region is Central. You can interact and change these filters, but you can't add a fourth page-level filter.
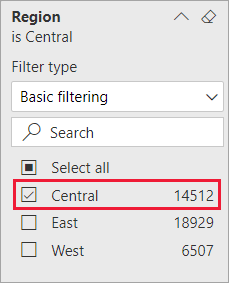
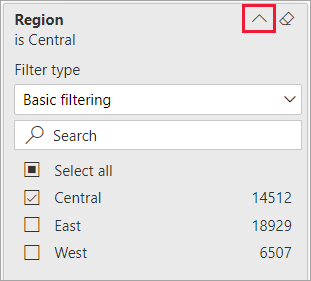
Some of the filters are shaded, and some aren't. If a filter is shaded, it means a filter has been applied, and some data is excluded. In the following example, the Region filter card is shaded and expanded. The Central option is the only option selected from the dropdown. Since Region is under the Filters on this page heading, all visuals on this page aren't displaying. The data from West and East regions are excluded.
In the Power BI service, reports keep any changes you make in the Filters pane. The service carries those changes through to the mobile version of the report.
To reset the Filters pane to the designer's defaults, select the Reset icon from the top menu bar.
![]()
Notă
If you don't see the Reset to default option, the report designer might have disabled it. The designer can lock specific filters so that you can't change them.
The Filters pane displays all filters added by the designer to the report. The Filters pane is also the area where you can view information about the filters and interact with them. You can save changes or use Reset to default to revert to the original filter settings.
If there are changes you'd like to save, you can also create a personal bookmark. For more information, see Bookmarks in the Power BI service.
The Filters pane displays and manages several types of report filters: report, report page, and visual.
In the following example, you can see a visual that has three filters: Manufacturer, Month, and Total units. The report page also has filters listed under the Filters on this page heading. The entire report has a filter for Date, listed under Filters on all pages.
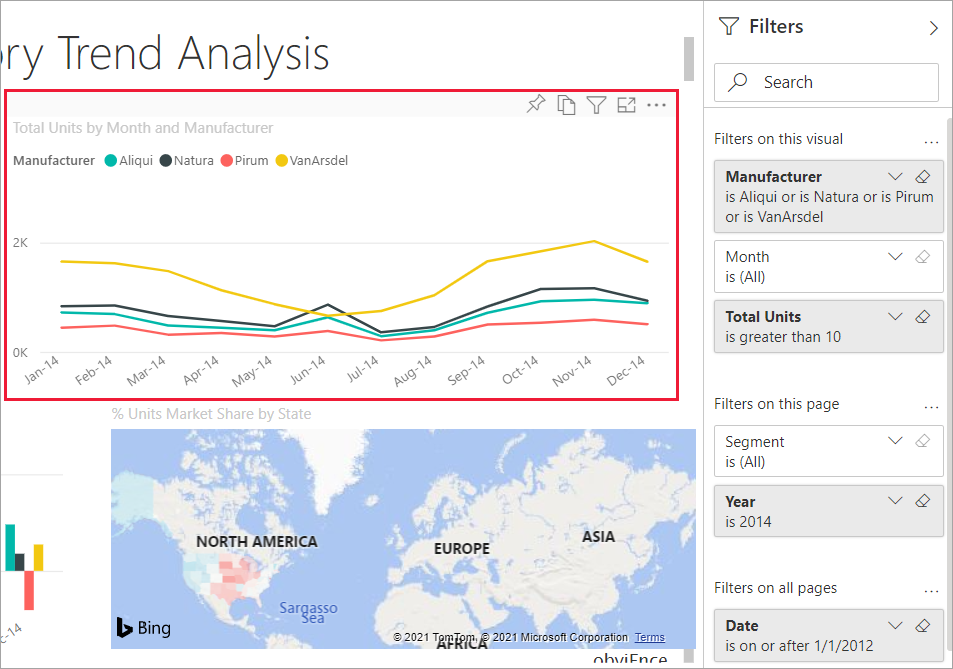
Some of the filters have (All) next to them. (All) means all values are being included in the filter. In the previous screenshot, Segment(All) tells us this report page includes data about all the product segments.
Anyone with permissions to view this report can interact with these filters.
To get a closer look at the filters affecting a specific visual, hover over the visual to reveal the filter icon ![]() . Select that filter icon to see a pop-up window with all the filters and slicers affecting that visual. The filters in the pop-up window are the same filters displayed on the Filters pane, plus any other filters affecting the selected visual.
. Select that filter icon to see a pop-up window with all the filters and slicers affecting that visual. The filters in the pop-up window are the same filters displayed on the Filters pane, plus any other filters affecting the selected visual.
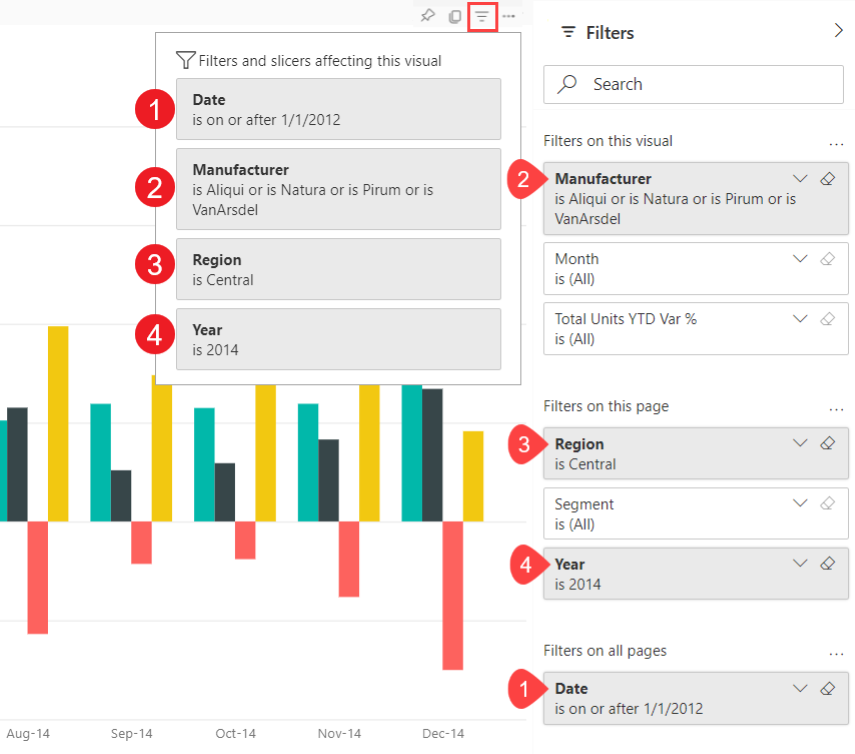
Types of filters in the pop-up window include:
In this example:
Date is a filter applied to all pages in this report.
Manufacturer is VanArsdel, Natura, Aliqui, or Pirum is a filter applied to this visual.
Region is Central and Year is 2014 are filters applied to this report page.
Year is a filter applied on this report page.
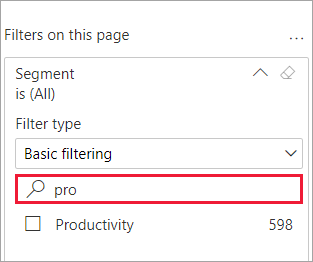
Sometimes a filter can have a long list of values. Use the search box to find and select the value you want.
To understand a filter, expand it and look at the available values and counts. To expand the filter, select the arrow next to the filter name.
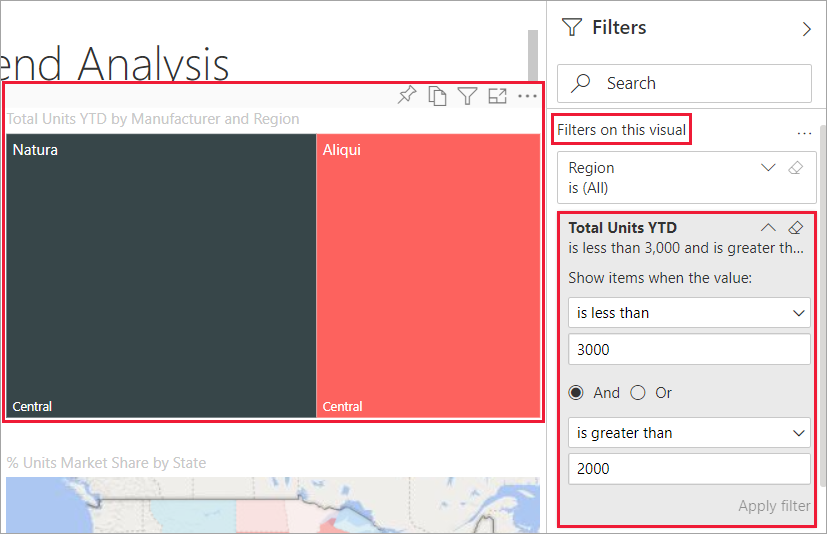
One way to search for data insights is to interact with the filters. You can change filter selections by using the drop-down arrow next to the field name. Depending on the filter and type of data that Power BI is filtering, your options range from simple selections from a list, to identifying ranges of dates or numbers. See the advanced filter example. Notice the change in the Total Units YTD filter on the treemap between 2,000 and 3,000. This change removes Pirum and VanArsdel from the treemap.
Sfat
To select more than one filter value at a time, hold down the CTRL key. Most filters support multi-select.
If you don't want to keep the changes you've made to the filters, select the Reset icon from the top menu bar. This selection reverts the filters to their original state, as set by the report designer.
![]()
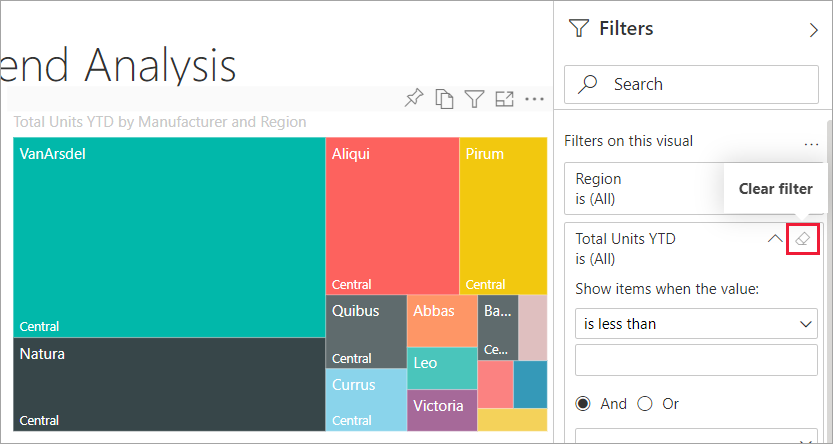
To reset a filter to (All), clear it by selecting the eraser icon next to the filter name.
Evenimente
Campionatele Mondiale Power BI DataViz
14 feb., 16 - 31 mar., 16
Cu 4 șanse de a intra, ai putea câștiga un pachet de conferință și ai putea ajunge la Marea Finală LIVE din Las Vegas
Aflați mai multeInstruire
Modul
Configure Power BI report filters - Training
Report filtering is a complex topic because many techniques are available for filtering a Microsoft Power BI report. However, with complexity comes control, allowing you to design reports that meet requirements and expectations.
Certificare
Certificat Microsoft: Asociat analist de date Power BI - Certifications
Demonstrați metode și cele mai bune practici care se aliniază cu cerințele de afaceri și tehnice pentru modelarea, vizualizarea și analiza datelor cu Microsoft Power BI.
Documentație
Using slicers in the Power BI service - Power BI
A Power BI slicer is an alternate way of filtering that narrows the portion of the semantic model shown in the other visualizations in a report.
Understand how visuals interact in a report - Power BI
Learn about how Power BI visuals interact on a report page by cross-filtering and cross-highlighting data.
Change the display size and ratio of a report page - Power BI
Learn how to change the display settings for a page in a Power BI report by using the View menu or browser settings.