Walkthrough - Using Apple's Instruments Tool
This article walks through how to use Apple’s Instruments tool to diagnose memory issues in an iOS application built with Xamarin. It demonstrates how to launch Instruments, take heap snapshots and analyze memory growth. It also shows how to use Instruments to display and pinpoint the exact lines of code that cause the memory issue.
This page demonstrates how to use Xcode's Instruments tool to diagnose a memory issue in an iOS application.
Diagnosing the Memory Issues
From Visual Studio for Mac, launch Instruments from the Tools > Launch Instruments menu item.
Upload the application to the device by choosing the Run > Upload to Device menu item.
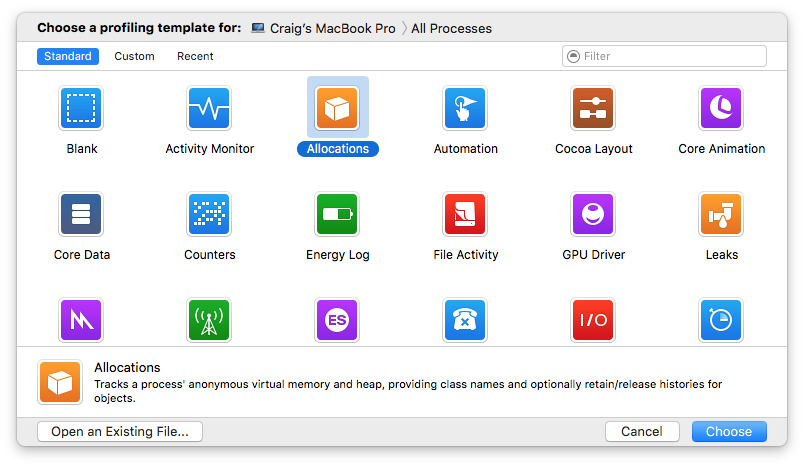
Choose the Allocations template (orange icon with white box)
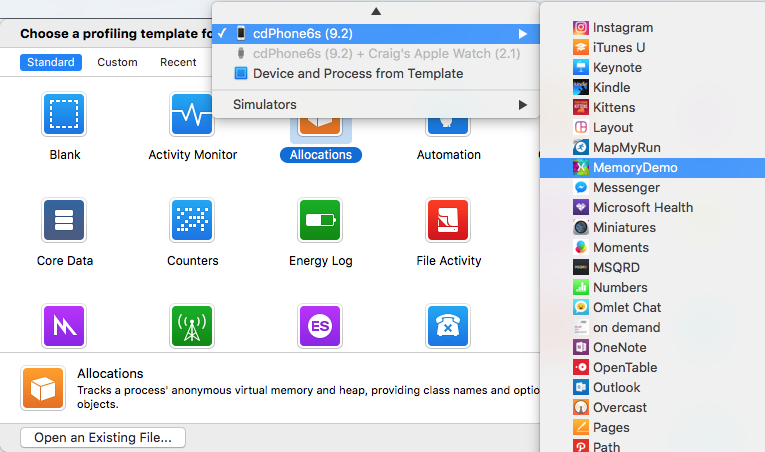
Select the Memory Demo application in the Choose a profiling template for: list at the top of the window. Click on the iOS device first to expand the menu that shows installed applications.
Press Choose button (bottom right of window) to start Instruments. ThiJs template will show two items in the top pane: Allocations and VM Tracker.
Press the Record button (red circle at the top-left) in Instruments, which will launch the application.
Select the VM Tracker row in the top pane (now that the app is running, it will contain two sections: Dirty and Resident Size). In the Inspector pane, choose the Show Display Settings option (the gear icon) then tick the Automatic Snapshotting checkbox, shown in the bottom-right of this screenshot:
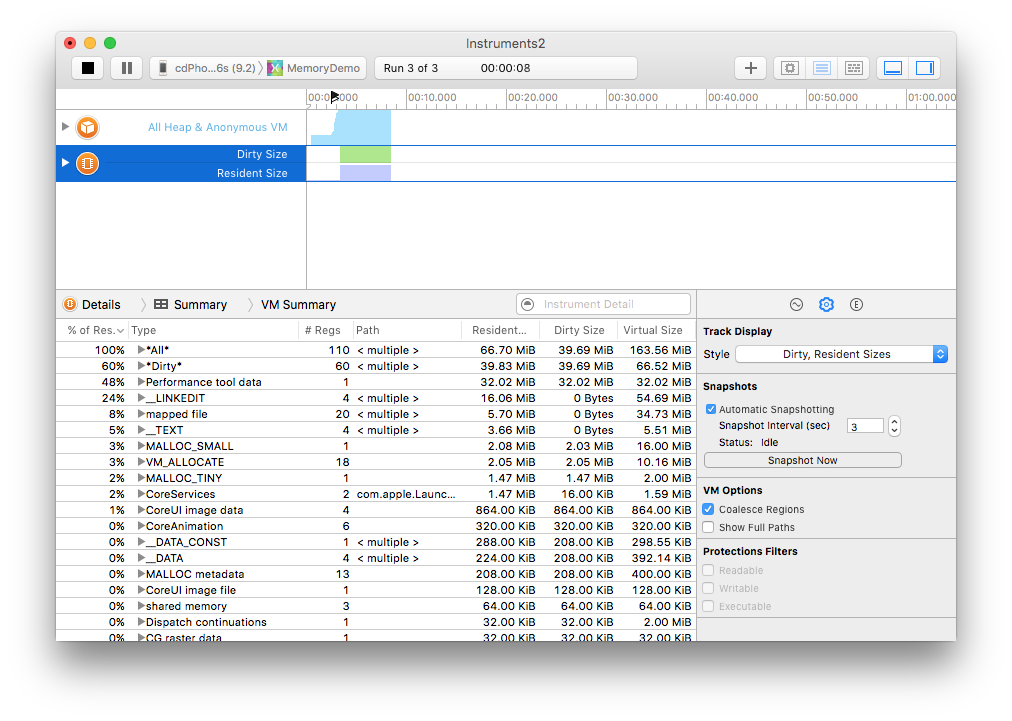
Select Allocations row in the top pane (now that the app is running, it will say All Heap and Anonymous VM)
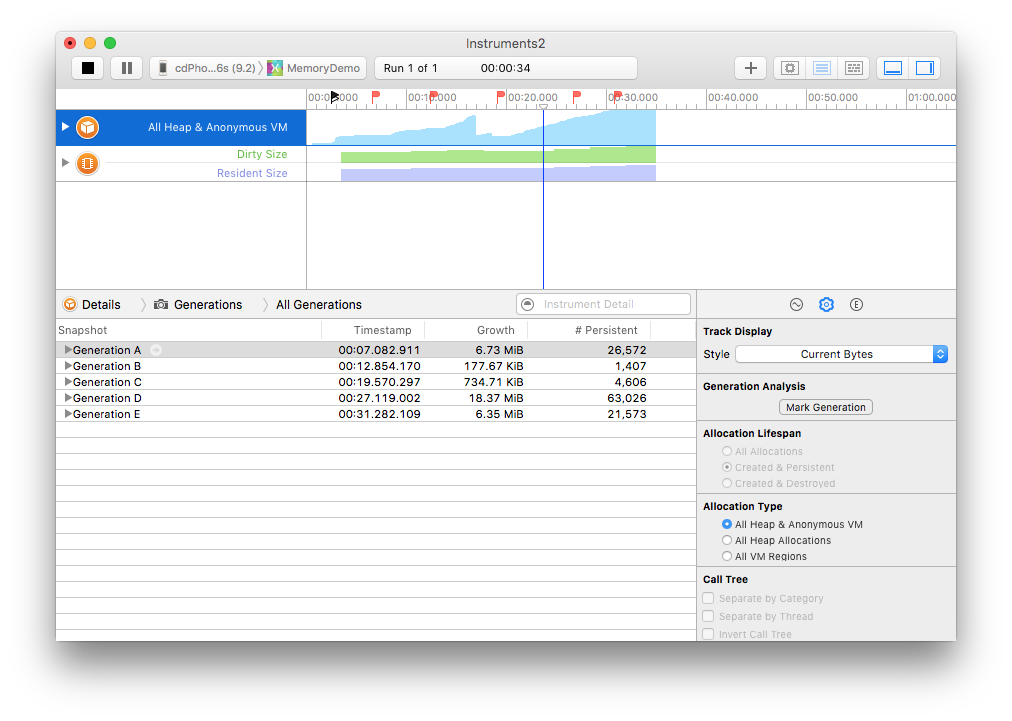
In the Inspector pane, choose the Show Display Settings option (the gear icon) then click the press Mark Generation button to establish a baseline. A small red flag will appear in the timeline at the top of the window
Scroll the application, then select Mark Generation again (repeat a few times)
Click the Stop button.
Expand the Generation node with the largest Growth and sort by Growth (descending).
Change the Inspector pane to Show Extended Detail (the "E"), which shows the Stack Trace.
Notice the <non-object> node shows excessive memory growth. Click the arrow next to this node to see more details - right click in the stack trace to add Source Location to the pane:
Sort by Size and display the Extended Detail view:
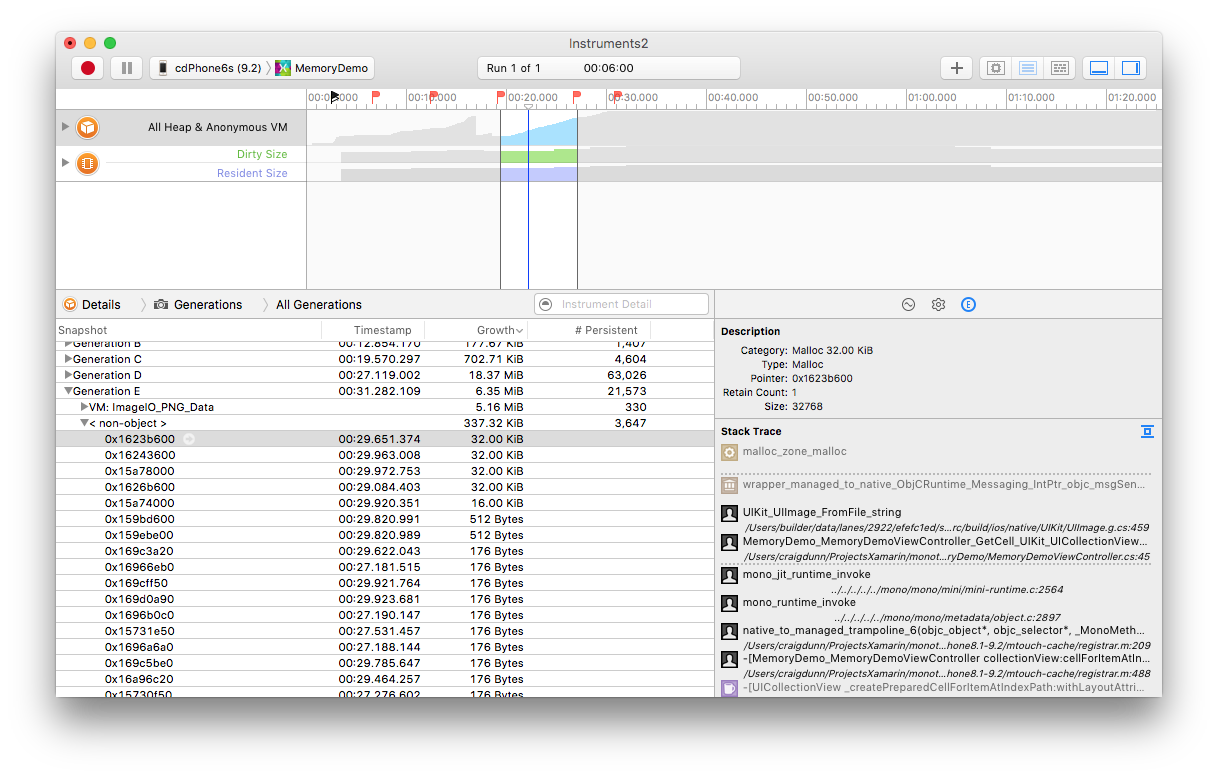
Click on the desired entry in the call stack to see the related code:
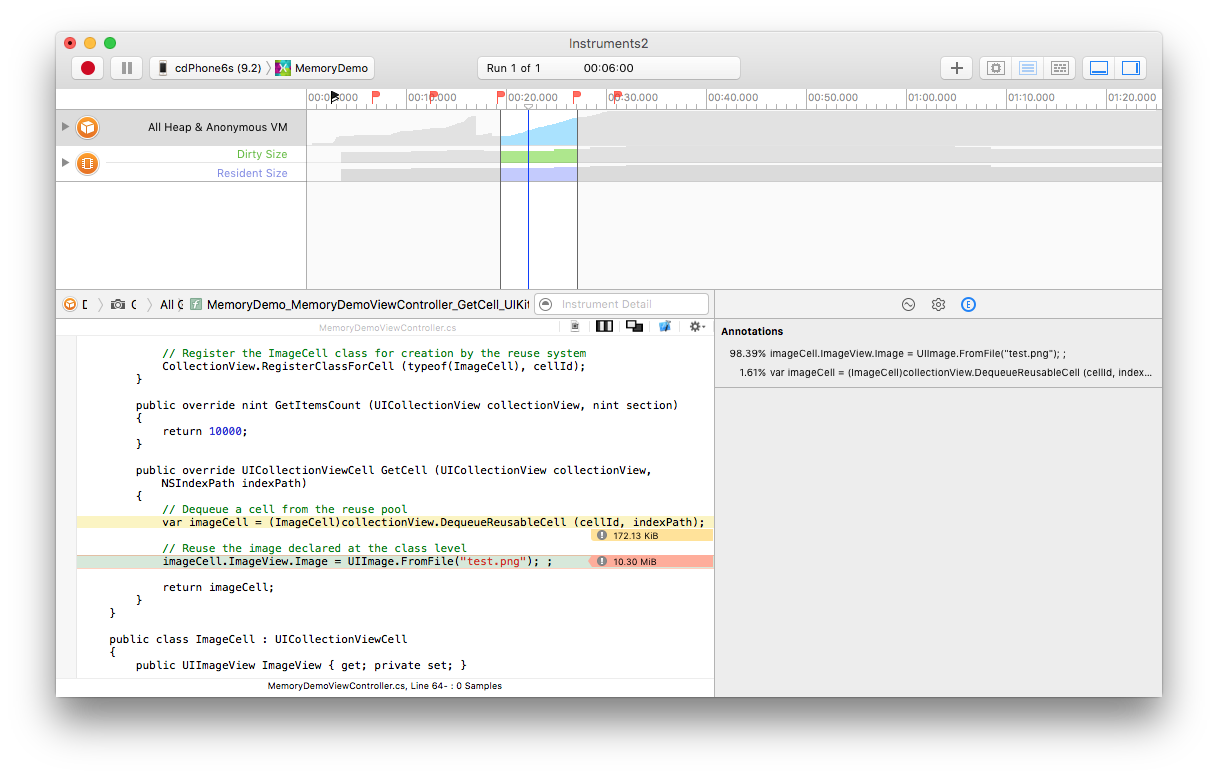
In this case, a new image is created and stored in a collection for each cell, nor are the existing collection view cells being reused.
Resolving the Memory Issues
It is possible to resolve these issues and rerun the application through Instruments.
By declaring a single instance at the class level, the image can be reused and the cell object can be reused from an existing pool instead of being created every time, as shown below:
public override UICollectionViewCell GetCell (UICollectionView collectionView, NSIndexPath indexPath)
{
    // Dequeue a cell from the reuse pool
    var imageCell = (ImageCell)collectionView.DequeueReusableCell (cellId, indexPath);

    // Reuse the image declared at the class level
    imageCell.ImageView.Image = image;

    return imageCell;
}
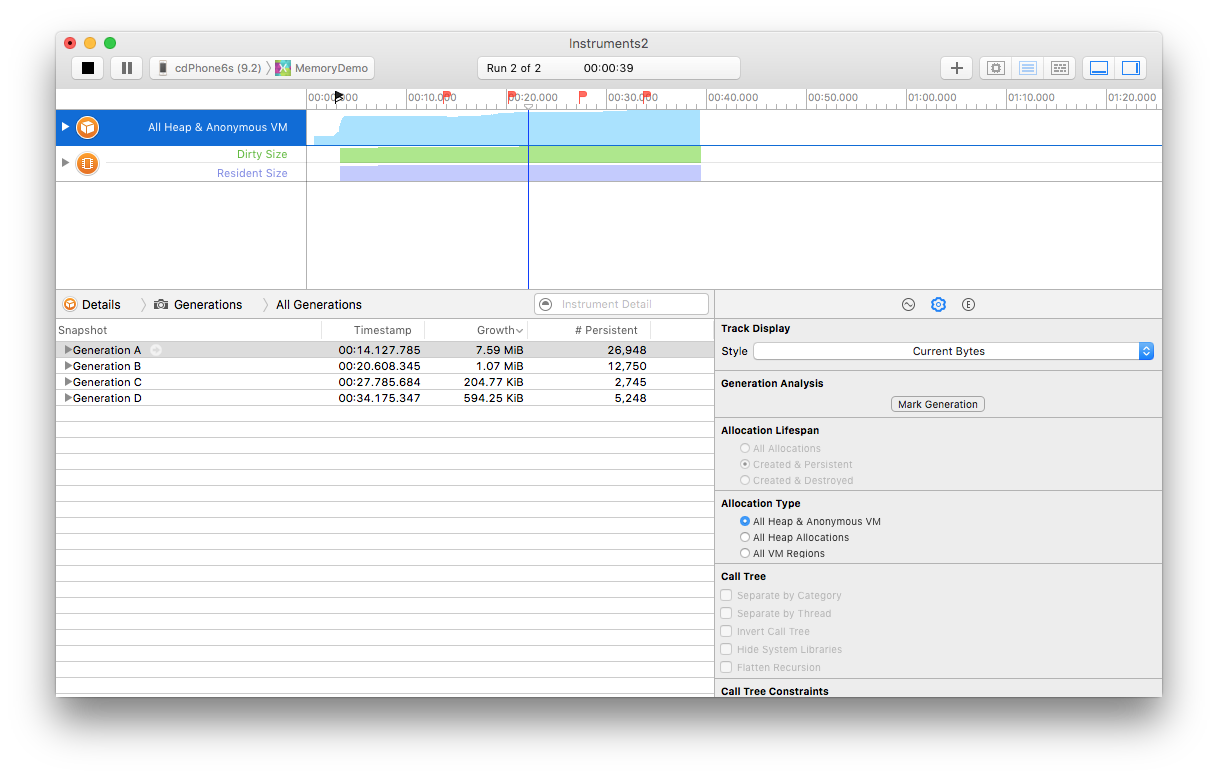
Now, when the application is run, memory usage is greatly reduced -- the Growth between generations is now measured in Kib (kilobytes) rather than MiB (megabytes) as it was before fixing the code:
The article Xamarin.iOS Garbage Collection is a useful reference for dealing with memory issues with Xamarin.iOS.
Summary
This article demonstrated how to use Instruments to diagnose memory issues. It described how to launch Instruments from within Visual Studio for Mac, load the memory allocation template, and step use snapshots to pinpoint memory issues. Finally, the application was re-examined to verify the problem was corrected.