Getting Started with FSharp.Charting (was called FSharpChart)
[ Update: the latest version of the FSharp.Charting can now be found here. See the new documentation. Further information on the F# Community can be found at fsharp.org ]
Hi, I'm Keith Battocchi, and I'm working on making it easier to use F# for data-rich programming. In my first blog post, I want to highlight some of the basic features of the FSharpChart wrappers that Don blogged about earlier this month. As Don mentioned, this library contains F#-friendly wrappers for the types in the System.Windows.Forms.DataVisualization.Charting namespace, making it easy to interactively chart data from F# Interactive (see also the Chart Controls section of MSDN for further information about the underlying controls themselves, including tutorials). To get started, load the library script and open the Samples.Charting namespace:
#load "FSharpChart.fsx"
open Samples.Charting
Basic features
All of the chart types in the System.Windows.Forms.DataVisualization.Charting namespace are supported, from the common Line and Bar charts to the more exotic Kagi and Renko charts, among many others. Each type of chart can be created by using static methods on the FSharpChart type, which you can browse in IntelliSense:
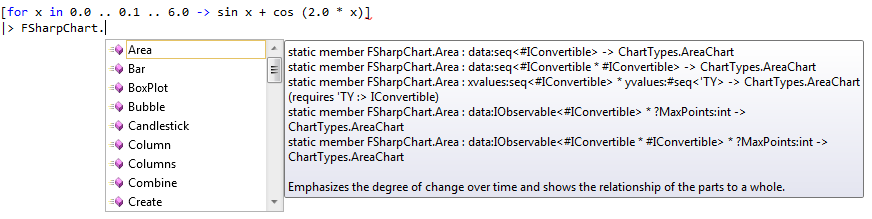
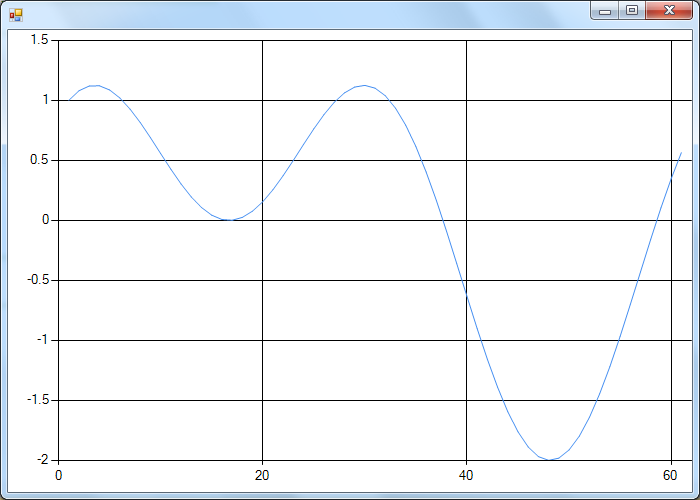
These methods make it easy to directly pipe data into a chart. Furthermore, the FSharpChart library adds a custom printer to F# Interactive which automatically opens each chart control in its own window. For example, executing
[for x in 0.0 .. 0.1 .. 6.0 -> x, sin x + cos (2.0 * x)]
|> Chart.Line
in FSI will create the following window:
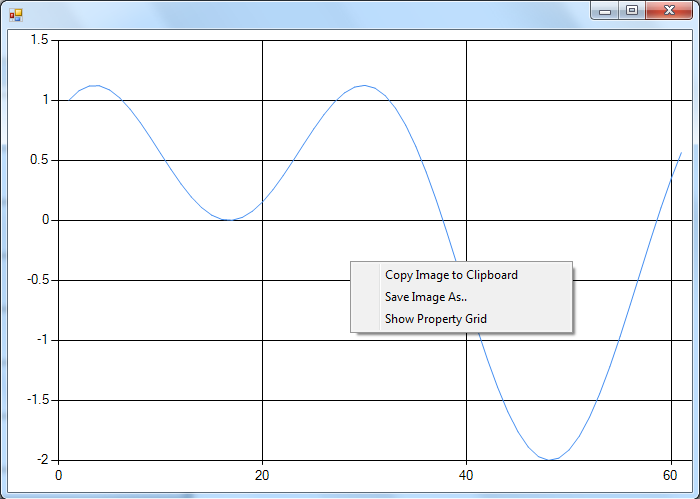
Each chart control also has a context menu which makes it easy to copy the chart to the clipboard, save to a file, or view (and modify) detailed chart properties:
Series
The overloaded chart creation methods allow data to be specified in many different ways. In particular, most charts allow data to be specified by any of the following mechanisms:
- Just a sequence of y-values (with x-values implicitly running from 1 to the number of elements, as with the charts above)
- Separate sequences of x- and y-values
- A sequence of (x,y) pairs
- A System.IObservable of y-value or (x,y) pairs, allowing the chart to be updated in real time as additional data is observed
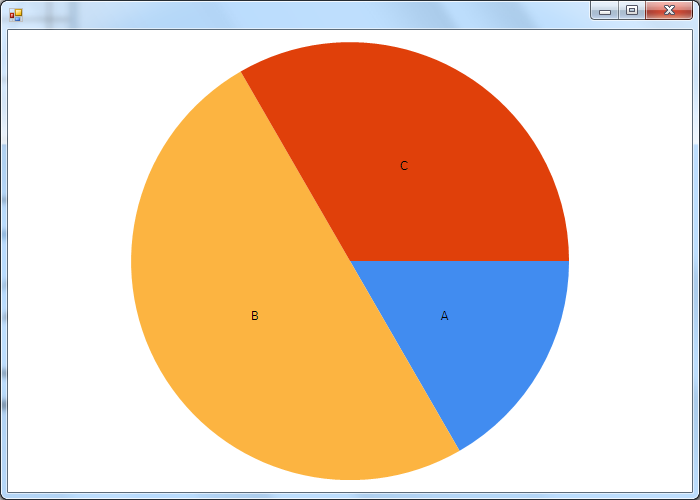
Furthermore, x and y values aren't limited to floating point numbers - they just need to be values of a type implementing the System.IConvertible interface. This means that it's easy to create charts where data is broken down into named categories:
[("A",1); ("B",3); ("C",2)]
|> Chart.Pie
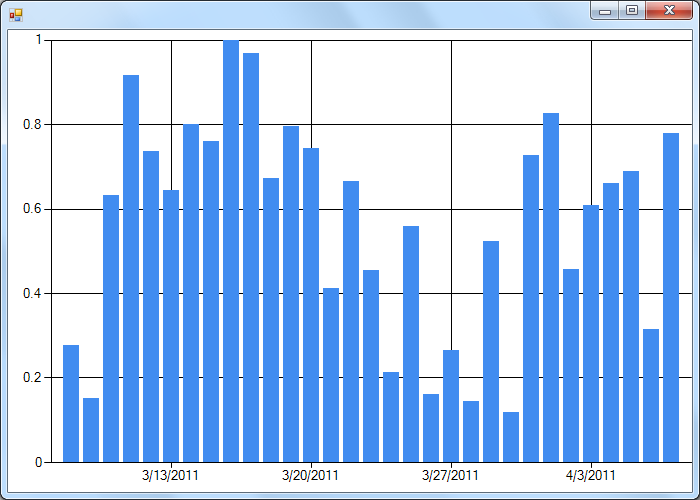
It's equally easy to plot values against dates or times:
open System
let r = Random()
[for d in -30 .. 0 ->
(DateTime.Today.AddDays(float d), r.NextDouble())]
|> Chart.Column
Hopefully this is enough information to get you started using the FSharpChart library in F# for interactive visualization. I'll be writing about some more advanced features in my next blog post. Until then, happy charting!
Comments
Anonymous
April 26, 2011
Great info, thanks We're currently using Zedgraph and very happy with it, but this looks even more frictionless Intrepid note: What we are all really curious about are the announced posts on Type Providers of course :-)Anonymous
April 29, 2011
How do you save a chart? THe F# team say: right-click and copy to clipboard. We're working on alternative save formats.Anonymous
April 30, 2011
I mean, how do you save a chart programmatically ;)Anonymous
May 10, 2011
Looks great. What about three dimensional graphs?Anonymous
June 24, 2011
If you want to save a chart programmatically or render 3D charts check out the latest release of the code, both of which are now supported: blogs.msdn.com/.../fsharpchart-new-features-and-code-drop-availability.aspxAnonymous
July 03, 2011
If you check out the latest version of FSharpChart (blogs.msdn.com/.../fsharpchart-new-features-and-code-drop-availability.aspx) both 3D charts and programmatic clipboard copying and saving of charts are supported.Anonymous
July 11, 2011
This is great, thanks. Am I right in assuming that the reference to open Samples.Charting should now be replaced by open MSDN.FSharp.Charting?Anonymous
August 18, 2011
The comment has been removedAnonymous
September 21, 2011
Try this: FSharpChart.Combine [ FSharpChart.Line([ for f in 0.0 .. 0.1 .. 10.0 -> sin f ], Name = "Sin Wave") FSharpChart.Line([ for f in 0.0 .. 0.1 .. 10.0 -> cos f ], Name = "Cosine Wave") ]Anonymous
August 12, 2012
The comment has been removedAnonymous
April 29, 2013
This is awesome. Can we Engineers please have 3D (surface) plotting capability? Then we can get rid of Matlab.