Debugging LINQ
I recently recorded a screencast on Javascript debugging (haven't put it up yet, watch this space) but one of the things that I covered was debug visualizers, which are a great alternative to the text-only property-name/value way of viewing state when debugging. If you're using LINQ with Visual Studio 2008 beta 2 you can download a LINQ to SQL Visualizer which is a useful way of viewing the SQL that is created behind the scenes for you when using LINQ.
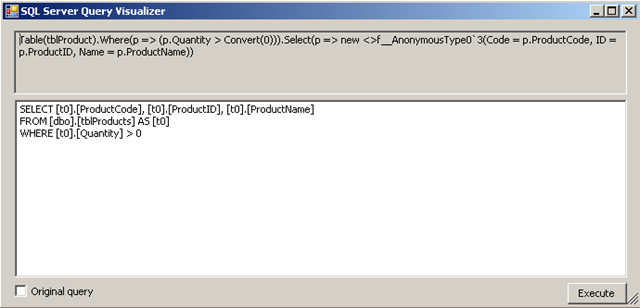
You use it in the same way as other debug visualizers; if you have it installed, when you hover over a query you will see a little magnifying glass as shown below:

Click on it to pop up the debug visualizer which shows you the T-SQL that will be executed. You can edit as you see fit, but if you read my post on LINQ performance you'll know that the out of the box performance is pretty good.
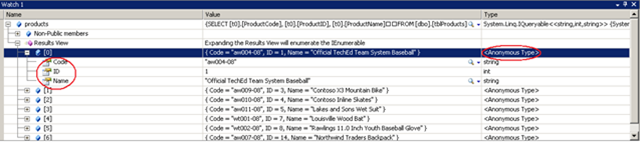
Good as the above is, my favourite thing is part of standard debugging support (i.e. not related to the visualizer). Note that in my example above if you expand the products variable in the watch window you get a nice view of instances of the anonymous type created in my LINQ query, with the types and values of the Code, ID and Name properties all displayed. Oh, and while this next one isn't a debugging feature I just wanted to say that I got intellisense of my anonymous type within the IDE when I was writing the query. Very cool!
Technorati Tags: Microsoft, Develooper, Visual Studio 2008, C#, LINQ, Debugging, Visualizer, Intellisense
Cross posted from ronan's blog