Примечание.
Для доступа к этой странице требуется авторизация. Вы можете попробовать войти или изменить каталоги.
Для доступа к этой странице требуется авторизация. Вы можете попробовать изменить каталоги.
During PASS we announced changes to how users will be able to make parallelism waits more actionable – specifically the “infamous” CXPACKET. This change effectively splits CXPACKET waits into an actionable wait (CXPACKET) and a negligible wait (CXCONSUMER). This change will be effective starting with SQL Server 2017 CU3 and upcoming SQL Server 2016 SP2 (this wait type is already present in Azure SQL Database).
So why split?
It’s important to mention a couple notes before getting into details:
- Parallelism use is intrinsically a benefit for costly queries, bound by the Cost Threshold for Parallelism and Max Degree of Parallelism server configurations among other considerations. See the Query Processing Guide for more in-depth information on how SQL Server implements parallelism. Also refer to Craig Freedman’s blog series on the topic.
- Waits are a normal part of the waits and queues model, allowing SQL Server to concurrently execute many more requests than there are schedulers available. See more about waits and queues here,
It’s also important to understand that parallelism is implemented as if it were two operators. There’s the producers that push data to consumers, and the consumers that may have to wait for data from producers.
And so it becomes easier to understand how producer waits are the ones that may require attention, while consumer waits are inevitable as a passive consequence of longer running producers.
What is what going forward?
With this split, CXPACKET occurs when trying to synchronize the query processor exchange iterator or getting a required buffer.
- This is the actionable wait. If contention on this wait type becomes a problem for most of your workload, consider for example:
- Lowering the Max Degree of Parallelism, which can be done at the server or query level;
- Changing the default Cost Threshold for Parallelism based on observed query cost for your entire workload;
- Or better yet, by improving cardinality estimations if actual rows are very different from estimations. See this previous blog post on how to use the new SSMS Plan Analysis feature to get insights into cardinality estimation differences. Improving estimations can include actions such as updating or adding statistics, revising the underlying index design (consider leveraging the Database Tuning Advisor for this), or even hinting the Query Optimizer in edge cases.
And CXCONSUMER occurs when a consumer thread waits for a producer thread to send rows.
- This is a wait type that is a normal part of parallel query execution, and cannot be directly influenced by changing the above mentioned configurations. This is why I called it "negligible" above.
Where can I see how this affects my SQL Servers?
These wait types will be surfaced at the server level with sys.dm_os_wait_stats, database level with sys.query_store_wait_stats, and session level with sys.dm_exec_session_wait_stats DMVs. The same for sys.dm_os_waiting_tasks, and the WAIT_INFO and WAIT_COMPLETED xEvents.
However, because CXCONSUMER is not actionable directly, this wait will not surface in the Performance Dashboard nor in Showplan.
Practical example
Take the following simple query running in AdventureWorks2016:
 SELECT *
FROM Sales.SalesOrderDetail SOD
INNER JOIN Production.Product P ON SOD.ProductID = P.ProductID
WHERE SalesOrderDetailID > 10
ORDER BY Style
With the resulting showplan:
Since we have wait stats and query time stats in the root node of showplan, let’s see how they look:
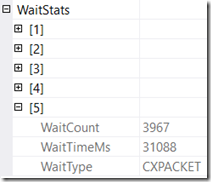
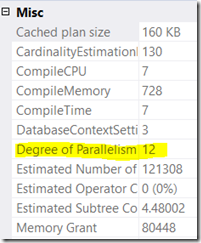
A lot of CXPACKET waits, totaling over 31s, for 1.2s CPU and 2.8s overall elapsed execution time. Also notice from showplan, this query is executing with DOP 12:
As mentioned above, both producer and consumer waits are tracked at the server and session level, so let’s look at sys.dm_exec_session_wait_stats also. Note that any change that is done to improve on the high waits scenario above is aimed at producer waits (CXPACKET), given consumer waits (CXCONSUMER) may inevitably exist a normal part of parallelism:
Ok, so actually most of the parallelism waits are producer waits. We may expect to see consumer waits to go up in the initial moments of parallel query execution, but then stabilize.
A quick way to handle this scenario is to reduce DOP using a hint:
 SELECT *
FROM Sales.SalesOrderDetail SOD
INNER JOIN Production.Product P ON SOD.ProductID = P.ProductID
WHERE SalesOrderDetailID > 10
ORDER BY Style
OPTION (MAXDOP 4)
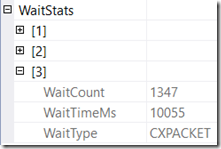
In the resulting plan, here are the wait stats and query time stats:
CXPACKET waits down to just over 10s, for 0.8s CPU and 2.7s overall elapsed execution time. So while the elapsed time remained very similar (although lower), there were gains in reducing CPU usage and waits (3x lower) by adjusting DOP just enough.
Your mileage may vary depending on your setup, but thinking that this query may run at scale in a given environment, the gains are relevant. And were made possible by all the insights unlocked in showplan.
Pedro Lopes (@sqlpto) – Senior Program Manager
Comments
- Anonymous
November 10, 2017
I'm curious why it was running at a DOP of 12 initially? This goes against Microsoft's own guidance for setting MaxDOP and could account for why it was faster when DOP was reduced.- Anonymous
November 10, 2017
The comment has been removed
- Anonymous
- Anonymous
November 10, 2017
One of the best things I heard at PASS Summit! Good work. This will be helpful for us. - Anonymous
November 12, 2017
Great, thanks for sharing that! - Anonymous
December 26, 2017
A related tough subject: I think the cost threshold for parallelism deserves more MS blog attention :). Many in the community are grappling with how to identify "the" appropriate value, and suggesting a non-default value. I realize a proper analysis starts with the ability to capture a replayable load. Assuming such a load can be obtained, what metrics (other than duration) can be collected? No need to answer me here - this just a suggestion :),


